
INTRODUCTION
Additive technology is one of the elements of Industry 4.0 [1]. Industry 4.0 also includes the process of testing technological and functional prototypes using 3D printing [1]. The testing of prototypes helps speed up the process of preparing the technological process for mass production [1]. In turn, testing of functional prototypes with properties similar to those of finished products enables a rapid and almost simultaneous refinement of the product at the prototype stage [1,2]. Testing involves, among other things, geometric analysis of the object through, for example, 3D scanning, and testing the mechanical properties (including rheological properties) of the functional prototype [3,4].
Studying the rheological properties of 3D printed parts is very important, if only because these parts can be subjected to longterm deformation or stress [5]. In the case of parts subjected to long-term deformation, one can speak of the phenomenon of stress relaxation [5,6]. Stress relaxation can be described using Maxwell’s model as presented in several articles [7–14]. Maxwell models have different forms: simple and complex models, for example, models based on Prony series or models described by fractional calculus [13,14]. The stress relaxation of additively manufactured parts can vary depending on the print material used or the technological parameters of 3D printing, as confirmed in the articles [15,16].
In the article [7], the author conducted a study of stress relaxation of samples made by selective powder sintering (SLS) technology from PA 2200 material. Samples were produced setting values for two technological parameters: layer height (0.1 mm – 0.4 mm) and print orientation (0°, 90°). Stress relaxation was determined during uniaxial compression testing. The Maxwell-Wiechert model was used to describe the stress relaxation curves. The results showed a clear influence of layer height on stress relaxation. Additionally, it was shown that the orientation of the print affects stress relaxation.
In [17], the authors conducted stress relaxation tests on PLA material using fused deposition technology (FDM). The samples were produced using two technological parameters of the print: the orientation of the print (0°,45°, 90°) and the presence of a contour. In addition, the samples were subjected to different values of deformation and exposure to different temperatures during the tensile stress relaxation tests. To describe the stress-relaxation curves, 3 models were used: Maxwell, Findley and Linear solid. The results showed that Findley's law was the most appropriate empirical expression to predict the PLA tested. Stress distributions ranging from 11% to 14% were obtained. Both cooled and heated samples provided degradation of the quasistatic and long-term material properties. The presented results show the importance of stress relaxation effects in AM PLA structures.
In the article [11], the authors investigated, among other things, the stress relaxations of samples made of G6-Impact nanocomposite using MEX material extrusion technology. The samples were made using the parameter of variable printing direction (0/45/-45/90/90/-45/45/0). The following were carried out: tensile stress relaxations, bending stress relaxations and compressive stress relaxations. On the basis of the results, it was found that the bending mode had the lowest relaxation, while the highest relaxation was observed for the tensile mode.
The viscoelastic behaviour of the materials strongly influences their application area [18,19]. The literature review presented above shows that the viscoelastic behaviour of 3D printed polymers depends on factors such as material type, 3D printing process, and type of load [2,10,20,21]. However, due to the limited number of studies in the field of stress relaxation of 3D printed materials, there is a need for continuous expansion to better understand this phenomenon.
Consequently, the purpose of the article was to determine the elastic moduli and dynamic viscosity coefficients of the PA 2200 polymer material. This material is well suited for medical devices such as orthoses or biomodels. The calculations used the five-parameter Maxwell-Wiechert model to determine the stress relaxation in the material. This research is very important because the calculated coefficients and modulus can be used in engineering calculations.
MATERIAL AND METHODS
. Material PA2200
The test samples were made from PA 2200, This material is a powdered whitish fine polyamide. Prints made from polyamide powder have good mechanical properties, stiffness, and chemical resistance, similar to those of other materials used in industrial applications [20,22]. Table 1 focusses on the properties of PA 2200 as given by the manufacturer (EOS GmbH, Krailling, Germany) [23].
Tab. 1.
Properties of PA 2200 powder [23]
The PA 2200 material is biocompatible according to EN ISO 10993-1 and is USP / level VI / 121°C and approved for food contact according to the European Directive 2002/72/EC (except for alcoholic products) [23]. This polyamide can be used to manufacture consumer parts, medical devices, and functional plastic parts [2].
. SLS technology
In the presented research, the well-known Formiga P100 machine (EOS GmbH, Krailling, Germany), which realises selective laser sintering - SLS technology, was used to build models. This machine makes it possible to produce physical plastic-based models with dimensions that do not exceed the dimensions of the working chamber of 250 mm × 200 mm × 330 mm. In the mentioned technology, a CO2 laser is very often used to sinter the input material in the form of powder. The entire technological process is performed in an inert gas. The production scheme using SLS technology is shown in Figure 1 [2,24,25].
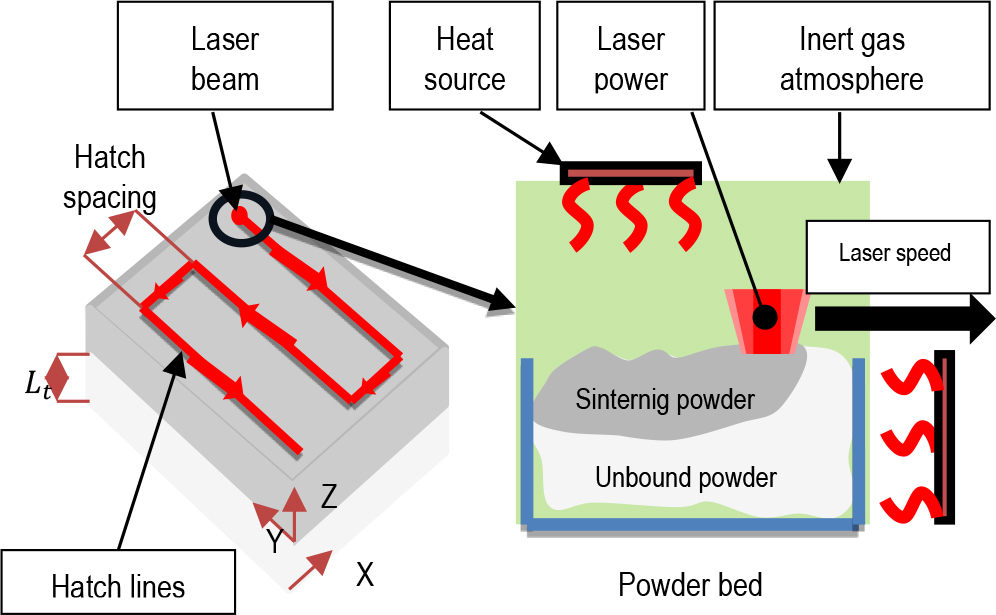
Fig. 1 also provides an explanation of the technological parameters in SLS technology such as layer thickness Lt, hatch spacing, laserpower and laser speed.
. Samples Preparation
The test samples were designed in SolidWorks according to ISO 527. The shape of the samples are paddles with the dimensions in millimeters shown in Figure 2(a).
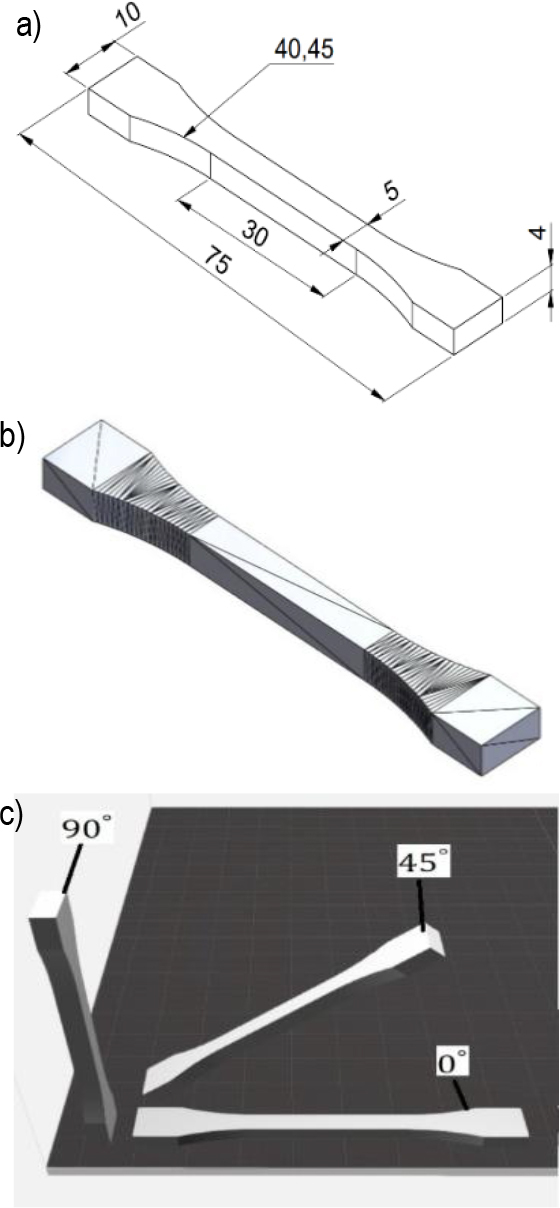
The STL files of the samples were saved with the following approximation parameters: linear tolerance of 0.007 mm and angular tolerance of 5°. The appearance of the sample in the STL record is shown in Figure 2(b). Six types of samples were produced with different 3D printing technological parameters, each variant was parted 10 times to account for statistical calculations.
The analysed technological parameters of 3D printing were energy density Ed, print orientation Pd and layer height Lt whose values are shown in Table 2. Interpretations of the positioning of the samples on the work platform are shown in Figure 2(c).
Tab. 2.
Values of technological parameters
| Ed | Pd | Lt | |
|---|---|---|---|
| 0.056 J/mm2 | 0.076 J/mm2 | 0°, 45°, 90° | 0.1 mm |
| P = 21 W | P=22 W | ||
| v = 2500 mm/s | v = 1970 mm/s | ||
The energy density Ed transferred to the sintered layer was calculated using Equation 1 [5,24]:
where: – laser power, W;v – laser beam speed, mm/s.; h = 0.25 mm (distance between successive laser beams); d = 0.42 mm (diameter of focused beam); x = 1.68 (overlap factor).Each individual sample was labelled according to the formula:
. The Maxwell-Wiechert model
A complex five-parameter Maxwell-Wiechert model was used to describe the stress relaxation curves obtained from the stress relaxation tests. Approximations of this model to experimental curves were carried out with the OriginPro software using the Levenberg-Marquardt algorithm. The mechanical analogy of the Maxwell-Wiechert five-parameter model is shown in Figure 3 [5,13].
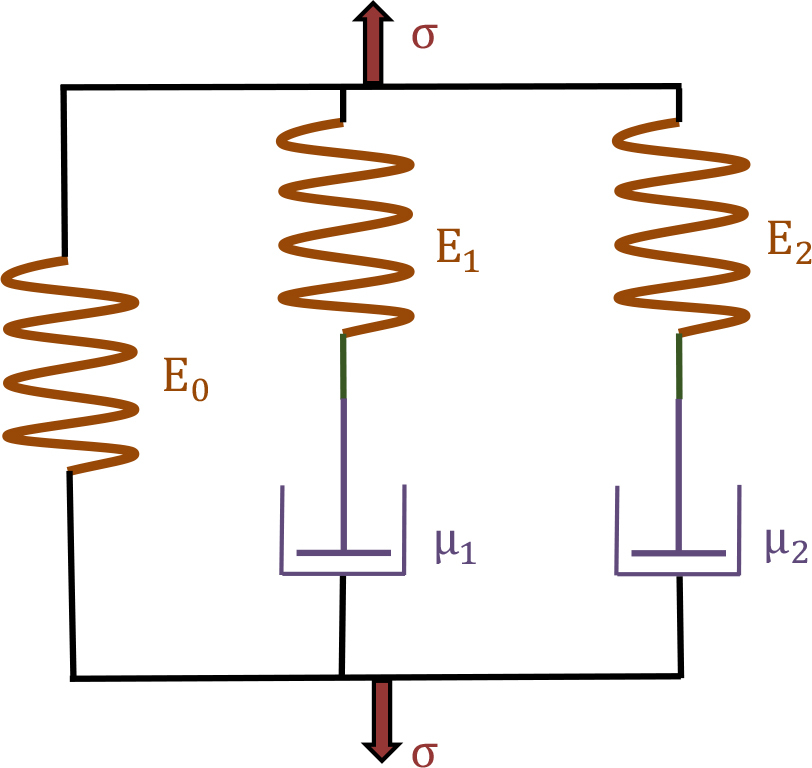
The equation describing the Maxwell-Wiechert model consisting of five parameters is as follows [5,13]:
where t1, t2 are there relaxation times (s) of each model:After transforming equations (2) and (3), an equation was obtained describing the five-parameter Maxwell-Wiechert model, including all the parameters of this model [5,13].
where: ε0 – unit initial strain; E0, E1, E2 – moduli of elasticity, MPa; μ1, μ2 – coefficients of dynamic viscosity, MPa; t – time, s.The equivalent modulus was also calculated using the following formula [5,13]:
where: E0, E1, E2 – moduli of elasticity, MPa.The decrease in stress after time t was calculated using the formula [5,13]:
where: σ0 – initial stress, MPa; σt – stress after time t, MPa.. Measurement technologies
Stress relaxation tests were conducted using a Hegewald & Peschke Inspekt 3kN testing machine. The test parameters used to conduct the stress relaxation tests were: preload Fp = 100 N, speed of displacement of the machine crossbar to achieve the set strain vmm = 10 mm/s, permanent strain ε0 = 0.02, test duration t = 600 s. The test specimens were subjected to tensile stress, as can be seen in Figure 4.
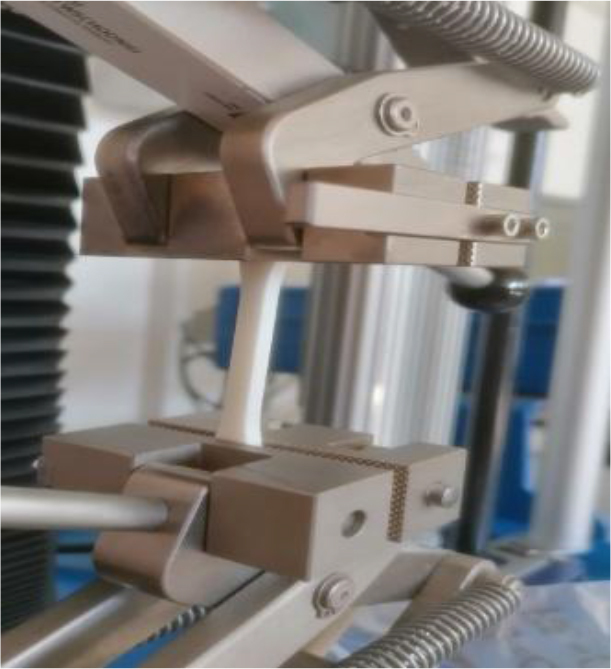
The test samples were exposed to tensile stresses.
RESULTS
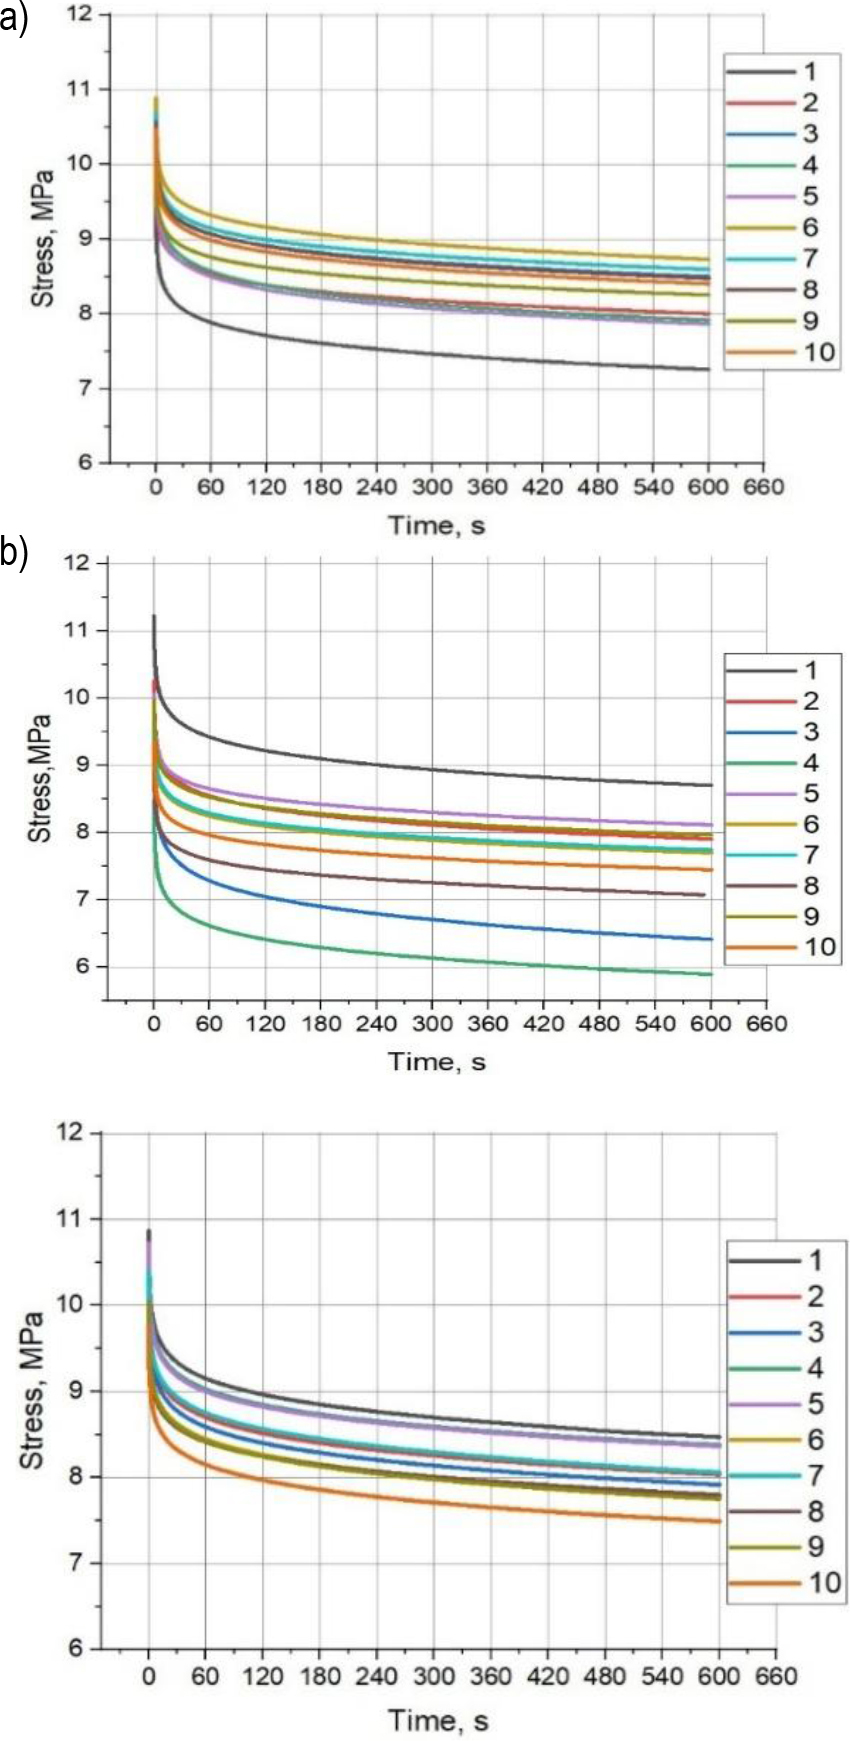
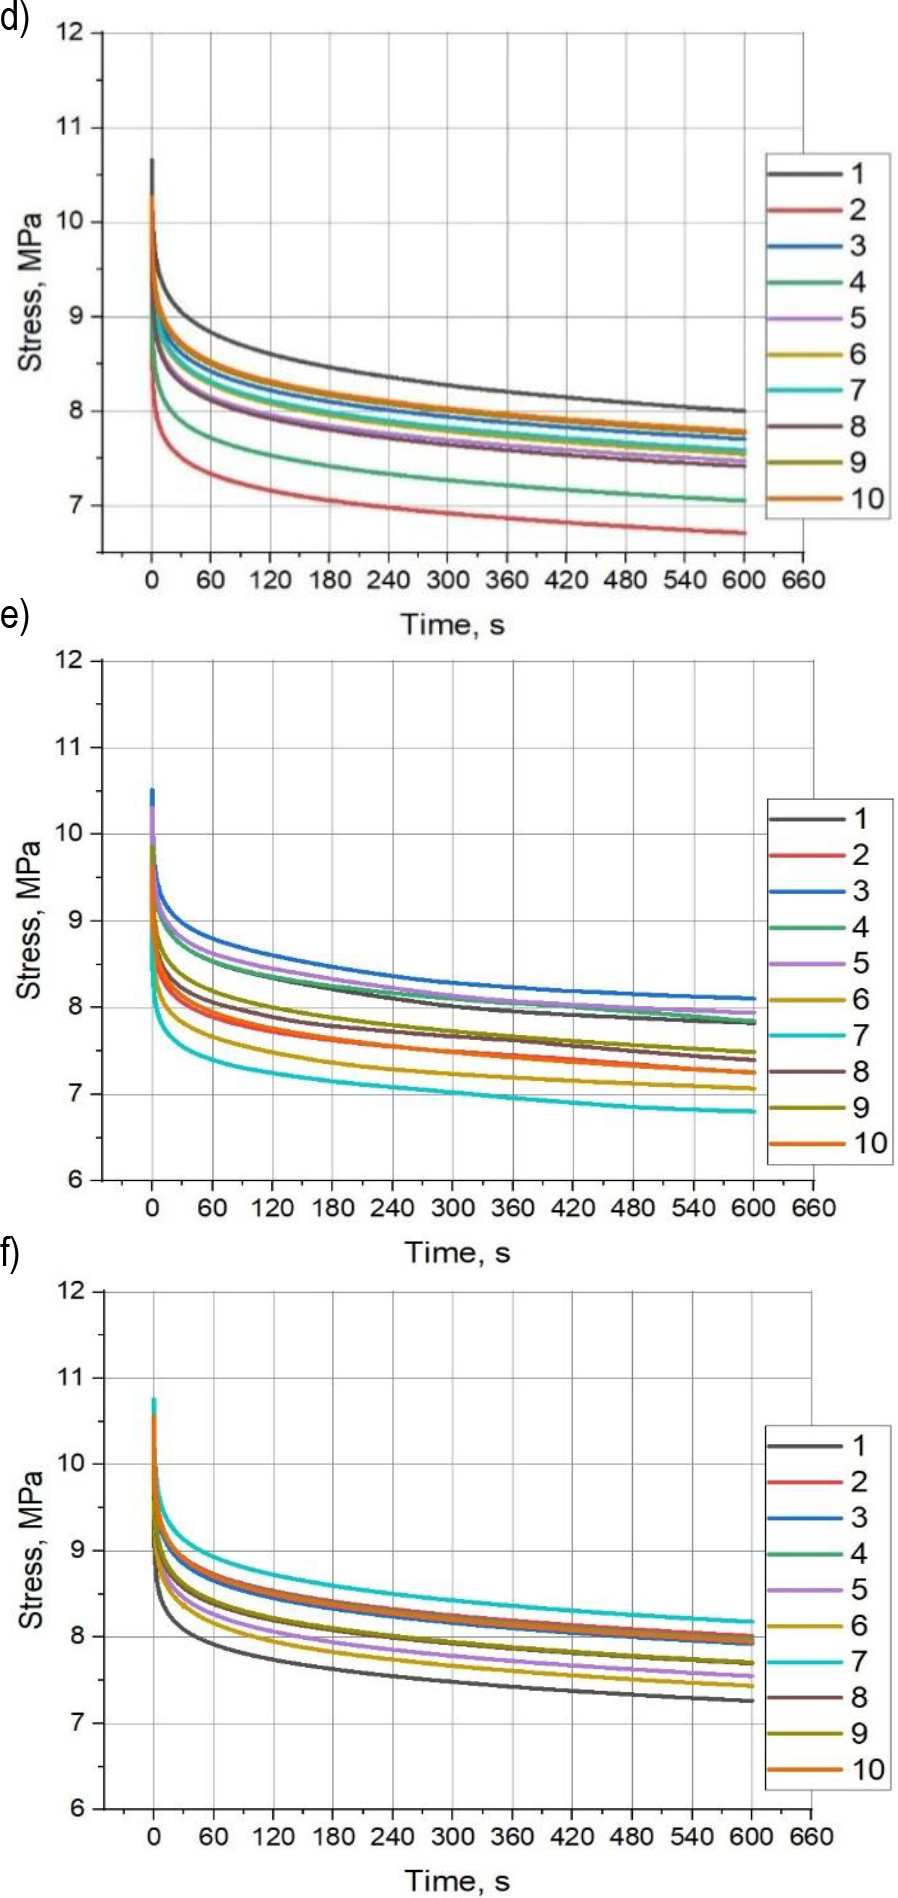
Stress relaxation tests were performed, resulting in stress relaxation curves. These curves are shown in Figures 5 and 6.
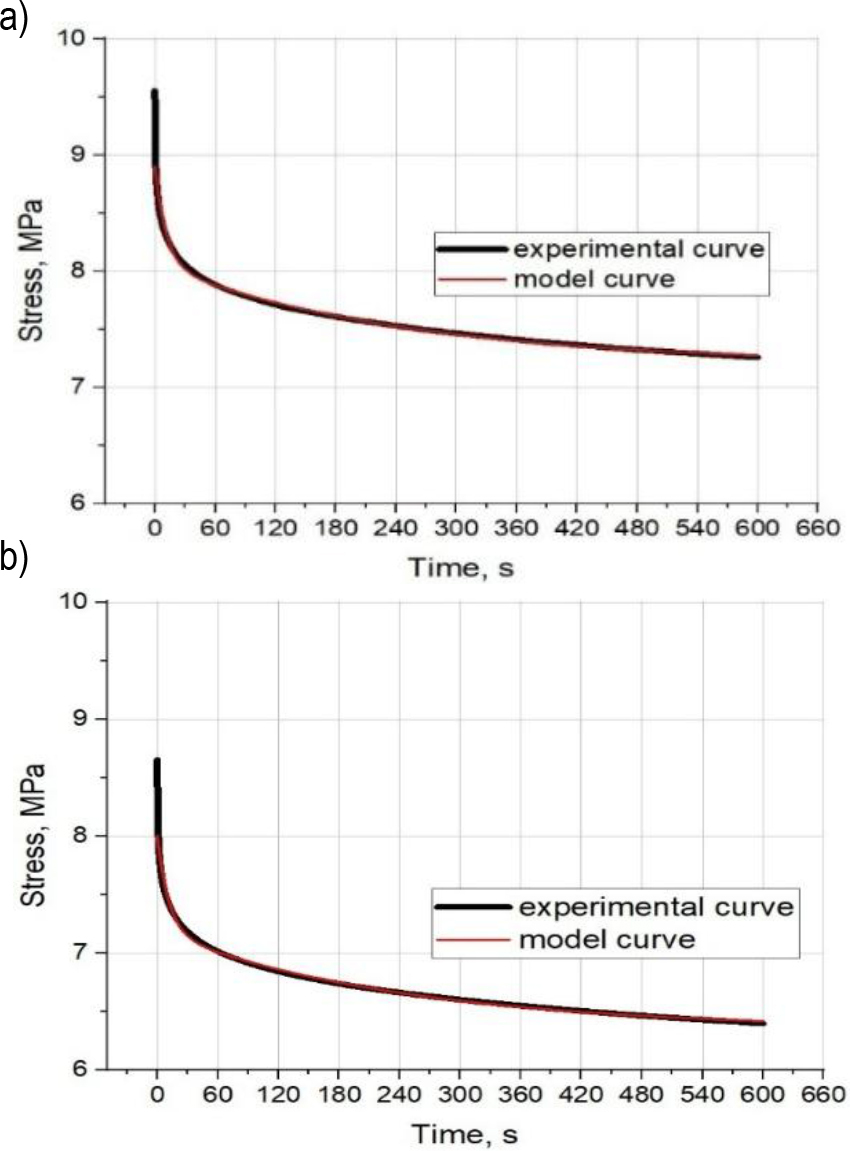
For each individual curve, a five-parameter Maxwell-Wiechert model was approximated using the Levenberg-Marquardt algorithm. An example of the appearance of these fits for selected relaxation curves is shown in Figure 7.
As a result of fitting of the five-parameter Maxwell-Wiechert model with five parameters to the stress relaxation curves, the values of model parameters σ0, σ1, σ2, σ1, σ2 and fitting coefficients Chi2, R2 were obtained. The values of these parameters and welding coefficients were separated into two tables 3, 4 due to the energy density of the technological 3D printing parameter energy density occurring in two values Ed = 0.056 J/mm2 and Ed = 0.076 J/mm2.
Tab. 3.
Maxwell-Wichert model parameters and fit coefficients;
Tab. 4.
Maxwell-Wichert model parameters and fit coefficients;
Based on Table 3, high standard deviation values of standard deviations can be seen for t2 relaxation times. Low standard deviation values were obtained for the other parameters of the Max-well-Wiechert model and the fit coefficients Chi2, R2.
Analysing the data collected in Table 4, high values of standard deviations can be observed for the t2 relaxation times. Low standard deviation values were obtained for the other parameters of the Maxwell-Wiechert model and fit coefficients Chi2, R2.
Based on the average values of the Maxwell-Wiechert model parameters
The stress relaxation curves obtained from the tests were used to calculate, according to Equation (6), the percentage decrease in stress Rσ after time t. The values of the percentage decrease in Rσ stress are shown in Table 5.
Tab. 5.
Percentage of stress drop in PA2200 material
| Rσ, % | |||
|---|---|---|---|
| Pd | 0° | 45° | 90° |
| 20.98 | 23.85 | 22.61 | |
| SD | 1.86 | 4.86 | 0.56 |
| 24.5 | 23.6 | 24.1 | |
| SD | 0.4 | 0.5 | 0.4 |
In the data in the table above, it is evident that the highest decrease in stress occurred for
In the data in the table above, it is evident that the highest decrease in stress occurred for
DISCUSSION
The translation of stress relaxation curves seen in Figures 5 and 6, and particularly noticeable for samples printed according to technological parameters
Based on Figure 7, the Maxwell-Wiechert fit of the five-parameter model to the stress relaxation curves is strong. This can be concluded not only from a visual assessment of Figure 7 (the red line overlaps with the black line), but also by turning our attention to the values of the Chi2 fit test coefficients and R2 determination coefficients shown in Tables 3 and 4. It should be mentioned here that the R2 determination coefficient always varies between ‘0’ and “1” and is a measure of the fit of the regression equation R2 values close to “1”, i.e. those shown in Tables 3 and 4, indicate that the regression equation is very useful to predict the value of the dependent variable Y with the independent variable X. For the Chi2 concordance test, values close to ‘0’ indicate a strong model fit.
The high standard deviation values for the stress relaxation time t2(Table 3 and 4) may be related to dynamic viscosity. The dynamic viscosity, on the other hand, depends on the structure at the molecular level of the material in this case PA 2200, which is a polymer. Polymers are made up of long polymer chains that form numerous intermolecular interactions.
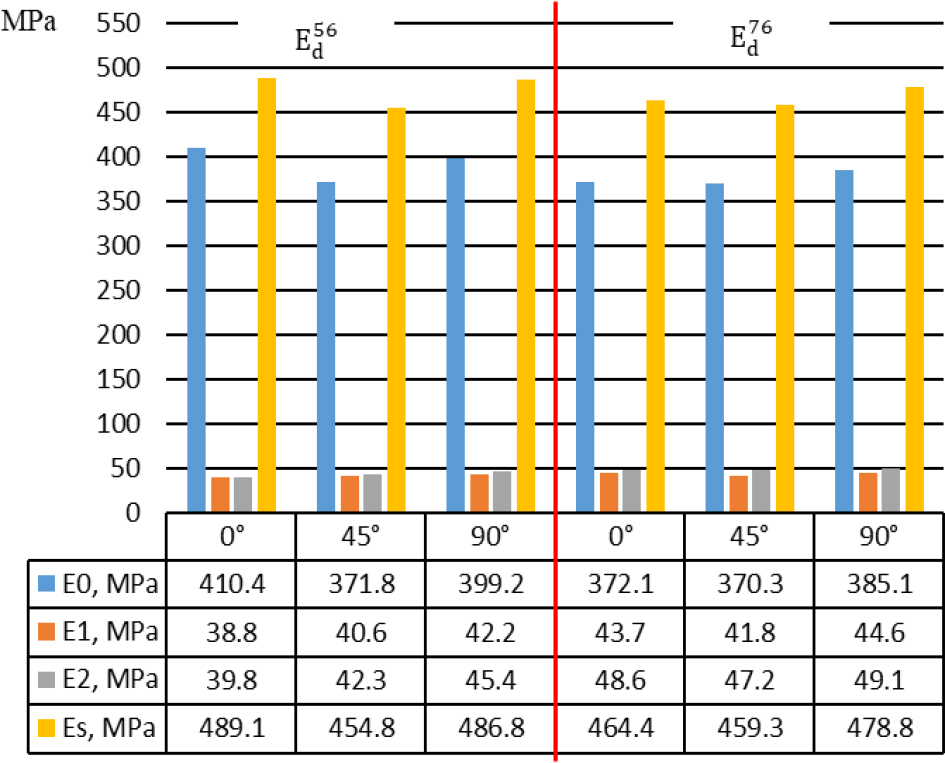
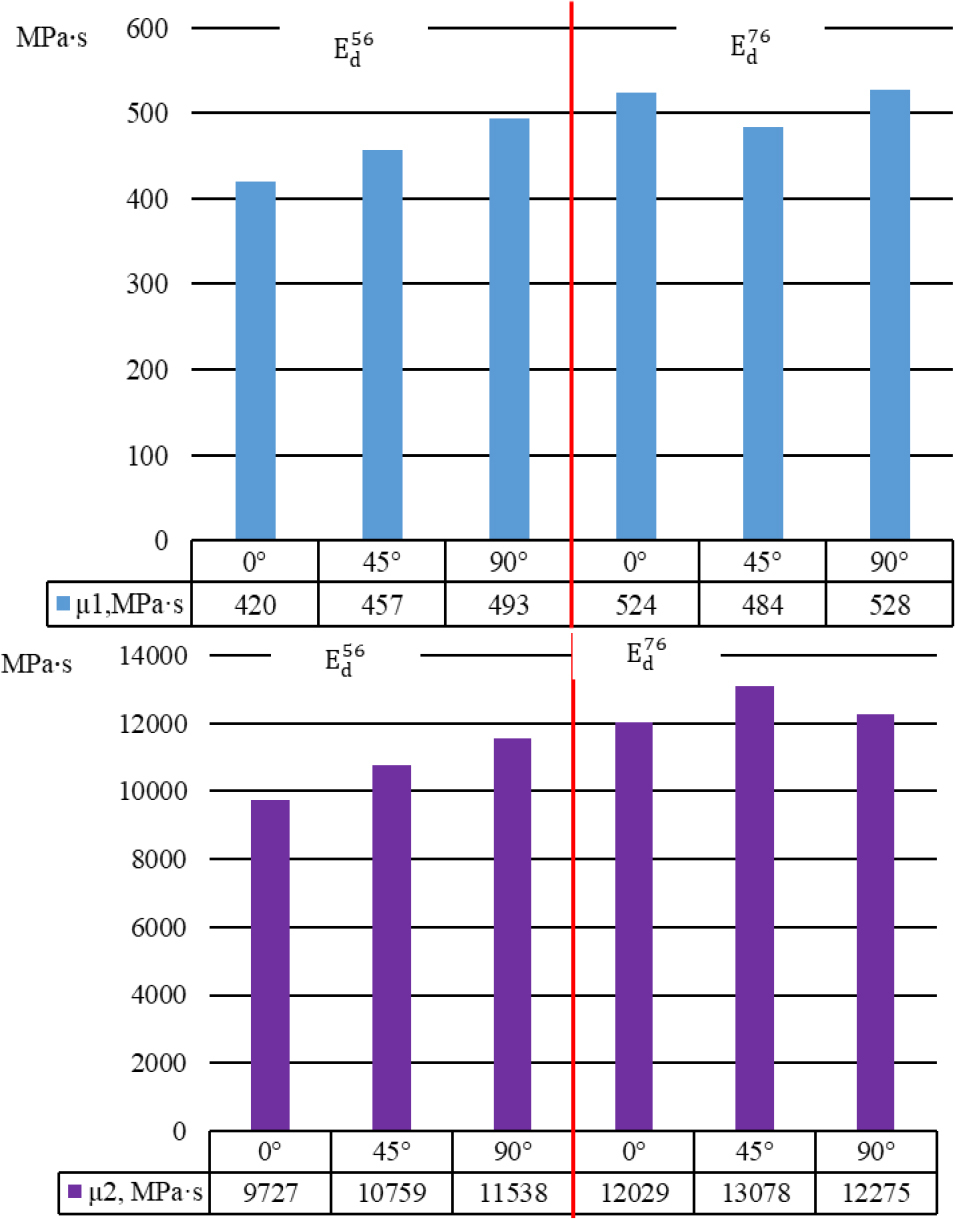
When analysing the data in Figures 8 and 9, that is, the elastic moduli E0, E1, E2and the dynamic viscosity coefficients μ1, μ2, one can see a slight anisotropy of the stress relaxation properties due to the orientations of the print.
Analysing the elastic moduli E0, E1, E2 p shown in Figure 8, it can be concluded that, there are differences within the same direction, e.g. the modulus of E0 is many times greater than the moduli of E1, E2. This regularity informs that in terms of viscoelastic properties the material produced by selective laser sintering technology can be quasi-isotropic.
Analysing the different print orientations 0°, 45°, 90° for the equivalent moduli Es and dynamic viscosity coefficients μ1, μ2 shown in Figures 8 and 9, it can be seen that there is a difference in values between the applied energy densities Ed = 0.056 J/mm2 and Ed = 0.076 J/mm2. The equivalent moduli of Es for print orientations 0°, 90° and energy density
However, for energy density
CONCLUSSIONS
On the basis of the results of the stress relaxation tests, the following general conclusions can be drawn:
– A strong fit of the Maxwell-Wiechert model to the stress relaxation curves, confirmed by the values of the Chi2 consistency and R2 determination test coefficients.
– A small anisotropy of rheological properties was detected due to the orientation of the print.
– Increasing the energy density from 0.056 J/mm2 to 0.076 J/mm2, or the equivalent modulus Es, it increases in 0°, 90° orientations. The opposite is true for this modulus in the case of 45° print orientation.
– Increasing the energy densities from 0.056 J/mm2 to 0.076 J/mm2 also increases the values of dynamic viscosity coefficients μ1, μ2 in the 0°(9727 MPa · s ↑ 12029 MPa · s),45°(10759 MPa · s ↑ 13078 MPa · s),90°(11539 MPa · s ↑ 12275 MPa · s) print orientations.
– Increasing the energy densities from 0.056 J/mm2 to 0.076 J/mm2 also increases the values of the percentage stress drop Rσ in the 0°(20.98% ↑ 24.5%), 90°(22.61% ↑ 24.1%) print orientations. In the case of 45° (23.85% ↓ 23.6%) print orientation, the trend is reversed.
The calculated values of the elastic moduli E0, E1, E2 and dynamic viscosity coefficients μ1, μ2 can be used to model components produced by selective powder sintering (SLS) technology from PA2200 material. In particular, the application of these moduli and dynamic viscosity coefficients can be found in engineering calculations.