INTRODUCTION
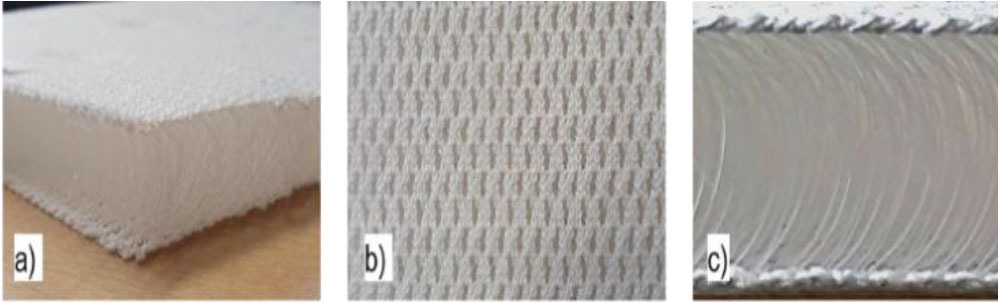
Spacer fabrics offer a unique combination of properties suitable for various applications. They are typically composed of three layers (Figure 1a): the front layer and back layer (Fig. 1, b) and the spacer area (Fig 1, c). The top and bottom layers are warp knitted (refer to [18, 19,20]). The spacer area comprises a series of monofilaments, which can be integrated in different ways, allowing for a shift between the meshes of the top and bottom layers. Due to their versatility, there is a high interest in experimental research concerning the mechanical properties of spacer fabrics, see e.g. [2], [9]–[11].
Fig. 1.
Principal construction of spacer fabrics – a) 3D-structure, b) front and back side, c) spacer area
In particular, the compression resistance of spacer fabrics finds utility in diverse applications such as in shoes, car seats, furniture, and others [1]. In recent years, researchers have delved into producing weft knitted spacer fabrics and into investigating their properties, as discussed in [2], showcasing potential for shaping in three dimensions.
This paper first experimentally and numerically investigates the compression resistance of spacer fabrics. In a second step, parallel seams are added perpendicular to the front and back layer. This leads to local sections in the spacer fabric and the fabric becomes with the variable thickness. A range of sewing parameters, such as the seam placement, stitch length, distances in-between adjacent stitches and the stich-yarn pre-stress are investigated. A numerical simulation approach is proposed to investigate the influence of these parameters on the compressional behavior. Related numerical investigations for the compressional behavior of warp knitted fabrics can be found in [3]–[12].
The numerical computations in this paper are based on the following input: the spacer fabrics scheme, also used by the producing machine (see [1]) and the yarn’s elastic and contact properties. Due to the employment of an efficient one-dimensional model based on asymptotic methods (see [13]–[17], [21]–[27]]), the computations can be performed fast. The resulting meso-scale model represents an idealized textile structure, neglecting stochastic effects in manufacturing such as variations in the yarn cross sections along the yarn length. A potential remedy is the structure generation based on CT-scans, which leads to a high accuracy in the textile representation as demonstrated in [7], at the cost of an expensive data acquisition method.
First, the effective compression behavior of a spacer fabric without seams is modeled on the yarn level and homogenized and then the influence of seams is modeled. Such multi-scale models simplify the optimization procedure of the design of seam-placing, e.g., to reach desired compressional fabric properties. The investigations provide a fundamental basis for engineering designs of such products in the future. This is the novelty of the approach for the application.
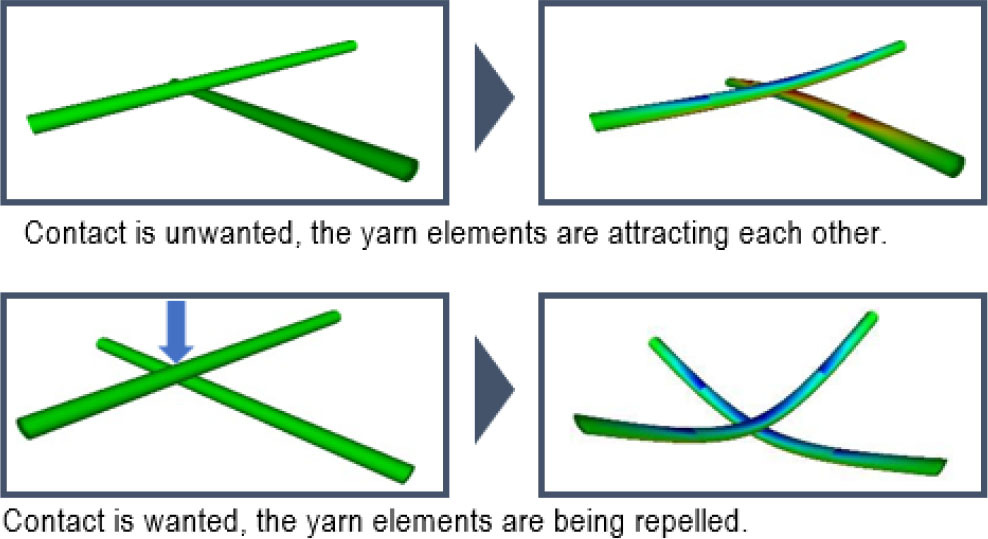
− Another novelty of the paper is the numerical approach for the evolutional contact search for yarn-made materials, presented in Section 3 and Appendix, which is a research novelty in the field of the applied- problem simulation. The simulations allow to reduce the number of time-expensive experiments for spacer fabrics with and without seams.
− The next novelty of the paper is a discussion of a possible multi-linear behavior of the spacer fabric under the compression and the explanation of bounds and the phenomenology of its behavior from the structural large rotation, or buckling effects on the yarn level, as well as due to the changing number of the contact points between monofils on the large compression strains.
For the experimental investigation, calibration and validation of the numerical models, compression tests according to the test standard DIN EN ISO 3386-1 are performed. The compression forces dependent on the compression distance are measured. The experimental results are analyzed and investigated in terms of the influence of the variation of the seam distance.
The simulation of the spacer fabric on the yarn level with TexMath, [16], requires all structural details about the composition of the spacer fabric, as well as the force-strain measurements of each yarn’s properties and the frictional coefficients between the yarn pairs.
First, a model of the spacer fabric without seams is developed. The experimental compression test is recreated in the simulation. With this, the friction coefficients between yarns can be calibrated. The size of the specimen (height) is the same as in the experimental part. After the material model is calibrated, the same material model is used for the following simulation models of the spacer fabrics with seams. All contacts with the seam yarns will be found, the seam yarn will be pre-stressed and the whole fabric relaxed, which leads to its local and particularly global compression. In the last step, the compression test with a rigid punch and this fabric is repeated. Dynamical contacts, see Appendix, will be found.
DESCRIPTION OF THE COMPRESSION TEST WITH A RIGID PUNCH ON THE SPACER FABRIC AND THEN ON A ROUGH FABRIC LAYER WITH SEAMS
. Material
Four different spacer fabric variation have been produced, tested and modelled. All spacer fabrics are manufactured by Essedea GmbH/D. All specimens’ initial state is the spacer fabric without seams, seen in Fig. 2 a – bottom/ Fig. 2, b – top/left.
Fig. 2
Spacer fabric variations for experimental testing: (a) cross view, (b) top view; h cushion heigt, d seam distance
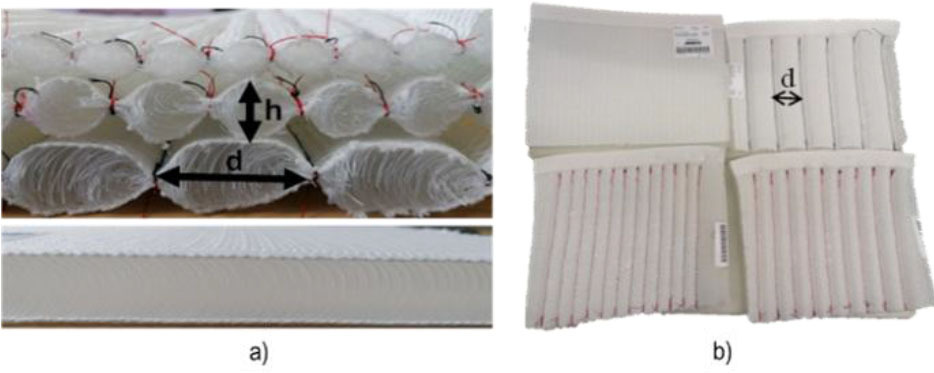
To the three other specimen seams in various distances have been inserted. The seams have been inserted with a Dürkopp Adler sewing machine Delta “M-Type”. The seam distances are constant for each specimen and have average seam distances of 18 mm, 24 mm and 43 mm. Within the sections between the seams a cushion area occurs, whose overall shape significantly differs between the considered seam distances. The measurement of the seam distance and cushion height can be seen in Fig. 2. A summary of the material data is listed in Tab. 1.
Tab. 1.
Technical data of the spacer fabric specimen
. Experimental test set up to test the compression behaviour of spacer fabrics
To test the compression behaviour of various spacer fabrics, each specimen is tested according to DIN standard 3386. The specimen properties can be seen in Table 1.
The compression tests were performed at a Zwick Z 2,5 (Zwick GmbH, D). A force sensor of 500 N and pressing plates with an area of 121 cm2 (perforated) were used. The speed was 100 mm/min. In Fig. 3 the experimental compression test of the spacer fabric without seams (a), with seams (b) and of the edge-force-test (c) can be seen.
Fig. 3.
Test setup for various compression tests (a) spacer fabric without seams, (b) spacer fabric with seams, (c) Edge-force-test to a spacer fabric without seams

Mathematical formulas should be type written in mathematical style, aligned to left and numbered irrespective of chapter numbering.
. Experimental test set up to test the compression behaviour of spacer fabrics
In Fig. 4 experimental results of the compression tests with sectioned spacer fabrics with seams are presented. Because the initial heights of all tested specimens are different due to the seam placement, the curves are visualised as if the compression plates start at the same plate distance of 20 mm. This means, that for the specimen with a seam distance of 18 mm and an average cushion height of 12 mm, the force measurement starts between 8 – 12 mm.
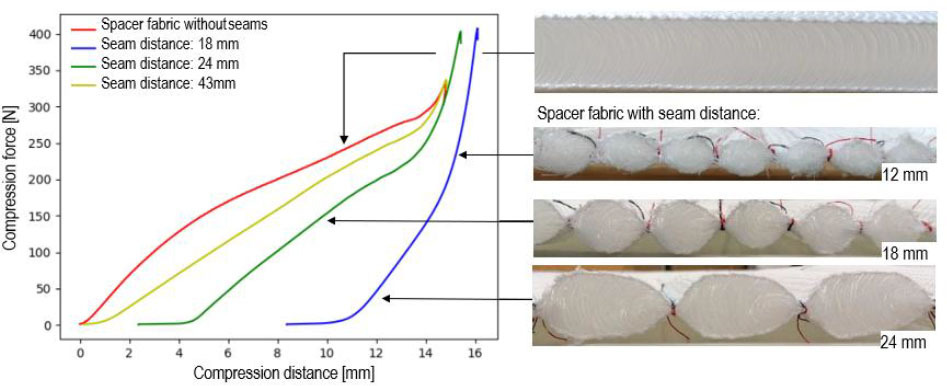
It can be observed that all curves can be sectioned into three main areas. A first section, where the force increases slightly over the compression distance. A second section, where except for the spacer fabric without seams, a higher, nearly constant increase of the force over the distance can be seen. And a third section, where the material is stiffened up even more compared to section two.
In the first section it can be seen that the more seams are inserted, the longer the section of the low force/compression magnitude exists. The result is to be expected, since the more seams are inserted, the more the spacer threads are bent, reducing their capability to absorb forces. Another reason is that the heights of the sectioned areas of the spacer fabric differ more. This can be seen in Fig. 4. The deviation from the average height of the specimen with a higher seam number is higher. Thus, not all sections absorb forces at the same time. The compression plate is getting in contact with one cushion after another and not with all cushions at the same time. This leads to a lower compression force increase. This assumption is supported by investigating the compression force – compression distance – curve of the spacer fabric without seams (Fig. 4., red curve), which has a nearly constant height and thus the contact with the compression plate is at the same time at every point of the spacer fabrics surface. This results in a direct increase in force.
In the next graph section, the fabrics are stiffened up by the reduced thickness and the increased fibre density.
In conclusion a spacer fabric with more seams can absorb less compression forces due it previously inserted compression force through the seams. But the more seams are inserted, the stiffer the spacer fabric gets due to its structural change and locking of movements of the pile threads.
DESCRIPTION OF THE COMPRESSION TEST WITH A RIGID PUNCH ON THE SPACER FABRIC AND THEN ON A ROUGH FABRIC LAYER WITH SEAMS
This section is devoted to the simulation of the described above experiment with the chosen spacer fabric on the yarn level. First, the effective behavior in the elastic deformation range (before the monofil buckling) is computed. Afterwards, seams are virtually placed and the evolutional contact of a punch with the spacer fabric with and without seams is simulated.
In the first simulation setup, the spacer fabric is resolved on the yarn level in the software package TexMath [16]. The virtual yarn structures are created based on the available pattern data and in visual comparison to the physical samples. The analyzed virtual structures are assumed to be deterministic and of periodic nature which minimizes computational effort. These assumptions are not too restrictive, since deviations from the deterministic structure are small in the machine produced fabrics.
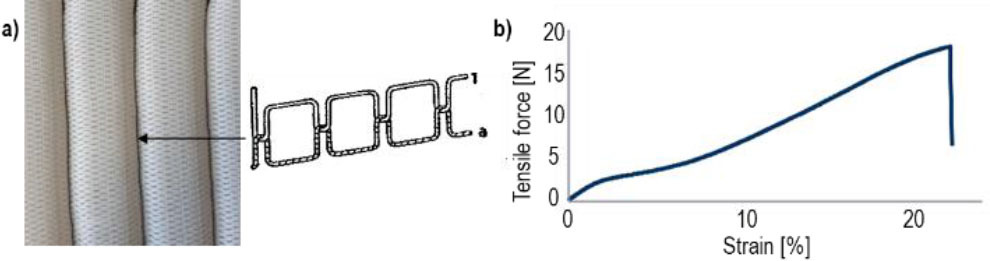
For the simulations, an elastic frame-description of the structure is chosen: In our model, each yarn is individually parametrizable by its cross-sectional shape as well as its linear material properties, i.e., its Young’s modulus as well as its Poisson’s ratio. In accordance with the physical sample, we differentiate between three different sets of yarns for the spacer fabric itself, see Fig. 5, as well as an additional yarn type for the seam. Their respective material parameters are determined experimentally by standard tensile tests, see Fig. 6, but one might alternatively consider literature values if the material itself is known a priori.
Fig. 5.
(a) Individual yarn types highlighted in purple, (b) + (c) the virtual spacer fabric sample on the right, compared to the physical sample in the middle
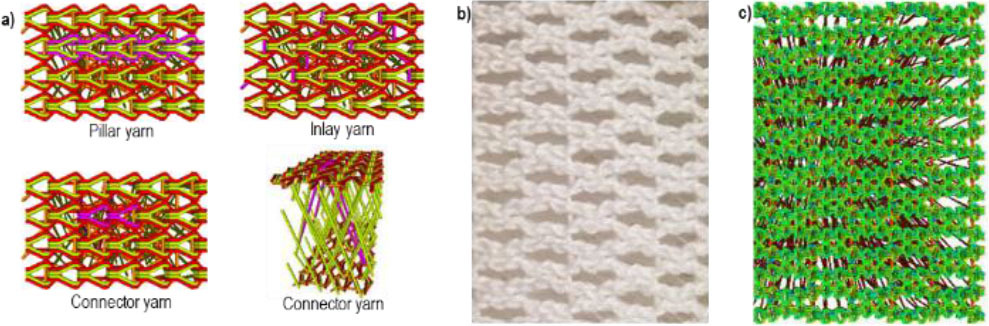
Fig. 6.
(a) Schematic representation of the double lock stitch, (b) measured force-strain curve for the yarn material
For simulations of elasticity problems such as the compression of the spacer fabric as well as the seaming process, a beam FE formulation with additional contact conditions in-between yarns as well as in-between textile structure and pressing plates is considered, see e.g. [14] for further details. The presented models were already successfully employed for the simulative prediction of the effective mechanical properties of spacer fabrics as well as their air- permeability in [15].
After creation of the virtual spacer fabric sample, an optional additional simulative step is performed in which the seams are added. A schematic illustration of the employed double lock stitch is shown in Fig. 6. The double lock stitches are included in the structure as highlighted in purple for a cross section in Fig. 7 based on the chosen seam distance as well as the stitch distance. As can be seen, the stitch yarn is initially perpendicular to the knitted layers of the fabric but modelled with an effective pre-stress resulting from the machine’s needle tension, which causes local compression as depicted in Fig. 8. In order to achieve the experimentally attained compression profile along the fabric, it is vital to resolve all contact points between the yarns in the spacer fabric and the stitch yarn.
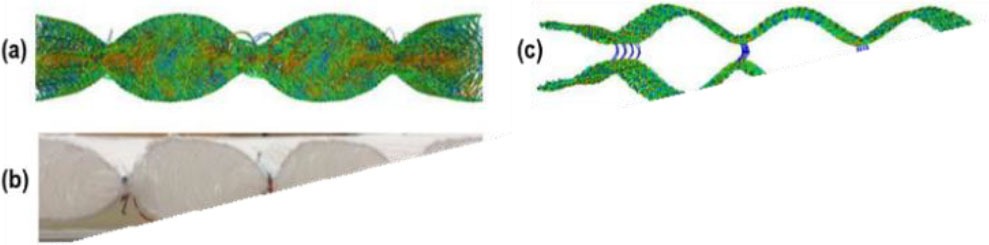
Fig. 7.
Axial stresses in the pre-stressed seams and yarns of the spacer fabric simulated with (a) + (b) TexMath- tool and (c) Abaqus - Colours indicate local stresses.
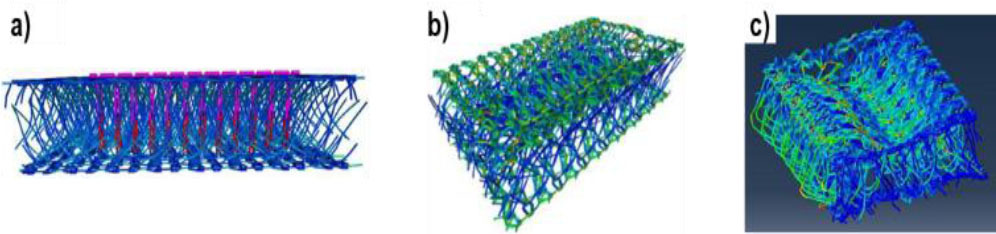
Fig. 8.
Visual comparison of the spacer fabric with 43 mm seam distance (a) simulated and (b) experimental manufactured and simulated spacer fabrics with (c) 24 mm seam distance and (d) 18 mm seam distance
The simulatively attained compression profile for the sewing distance of 43 mm is presented in Fig. 8 on the left. In order to ensure efficient computations, periodicity in the viewing direction was exploited with corresponding boundary conditions. The cushion height of the physical sample is closely met with 20.3 mm. For the other sewing distances, the model predicts the values 10.23 mm and 14.33 mm. Their profiles are shown on the right of Figure 8. For better visualization of the contracted lock stitch, we only visualize pillar and inlay yarns.
An intuitive model parameter that can be analyzed and optimized is the stitch yarn’s pre-stress. Fig. 9 shows the simulation result for the seam distance of 43 mm but with only a 15 % relative strain. As can be seen, this value is not large enough to overcome the rigidity of connector yarns, leading to a drastically differing compression profile.
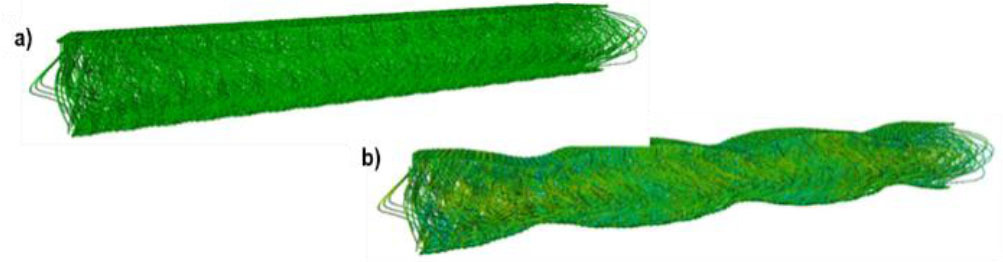
Fig. 9.
Spacer fabric with seam distance of 43 mm before and after applying the pre-stress to the stich yarn
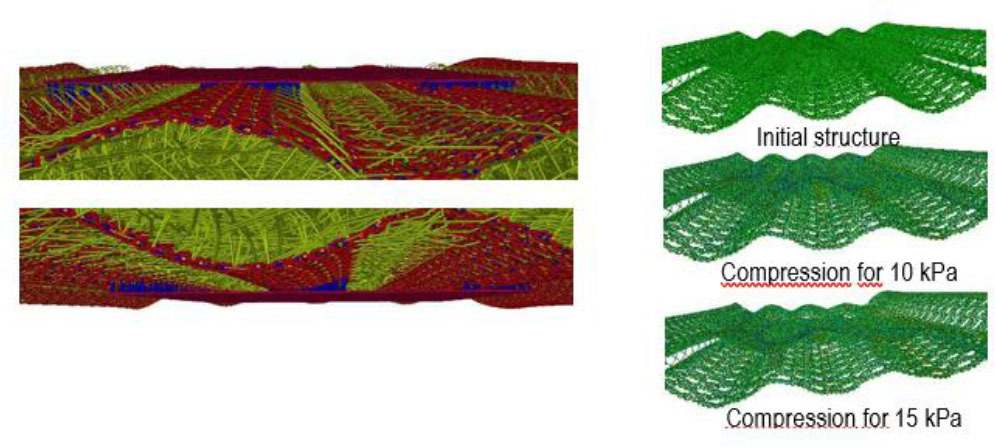
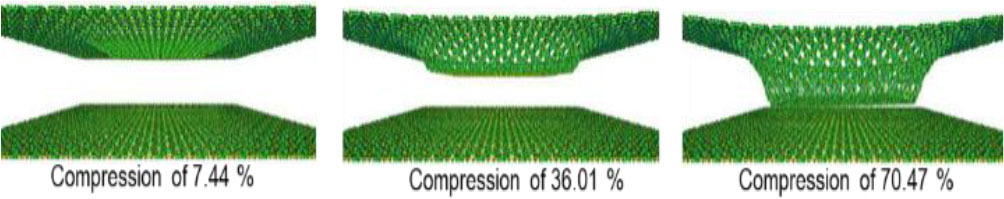
Finally, the compression experiments described in the previous section are performed on the virtual samples. For the simulations, dynamic contact conditions are prescribed in-between the compression plates and the fabric. The applied load is assumed to be uniformly distributed across the top plate, while the bottom plate is assumed to be stationary. The simulation predicts the state in which the compressive stiffness of the analyzed sample and the applied compressive stresses are balanced. A qualitative demonstration of the predicted compression profiles for the un-stitched spacer fabric sample are demonstrated in Fig. 10 for an increasing value of applied compressive force. The details of the algorithm can be found in Appendix. For better visualization, only the pillar and inlay yarns are shown.
Fig. 10.
Qualitative comparison of compression profiles at increasing compression levels for unstitched spacer fabric sample
The simulatively attained compression values for the un-stitched sample as well as for the sample with stitch distance of 24 mm are presented in Fig. 11. By comparison with the experimental values, a good agreement of the model prediction till 30% compression can be observed. For larger compression values, it should be accounted for further changing parameters. First, the large deformations should be accounted for, i.e., the inextensible monofils preserve their length, whose curve would be arcs, parts of circles under compression, if they were not in a contact with each other. Furthermore, large bending leads to the increment of the contact point number between monofils, which changes the linear compression behavior of the fabric. It is possible to account for this, but it is out of the scope in this work.
Fig. 11.
Simulative and experimentally attained compression values for unstitched spacer fabric and sample with seam distance of 24 mm. Visualization of compressed samples below
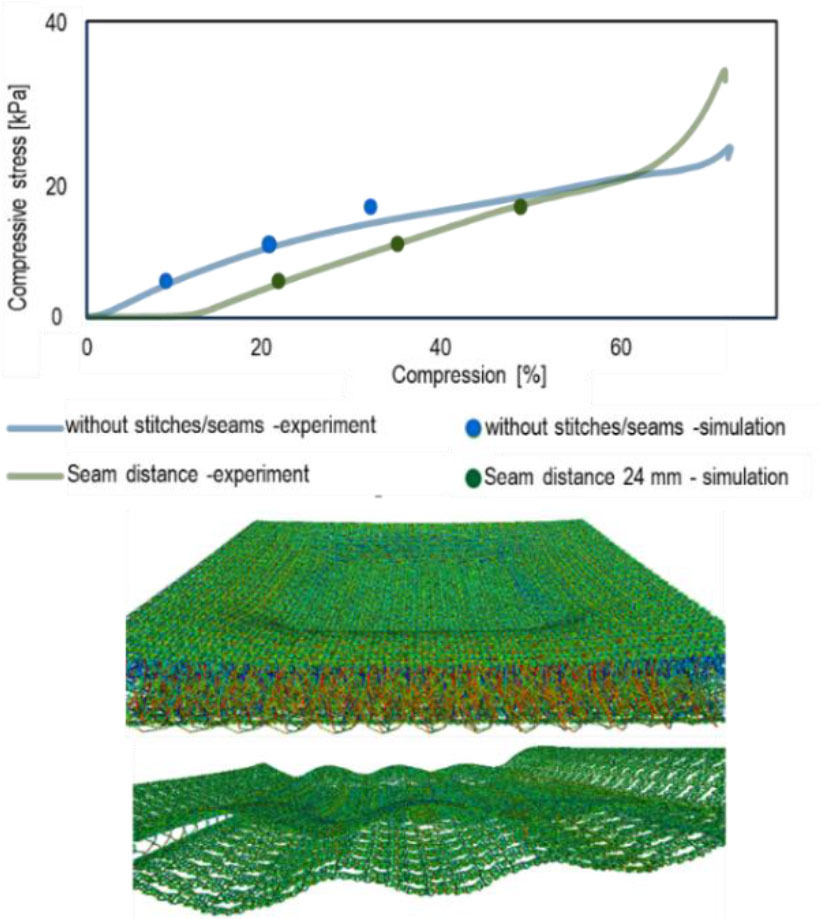
Fig. 11 demonstrates that in case of the seams, the nonlinearity occurs due to the evolutionary contact, involving different and increasing sets of contact points with the plane punch in each evolutionary step.
CONCLUSION AND DISCUSSION
This paper presents an experimental and numerical analysis of the compressive behaviour of spacer fabrics and modified spacer fabrics with seams. Four different specimen have been tested and modelled. Three specimens have been local sectioned by seams. One specimen was a spacer fabric without seams and functioned as a reference. A two-step simulation has been performed. Firstly the spacer fabric structures with seams have been recreated virtually and then the compression test as in the experimental set up has been performed. The shape deformation and compression force – compression distance curve of the experimental and modelling results have been analyzed and compared.
The model limitations are large rotations on the yarn level (starting after 25–30% of the compression for the non- stitched fabric), leading to the non-linear effective compression behavior and changing number of the contact points. Increased number of monofil contacts leads to a “solidification” of the spacer fabric.
We conclude that spacer fabrics with a higher number of seams become stiffer for the compression because of their increasing density. Additionally, many new contacts lead to a stabilization of the fabric for the compression, what leads to almost linear stiffened behaviour at the last part of the curve in the mechanical experiments.
The attained shape of the sectioned areas in the virtual spacer fabrics and the height match with the manufactured samples. Additionally, the virtually performed compression tests show a satisfactory alliance of numerical and experimental compression curves.
Numerical simulations are cheap in the sense of the computation time. Each contact iteration is in the range of seconds. This is possible thanks to one-dimensional models, obtained in advance by an asymptotic dimension reduction for contact problems between continuous fibres or long and thin cylinders. A contact search approach was suggested in this paper and is presented in the Annex.