
INTRODUCTION
Thin-walled composite profiles belong to the group of load-carrying structures which have special features. They present low mass, at maintaining high mechanical resistance. These types of profiles can have an open or closed cross-sectional shape [1–3]. This kind of composite structure under loading is considered in many research groups [4–6]. It is taken at the isotropic features of the material kind. For these cases, approximation methods are employed, while in the case of numerical approaches the solution of a linear eigenproblem is used [7–8]. From a scientific point of view, it is important to evaluate the behaviour of thin-walled structures after stability lossing. Consequently, it is important to analyse the post-buckling behaviour for analysis of damages and changes in load-carrying capacity [9–11]. This can be supported by the acoustic emission method, while in the case of numerical simulations this is covered by damage initiation criteria, such as the Hashin one [12–13]. This enables to capture a force value at the first stage of damage occurrence [14]. Worth noticing, an in-depth analysis of the complex failure mechanism of the composite structure, where both experimental studies and numerical simulations (using, for example, progressive failure analysis) make it possible to assess the reduction load-carrying capacity [15–18]. Approaches for the composite type in the experiment can be reached using: universal testing machine, acoustic emission, optical deformation measurement system, while in the case of numerical simulations the finite element method (using advanced failure models) plays an important role [19–21]. This reflects, a composite type is analysed utilising different experimental and numerical approaches, but this does not cover the influence of the cross-section geometry on its behaviour under compression force.
Therefore, the paper focuses on a composite behaviour in the form of a thin-walled rectangular tube under compressive force at different dimensions of cross-sections.
THE SUBJECT OF STUDY
Additional novelty is the object of research in the form of thin-walled carbon-epoxy composite structures with varying strength and stiffness of the structure - manufactured within the framework of a project from the National Science Centre, Reg. No. 2021/41/B/ST8/00148. Thin-walled columns made of carbon-fiber epoxy composite (CFRP). The selected type of composite was determined on the basis of preliminary numerical simulations and experimental tests. The total number of specimens was equal to 9. Each specimen group collected three pieces at the following dimensions of a cross-section: A - 40x40 mm, B - 50x30 mm and C - 60x20 mm, Fig 1. The composite profiles had some common features/properties, such as: lay-up [0°/90°/0°/90°]s, properties, height of 200 mm, and the same wall-thickness the cross-section shapes’ circuit.
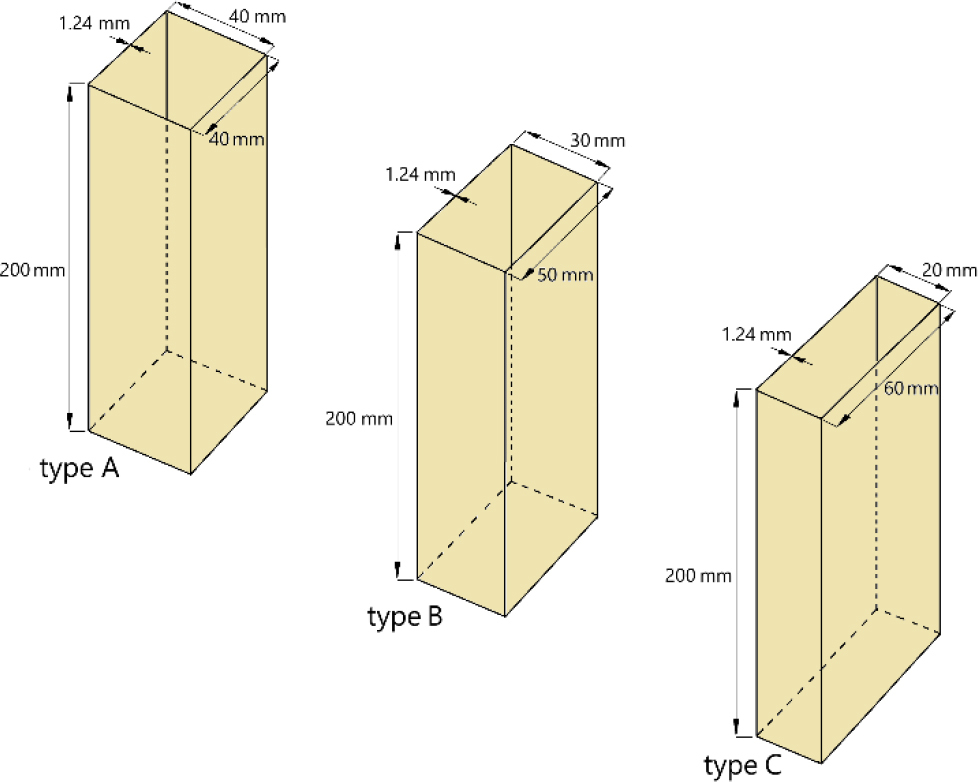
The composite specimens were manufactured using an auto-clave technique, and details of the manufacturing process [22]. With reference to the fundamental features of the cross-sections: the moment of inertia of the A-type square profile equals 58,033.51 mm4, of B-type rectangular profile equal 37,351.34 mm4 (in the first direction) and 78,715.68 mm4 (in the second direction), of C-type rectangular profile equal 19,149.18 mm4 (in the first direction) and 96,917.85 mm4 (in the second direction), while the moment of resistance (strength index) of the A-type profile equals 2,732.27 mm3, of B-type profile equal 2,299,96 mm3 (in the first direction) and 2,999.84 mm3 (in the second direction), of C-type profile equal 1,703.66 mm3 (in the first direction) and 3,102.36 mm3 (in the second direction).
The cross-sectional area for all three types of profiles was the same - 204.55 mm2.
EXPERIMENTAL AND NUMERICAL APPROACHES
The fundamental approach to the composite tubes was presented in [22]. In this tests were carried out at room temperature at constant value of displacement velocity of 2mm/min. The component behaviour was followed at different levels of loading, analysing a load-capacity reduction. At the post-buckling equilibrium paths, the value of the critical force was determined based on the straight intersection method [7] - taking into account the force-displacement curve (shortening of the structure). The non-contact optical digital image correlation system (Aramis 2D) for measuring the deformation in 2D coordinate system was used, Fig. 2 [23] (during the study, only the 2D version of the DIC system was available). The acoustic emission method was employed, within the framework of the use of the AMSY-5 [24] type apparatus and a piezoelectric sensor directly mounted to the test specimen captured results. This made it possible to register acoustic signals (such as energy, amplitude, etc.) in order to identify the damage-initiating force of composite structures. A digital microscope Keyence VHX-970F [25] with a mobile head was also used for damage analysis.
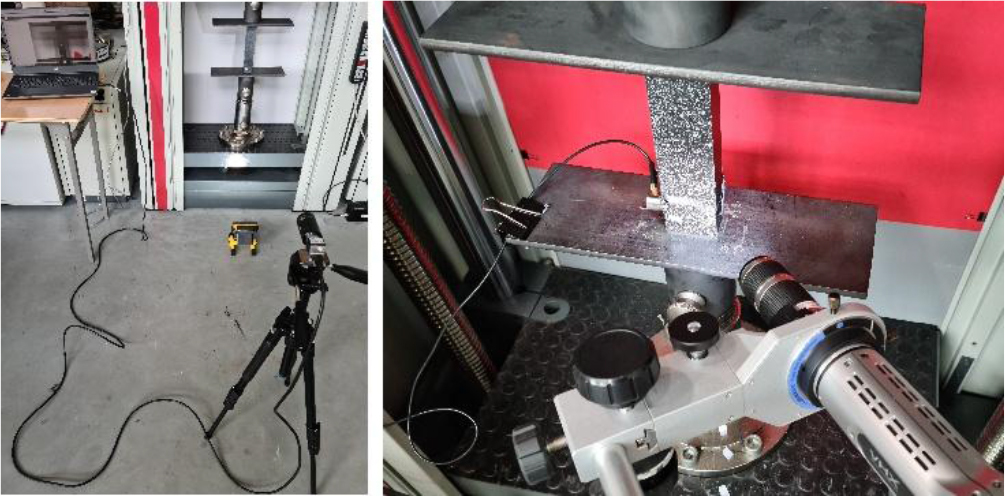
The DIC system included a high resolution camera of 4096 px × 3000 px. This enabled to capture 12Mpx images at frequency 25 Hz. The main objective of the experimental study was to determine the buckling force value, damage-initiation, and force at fracture. Buckling force were determined in accordance with the previously mentioned method of intersecting straight lines – using the post-buckling equilibrium paths [2]. The damage initiation was strongly related to the acoustic emission signal [9,10]. The forces values corresponding to the loss of load-carrying capacity were determined directly from the post-buckling equilibrium paths, as the maximum value [12].
For numerical simulations, the analysis of stability and load-carrying capacity phenomena were carried out using the finite element method in Abaqus. Consequently, the loss of stability was determined using a linear solution of the eigenproblem, while the fracture phenomenon was captured using a nonlinear analysis at a progressive fracture analysis model.
The solution of the linear eigenvalue problem was closely related to the equation [26]:
where: K0NM is the matrix stiffness (which includes the effects of the preloads PN), KΔNM refers the differential initial stress (and load stiffness matrix due to the incremental loading pattern QN), λi constitutes the eigenvalues, ViM is the buckling mode shapes (eigenvectors), M and N are degrees of freedom M and N (of the whole model), i refers to the ith buckling mode. Furthermore, the buckling forces represent then PN + λiQN.
It was possible to determine the value of the buckling force and the buckling form corresponding to this force - which was consequently implemented in a nonlinear analysis using the Newton-Raphson method [16]. Simulations of nonlinear stability were carried out considering the lowest numerically obtained form of buckling (corresponding to experimental tests), taking into account geometric imperfections with an amplitude of 0.05 of the wall thickness of the composite structure. Simulations considering the phenomenon of damage initiation and further damage evolution were carried out by using progressive fracture analysis [27] - where damage initiation represented by the Hashin criterion [28,29], and damage evolution expressed by the energy criterion. The damage initiation criterion enabled to determine a stress type (tensile or compressive) in the degradation of the composite components:
where: XT,XC,YT,YC,SL,ST denotes the coefficients of the longitudinal tensile/compressive, transverse tensile/compressive, longitudinal/transverse shear strength; α represents the contribution of the shear stress;
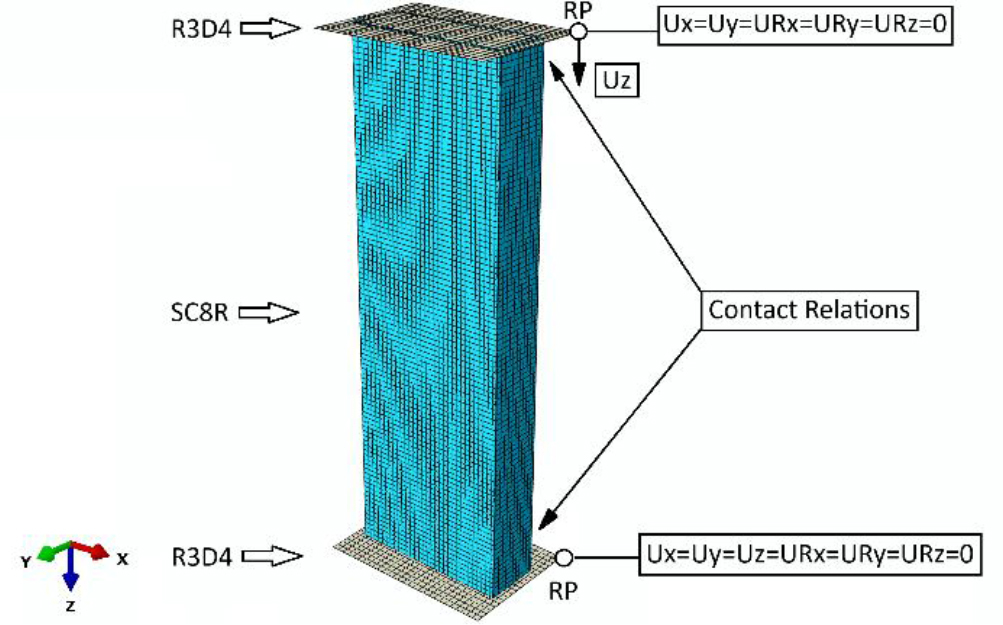
After the fulfillment of any one component of damage initiation, a phenomenon known as damage evolution begins during further loading of the structure. The damage evolution law is based on the fact that fracture energy is released during damage. It is necessary to determine the parameters responsible for the damage energy parameters (energy dissipation parameters due to the tension and compression of the fibers, as well as the tension and compression of the matrix) [27]. The numerical model was elaborated using Continuum Shell - SC8R (composite structure) and Shell - R3D4 (non-deformable plates that provide supports) finite elements. The continuum shell model takes into account the physical thickness of the composite material. This provides the ability to virtually design the number of plies relative to the physical thickness, taking into account the relative thickness of the ply. The Continuum Shell composite modeling technique reflects the physical wall thickness of the composite structure and simultaneously enables analysis of the structure's behavior - ply by ply. For the numerical model, the boundary conditions were reflected as accurately as possible. Between the non-deformable plate elements (where boundary conditions were defined) and the composite structure, contact interactions were defined in the normal and tangential directions (with a defined friction coefficient of 0.2). The material properties were consistent with the parameters determined experimentally and presented in previously-mentioned publication [22]. In the framework of numerical studies, the effect of mesh density on the accuracy of calculation results was analyzed [3] - on the basis of which it was estimated that the mesh that allows the most accurate representation of experimental results in the case of a composite structure was selected at the level of the previously mentioned size - 2mm. Regardless of the shape of the cross section (where the sum of the lengths of the edges creating the cross sections was constant), each numerical model had 10320 finite elements and 19802 computational nodes. The discrete model with boundary conditions is shown in Figure 3. The compression was realized by moving the upper plate.
RESULTS
In the case of both experimental and FEM approaches the values of buckling forces and the corresponding buckling forms were determined at their eariler stage. In the case of experimental studies, the values of buckling forces were determined using the previously mentioned method of intersecting straight lines. The non-linear section of the force-shortening relationship was related to a specimen's response to the applied force.
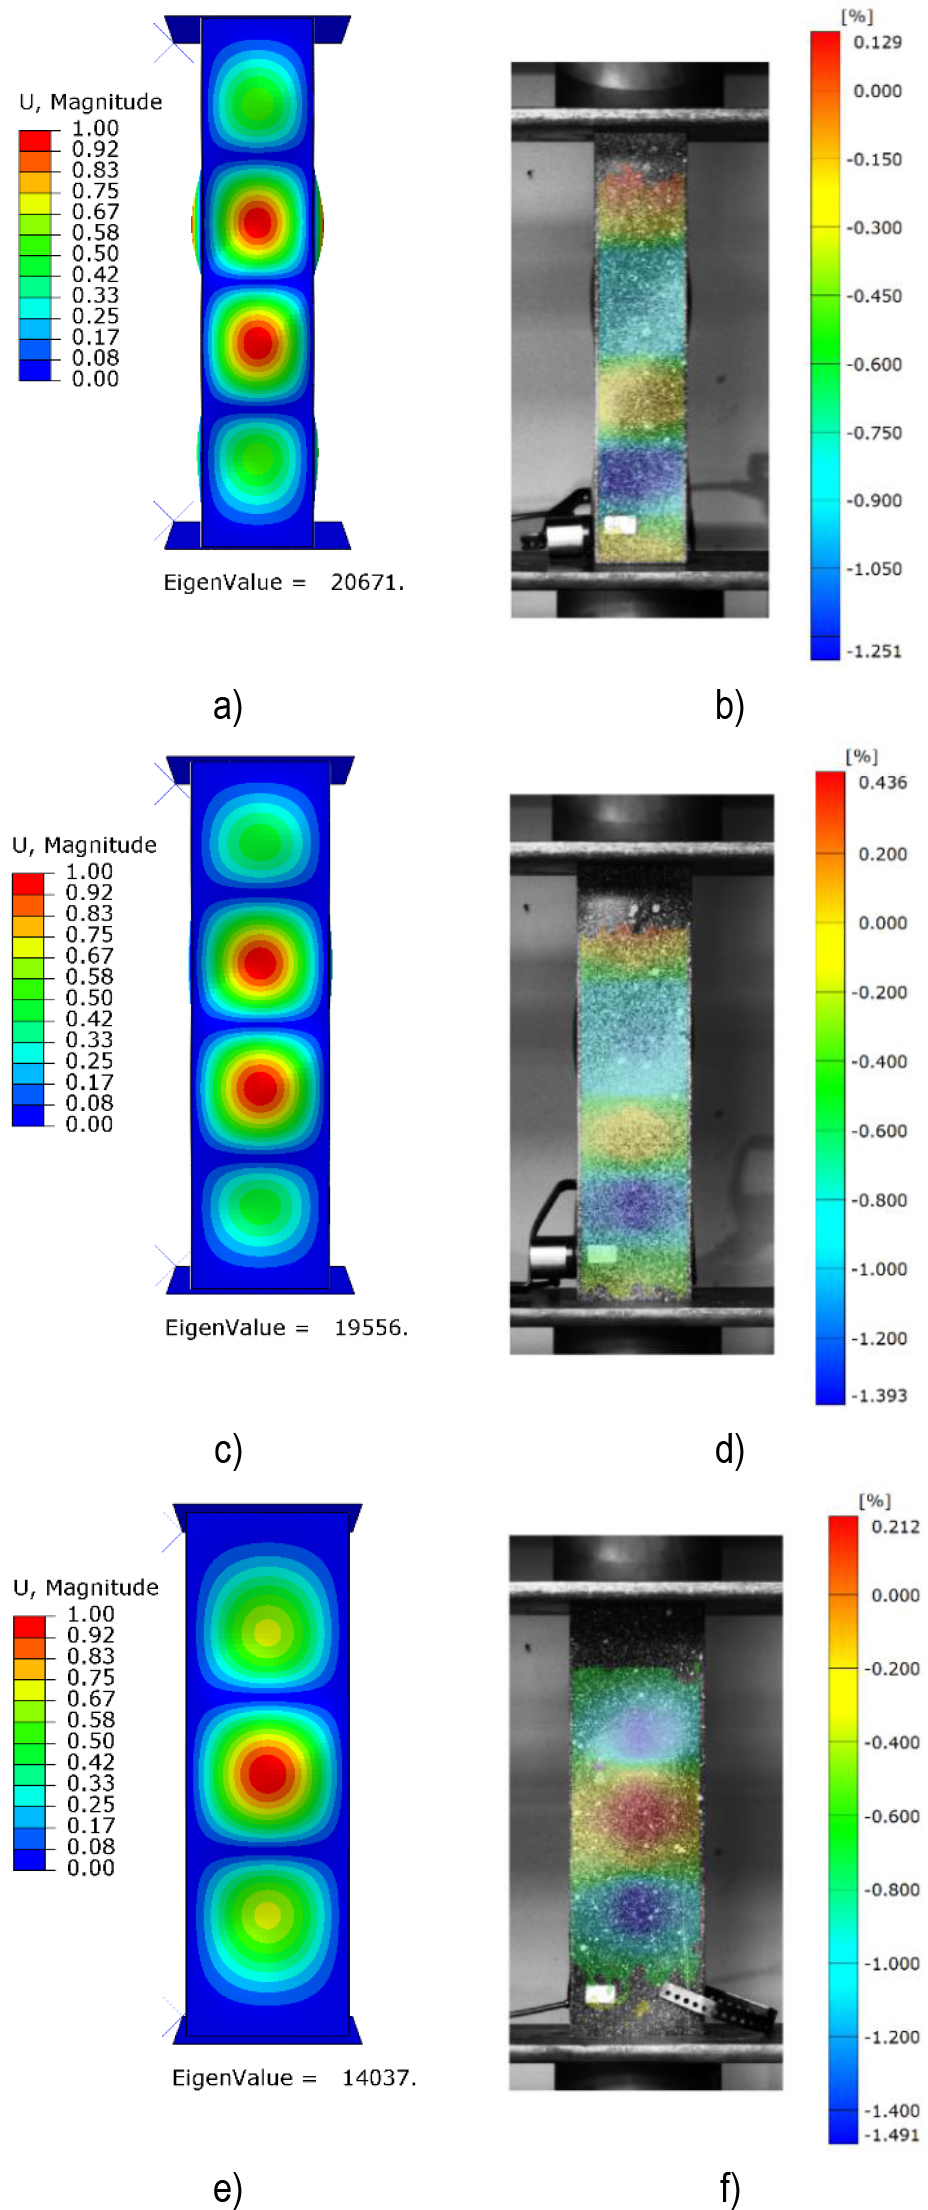
Figure 4 presents only one determined buckling force value from each type of cross section. For the other specimens, the buckling force values were determined analogously (as presented in Table 1). The approximation ranges, representing lines of black color, were selected so as to make the correlation coefficient as high as possible [8]. In the case of numerical simulations, the buckling force values were determined by solving a linear eigenproblem (determined the buckling force value). Figure 5 presents a qualitative comparison of the forms of loss of stability, as well as shows the numerically obtained values of buckling forces. The results shown in Figure 5, recorded using the ARAMIS 2D system, show the relative deformation in the longitudinal direction, while FEM showed deformation in the framework of a linear eigenproblem. The results were compared only in terms of qualitative aspects, showing the same type of buckling.
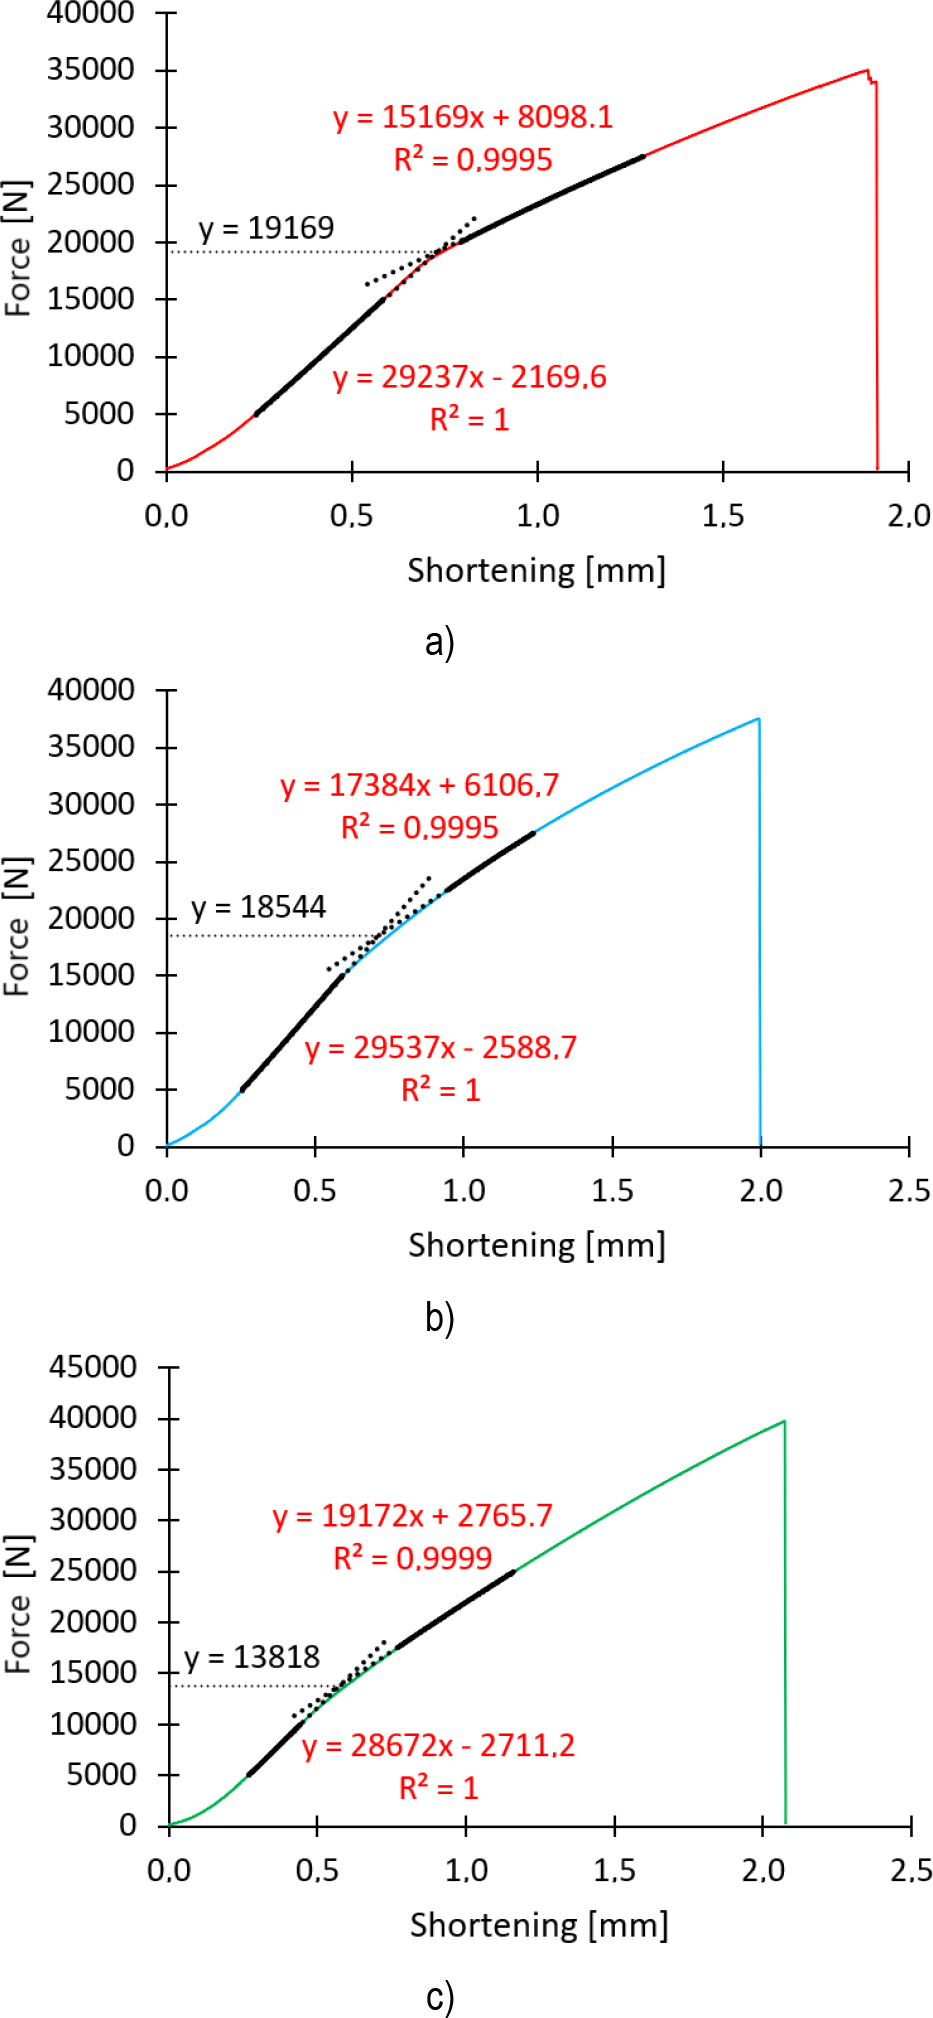
Fig. 5.
Buckling modes: a) specimen A (FEM), b) specimen A (EXP), c) specimen B (FEM), d) specimen B (EXP), e) specimen C (FEM), c) specimen C (EXP)
Tab. 1.
Buckling force values
| 1 (EXP) | 2 (EXP) | 3 (EXP) | EXPavg | EXPSD | FEM | FEM/EXPavg | |
|---|---|---|---|---|---|---|---|
| A | 19,169 N | 18,512 N | 19,002 N | 18,894 N | 279 N | 20,671 N | 1.09 |
| B | 18,544 N | 18,892 N | 18,771 N | 18,736 N | 144 N | 19,556 N | 1.04 |
| C | 13,818 N | 13,352 N | 13,284 N | 13,485 N | 237 N | 14,037 N | 1.04 |
Based on the buckling state analysis, very similar behaviour of composite structures was observed in terms of qualitative evaluation. In the case of type A and B structures, 4 half-waves were observed in the longitudinal direction of the composite columns, while in the case of type C structures, 3 half-waves occurred. The same situation was observed in the case of experimental tests and numerical simulations. Based on the conducted buckling state studies, the buckling force values for experimental tests and numerical simulations are summarized in Table 1.
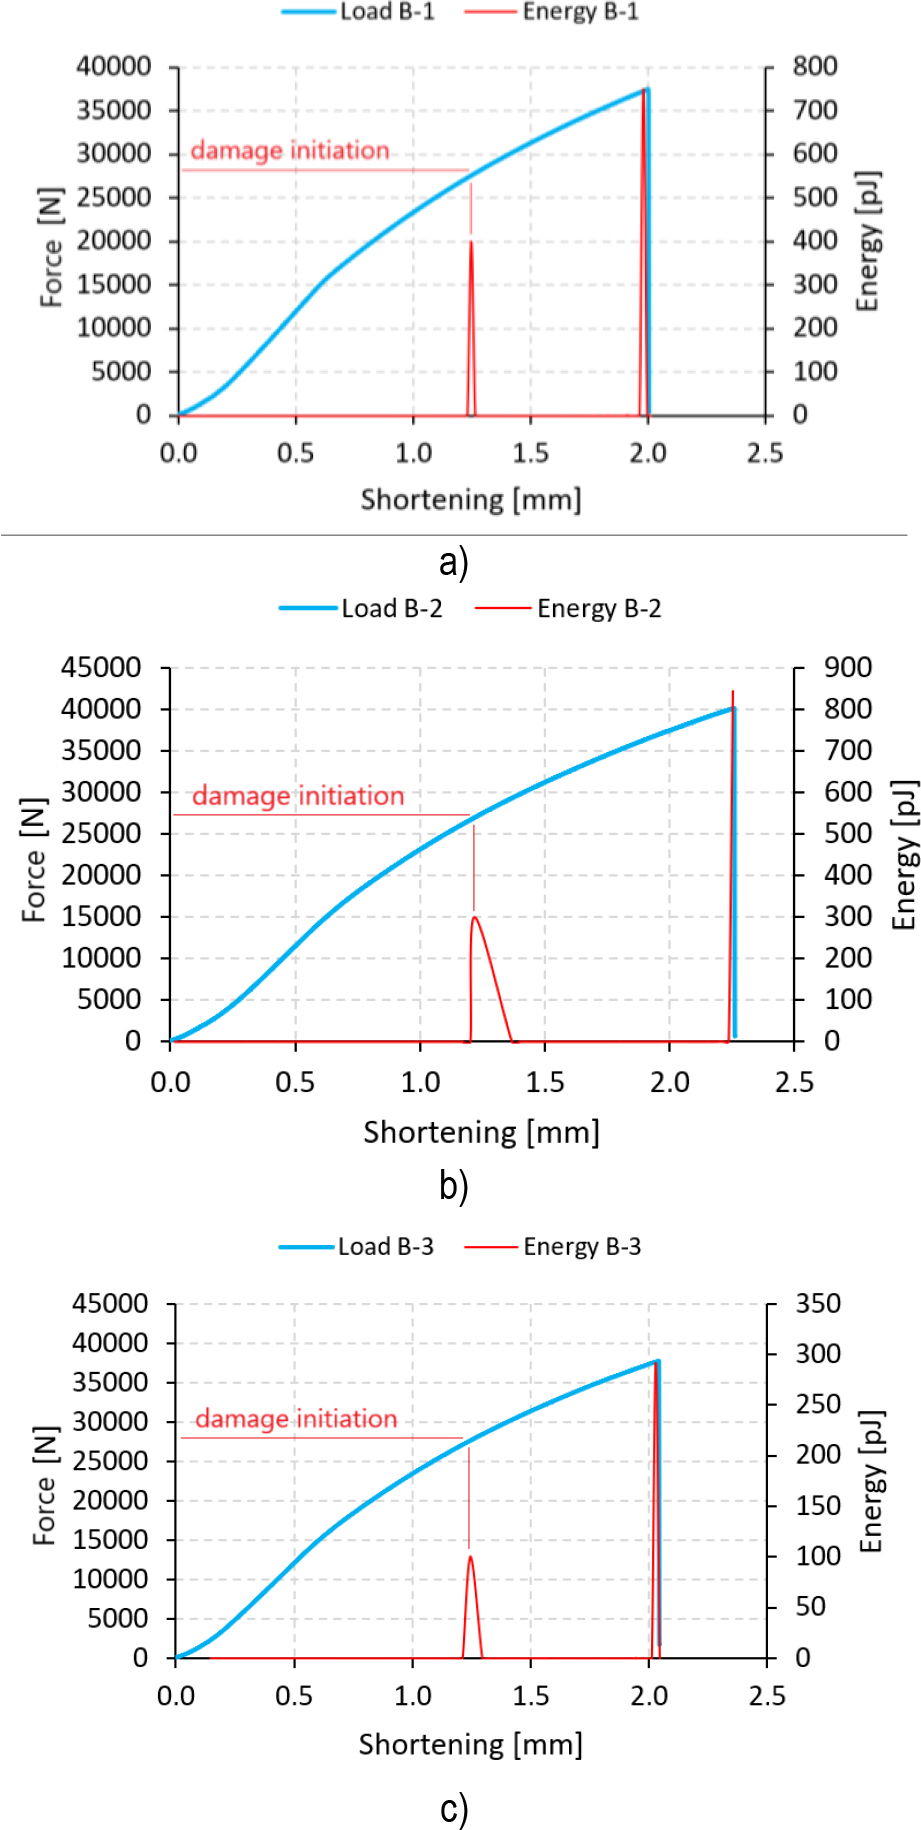
Based on the study, it was observed that the buckling force values obtained in experiment and simulation were very similar. It was estimated that in the case of A-type structures, the buckling force value for FEM simulations relative to the average value from experimental tests was 1.09 times higher, and in the case of B- and C-type columns only 1.04 times higher. In addition, it was noted that the shape of the cross-section, has a significant impact on the loss of stability of the structure, where the ratio of buckling force in the case of A-type relative to C-type structures was 1.4 (experimental tests) and 1.47 (FEM simulations). For the analysis of the damage initiation phenomenon, acoustic emission signals were used to determine the value of the force at which the structure initiates the damage phenomenon. Figure 6 presents an example of post-buckling equilibrium paths for the B-type profile - where the energy signal (within the acoustic emission) was additionally compiled. This made it possible to determine the approximate values of damage-initiating forces, where the first significant "peak" of the acoustic emission signal determined the value of the force at which the structural damage process began. A significant increase in the acoustic emission signal indicated damage to the structure.
Fig. 6.
Force versus shortening at the damage initiation stage: a) specimen B-1, b) specimen B-2, c) specimen B-3
Simultaneously with the experimental studies, numerical simulations were carried out using Hashin's criterion. This criterion was selected for the different parameters of damage initiation and evolution of composite material damage. It was possible to independently assess damage to the fibers and matrix of the composite material. It was proved that the damage initiation in the composite occurred in the matrix due to tension (the HSNMTCRT parameter was fulfilled first). This followed the forms of buckling obtained by linear structural stability analysis. The damage regions covered the zones for the loss of structural stability, Fig. 7.

Table 2 summarizes the force values corresponding to the damage initiation phenomenon for experimental tests and FEM simulations.
Tab. 2.
Damage initiation force values
| 1 (EXP) | 2 (EXP) | 3 (EXP) | EXPavg | EXPSD | FEM | FEM/EXPavg | |
|---|---|---|---|---|---|---|---|
| A | 20,234 N | 23,557 N | 21,042 N | 21,611 N | 1,415 N | 24,694 N | 1.14 |
| B | 27,537 N | 26,916 N | 27,615 N | 27,356 N | 312 N | 28,679 N | 1.05 |
| C | 31,081 N | 30,128 N | 30,304 N | 30,504 N | 414 N | 31,074 N | 1.02 |
It was estimated that in the case of A-type structures, the damage initiation force value for FEM simulations relative to the average value from experimental tests was 1.14 times higher, while in the case of B- and C-type columns only 1.05 and 1.02 times higher, respectively. Similar to the results of the buckling state, it was noted that the varied cross-sectional shape of the composite columns (cross-section A - 40x40 mm, B - 50x30 mm and C - 60x20 mm), has a significant impact on the damage initiation of the structure. In the case of C-type relative to A-type structures, the force value for the damage initiation was 1.41 (experimental tests) and 1.26 (FEM simulations).
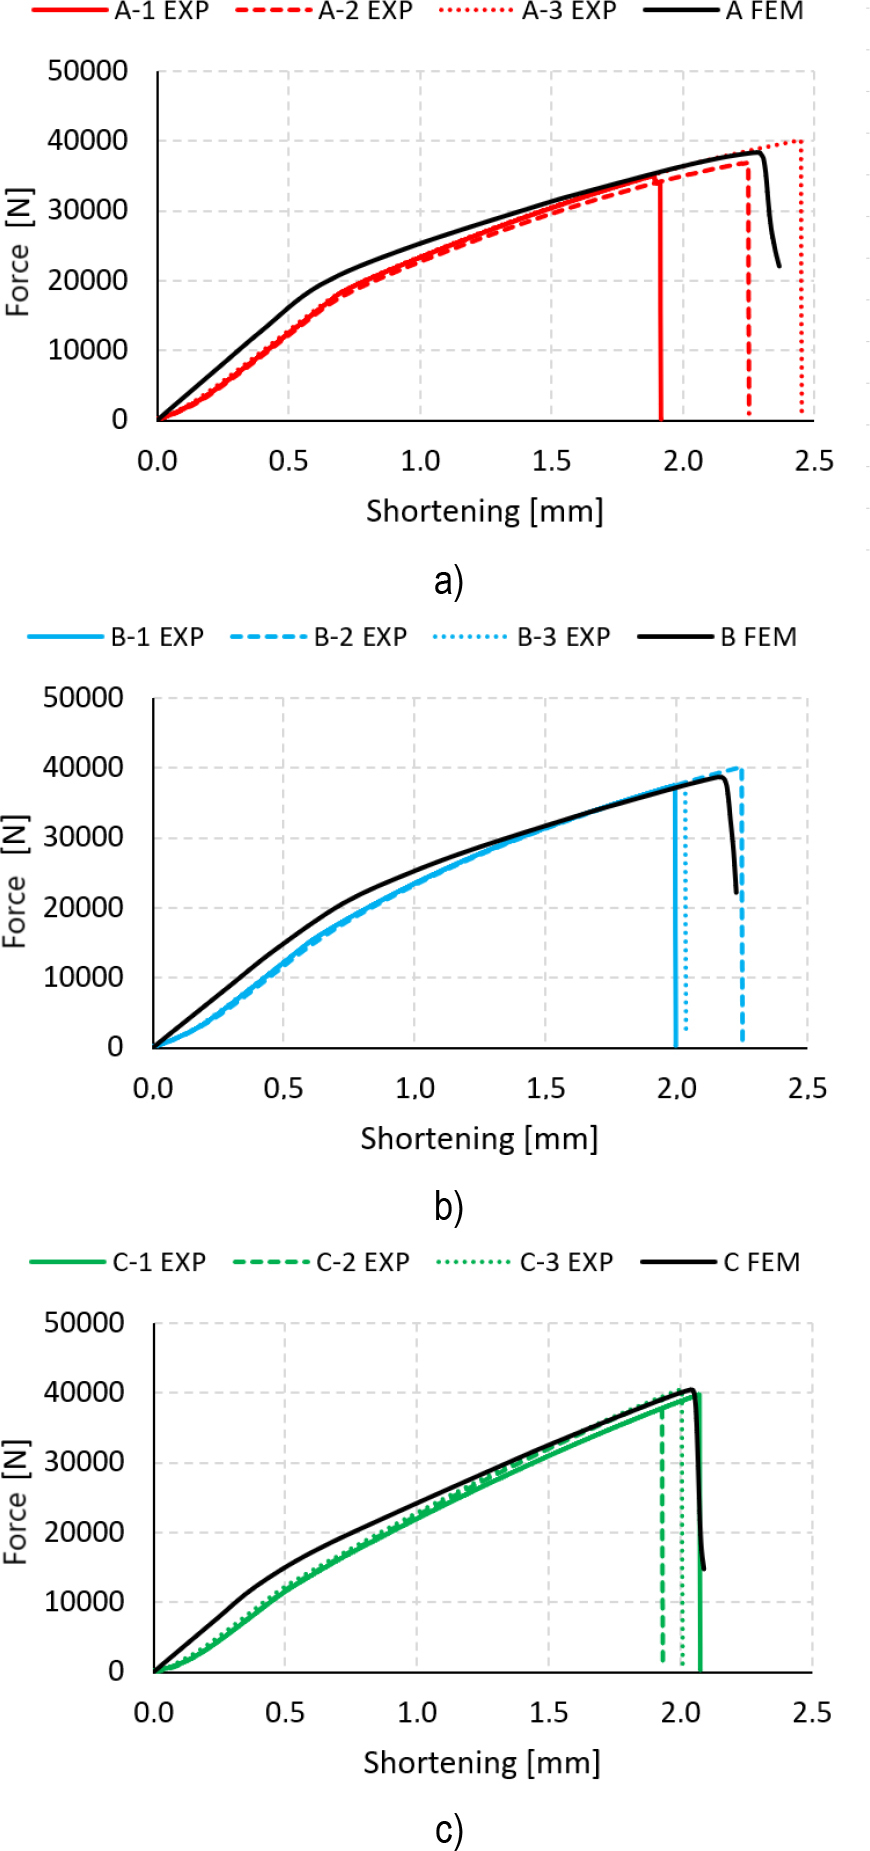
The final stage was represented by the comparison of force-shortening relationships from experiment and simulation, Fig. 8. The characteristics of the FEM demonstrated higher mechanical resistance at the initial loading, due to the FEM model does not follow the differences in the composite features, related to the manufacturing.
Post-buckling equilibrium paths made it possible to determine the values of fracture forces (maximum force values registered during the test trials). These values are summarized in Table 3.
Tab. 3.
Fracture force values
| 1 (EXP) | 2 (EXP) | 3 (EXP) | EXPavg | EXPSD | FEM | FEM/EXPavg | |
|---|---|---|---|---|---|---|---|
| A | 35,047 N | 36,904 N | 40,121 N | 37,357 N | 2,096 N | 38,358 N | 1.03 |
| B | 37,513 N | 40,139 N | 37,722 N | 38,458 N | 1,192 N | 38,703 N | 1.01 |
| C | 39,800 N | 39,151 N | 40,573 N | 39,841 N | 581 N | 40,463 N | 1.02 |
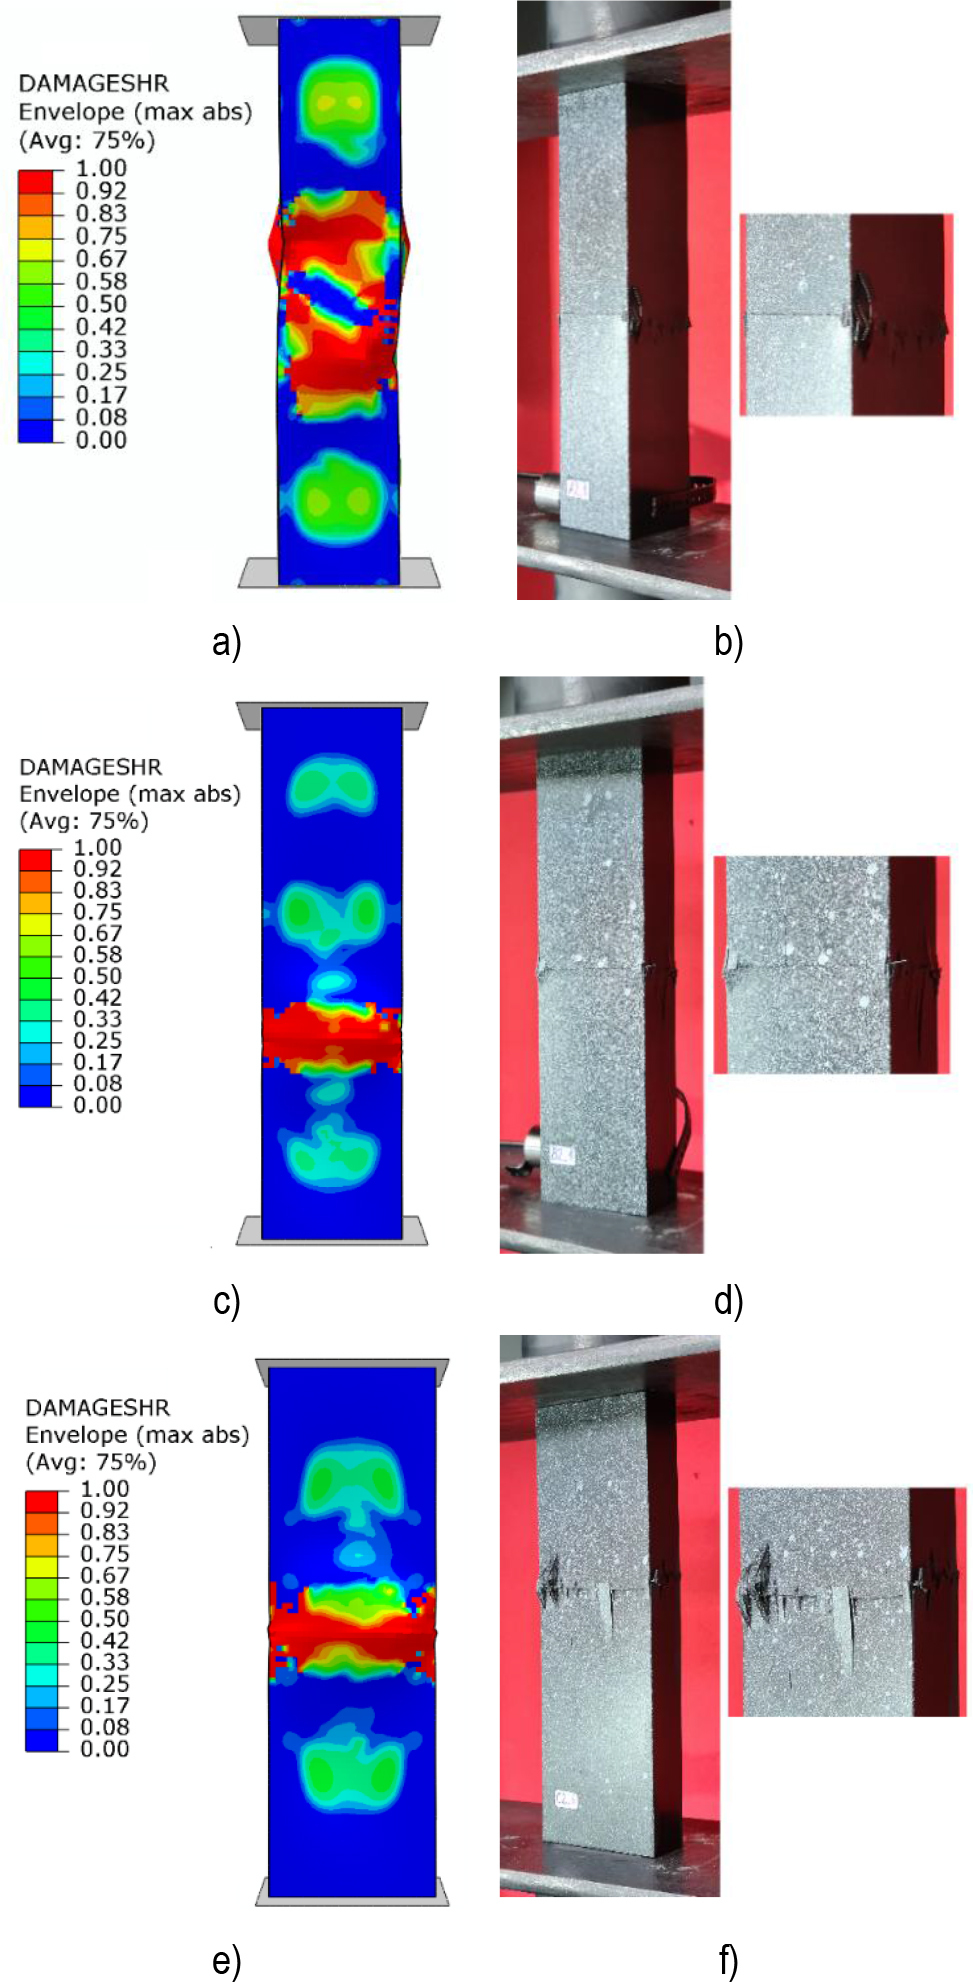
Based on the study, it was noted that the fracture force values from the both approaches were almost the same. It was estimated that in the case of A-type structures, the fracture force value for FEM simulations relative to the average value from experimental tests was 1.03 times higher, while in the case of B- and C-type columns only 1.01 and 1.02 times higher, respectively. Moreover, it was observed that the cross-section features, has a small influence on the component fracturing, while in the case of C-type relative to A-type structures it was equal to 1.07 (experimental tests) and 1.05 (FEM simulations). Based on the analysis of the results from the quantitative point of view, it was noted that there was a low effect of the cross-sectional shape of thin-walled composite columns on the values of fracture forces and load-carrying capacity. Furthermore, a qualitative comparison of the fracture phenomenon was performed - Figure 9.
Fig. 9.
Fracture modes: a) A specimen (FEM), b) A specimen (EXP), c) B specimen (FEM), d) B specimen (EXP), e) C specimen (FEM), c) C specimen (EXP)
In order to understand more detail the complex phenomenon of composite material fracture [30–34], the fracture of individual plies of the composite material was presented on the basis of numerical simulations carried out for each type of cross-section of the composite structure - Figure 10. Ply 1 was the ply located on the outside of the composite structure, while ply 8 was the inside (last) ply of the structure.
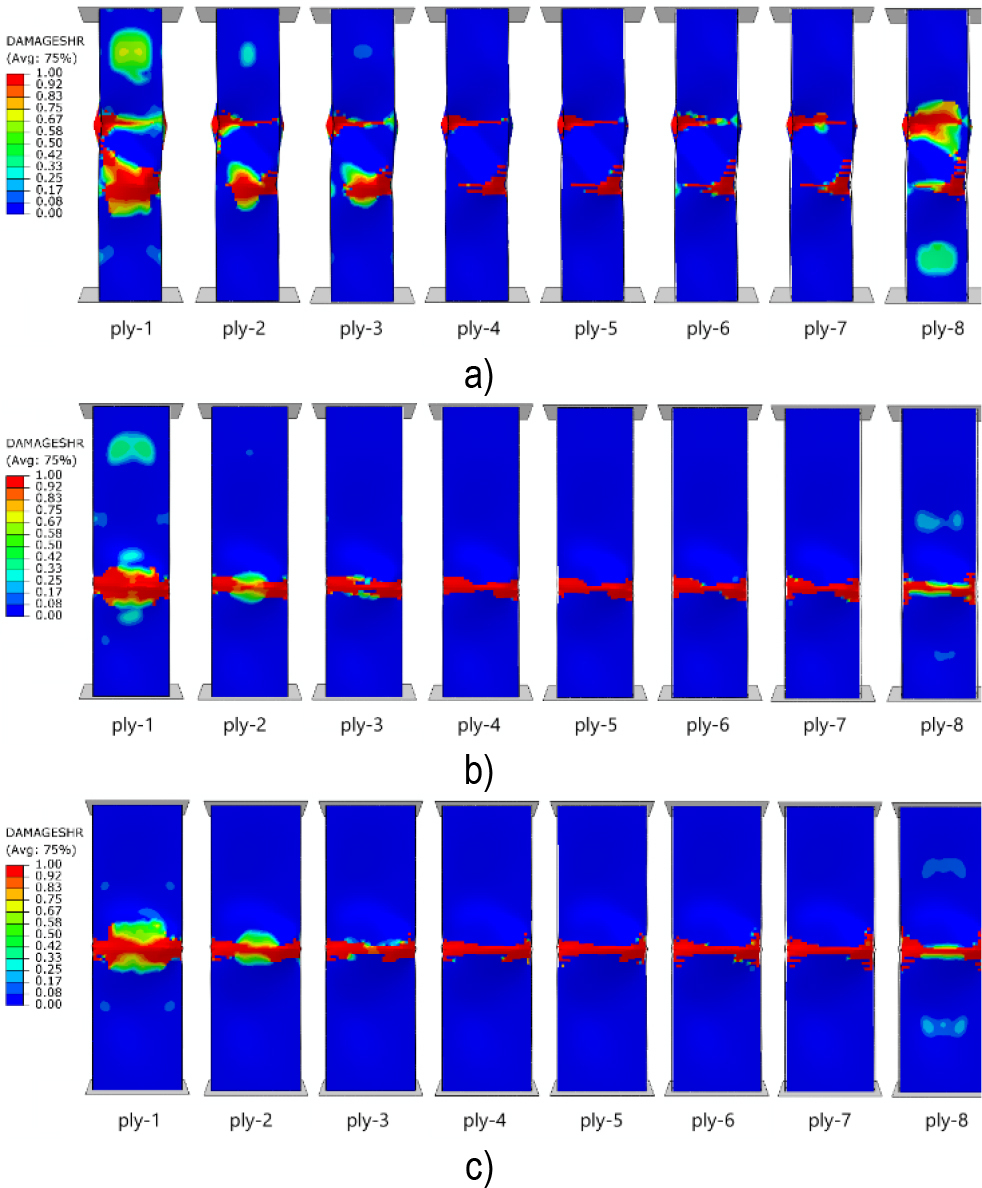
Based on the study, it was noted that the analysed structures with cross sections, regardless of the shape of the cross section, were characterised by a high reserve of load-carrying capacity - between the buckling and failure force. The failure phenomenon showed a complex character - where different forms of damage such as ply cracking and delamination occurred simultaneously. In the case of numerical simulations, it was observed that the failure phenomenon was significantly visible in the case of the outermost (extreme) plies of the composite material (such as, for example, plies 1 and 8) and noticeably less visible in the “middle” plies - which constitute the core of the structure. The outermost plies of the composite were the most susceptible to failure - which was confirmed by experimental studies, where complex forms of failure were visualized - in the area of the middle of the height of all structures. Both quantitatively and qualitatively, a satisfactory agreement was obtained between the results of experimental studies and FEM simulations. An interesting conclusion during the observation of the fracture phenomenon was primarily that the composite showed dominant forms of fracture in the area located around the mid-height of the structure. The above establishes the necessity of further research in the analysis of the fracture phenomenon using advanced FEM numerical models.
Additionally, it was decided to present the complex state of failure using an example of A-type structure – using a digital microscope (Figure 11 and Figure 12). The analysis carried out using digital microscopy and recorded forms of damage was conducted to enable a qualitative assessment of the composite material damage. In each case, regardless of the test specimens, delamination and fracture of individual plies of this material were observed, which will be the subject of further and more detailed research.

Fig. 12.
The fracture phenomenon of A-type composite profile - detailed view of the failure form at orientation of the digital microscope head
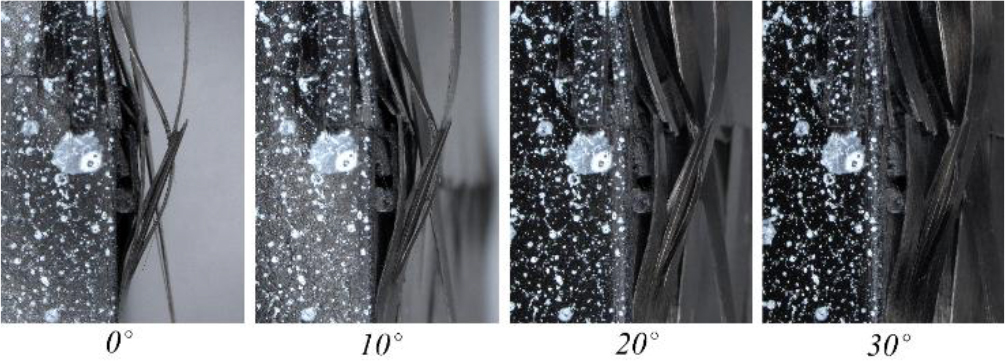
Observations with the use of a digital microscope (at 20x magnification) made it possible to present in details of regions, indicating on the degradation complexity.
CONCLUSIONS
The present study was primarily conducted in order to determine the significance of the effect of the cross-sectional shape of composite structures on stability, damage initiation and failure phenomena - under axial compression. The research made it possible to extract important conclusions from the analysis of the buckling and post-buckling behavior of thin-walled structures with different cross-sectional shapes:
– The dimensions of the rectangular tube cross-section has a significant effect on buckling and damage initiation forces, while a minor effect on the load-carrying capacity of the structure;
– The failure/fracture phenomenon demonstrated a complex character, where, in the case of experimental studies, both fracture of the plies of the composite material and delamination were observed;
– The outer plies of the composite are most susceptible to damage occurrence;
– The composite profiles were characterised by a high reserve of load-capacity - between the buckling force and the fracture force there was a difference in values of two or more times.
Further research directions will take into account the development of advanced numerical models using FEM, such as the XFEM technique - for modeling the fracture of plies of composite material, or CZM for modeling the delamination phenomenon, in order to better represent the nature of the complex mechanism of failure. The findings of the study can be applied more comprehensively, e.g. in the aerospace and construction industries, where the force values obtained at buckling, damage initiation, and failure provide information about the load-carrying capacity of the analyzed structures. Knowledge of the load-carrying capacity of the investigated composite profiles when used as reinforcing/load-carrying structures is significant. In the future, it is also planned to use a passive thermography system, which would additionally enable the analysis of damage in the context of temperature increase observations at the moment of composite material structure degradation. It is important to model composite structures depending on their destination for industrial solutions – the most important issue is usually that these structures, after buckling, should have several times the load-carrying capacity before complete fracture.