INTRODUCTION
The digitalisation of 3D objects is the process of transforming real, three-dimensional physical objects into their digital representations in the form of three-dimensional (3D) models, containing data on shape, dimensions and often also surface texture and colour [1] [2]. In general, digitalisation techniques are divided into contact and non-contact methods [3]. Contact-based 3D digitalisation methods rely on the physical interaction of a measuring probe with the surface of an object to capture its geometry [4]. Unlike non-contact methods, these techniques require direct, point-by-point contact, which often provides high accuracy but at the cost of time and the inability to work with delicate objects. The most commonly used contact-based digitalisation methods involve coordinate measuring machines and measuring arms [5]. Non-contact digitalisation methods, on the other hand, are used to acquire digital data about the shape, texture, or structure of a physical object without any physical contact [6][7][8]. They are widely applied in fields such as museology, reverse engineering, archaeology, medicine, and industry [9][10][11]. There are various techniques for acquiring information about the geometry of a digitalised object. The most commonly used non-contact methods include 3D laser scanning, structured light scanning, photogrammetry, and computed tomography (CT) [12][13][14].
The digitalisation of low-height 3D objects (e.g. coins, reliefs, seals, PCBs, prints, or small archaeological artefacts) requires the selection of appropriate methods and equipment, as standard 3D techniques—such as photogrammetry or laser scanning—may have limitations when dealing with very flat forms [15][16]. Low-profile 3D objects, due to their delicate textures (e.g. reliefs, micro-surfaces), demand high measurement precision and high resolution. A distinct group includes objects with minimal height variations that extend over a relatively large surface area, such as canvases or painting paths. In such cases, the use of microscopic techniques (e.g. optical microscopes or micro-scanners) proves inefficient. The objects are too large for the measurement equipment, and the digitalisation process would be too time-consuming. Professional structured light scanners are a suitable solution in these situations [17]. Today, white and blue light scanners are commonly used. For the objects discussed in this paper, the use of blue light scanners is recommended [18]. These scanners offer greater resistance to ambient light (compared to white light), produce better results on challenging surfaces (e.g. dark, shiny, or metallic), and exhibit reduced optical scattering, resulting in higher scanning precision.
The research task described in this study was to develop a relatively fast and accurate method for preparing a numerical model of an object with small relative height differences. The topography of the canvas and the paths created by brush or spatula strokes— illuminated by directional light—give paintings a three-dimensional effect and influence the perception of the colour of transparent pigment applied to a textured surface. The technique of applying paint—typically oil paint—in thick layers that emphasise brush or spatula marks is known as impasto. Historically, the impasto technique evolved as a means of transforming the perception of art, gaining popularity with the Impressionists. It offered new opportunities for artistic expression, allowing artists to convey emotion and energy through texture. Pioneers of this technique included Vincent van Gogh and Claude Monet. Van Gogh's work Starry Night Over the Rhone exemplifies the impasto technique, where thick layers of paint bring the night sky to life. Such three-dimensional effects can be simulated in two-dimensional representations, most often through the use of chiaroscuro to imitate the structure and relief of brushstrokes [19][20]. Another important factor is the rheological properties of the oil paints used. For example, Van Gogh used two types of white in his paintings [21]. The authors of this study examined his works, identifying the characteristics of the paints he used and exploring how these materials contributed to the three-dimensionality of the painted surface.
In the development of a painting application intended to reproduce the Renaissance technique of glazed painting, the primary focus was on replicating the optical mixing of colours achieved through the use of natural pigments. However, the application of a glaze over a rough ground or an impasto base enables the creation of visually intriguing colour effects. To accurately transfer these effects into the digital realm, it was essential to study the topography of the canvas and the traces left by the paintbrush on such textured surfaces. Equally important was understanding the interaction between successive layers of brushstrokes applied on top of one another.
DIGITALISATION OF CANVAS AND PAINTING PATHS
. Research Material
The research material - canvases featuring painting paths created with various painting tools - was prepared by a professional artist with extensive experience in glaze painting.
The test samples were created based on the following assumptions:
preparation of canvas ground fragments,
application of brushstrokes using four types of brushes on linen canvas,
execution of paint strokes at four dilution levels (with maximum dilution defined as a 1:20 volume ratio of commercial paint to medium, and minimum dilution as 1:1),
use of four different paint application techniques:
– slowly in a straight line,
– slowly along a curve,
– quickly in a straight line,
– quickly along a curve.
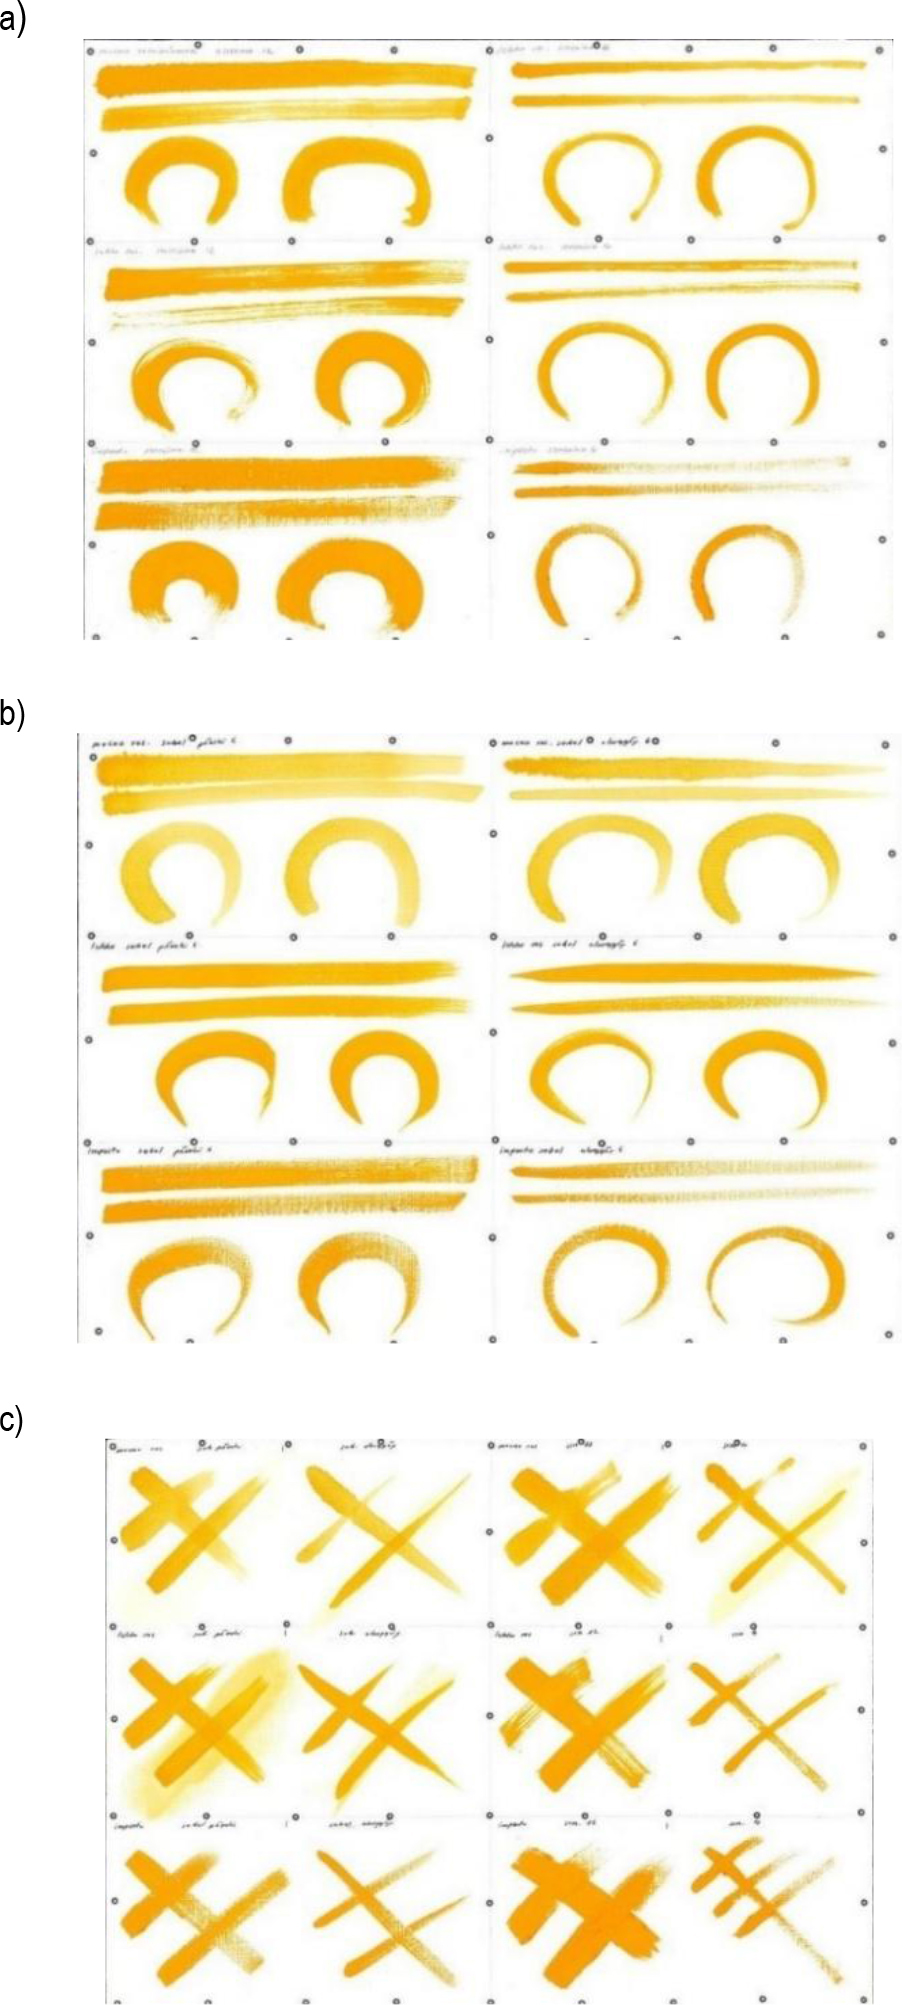
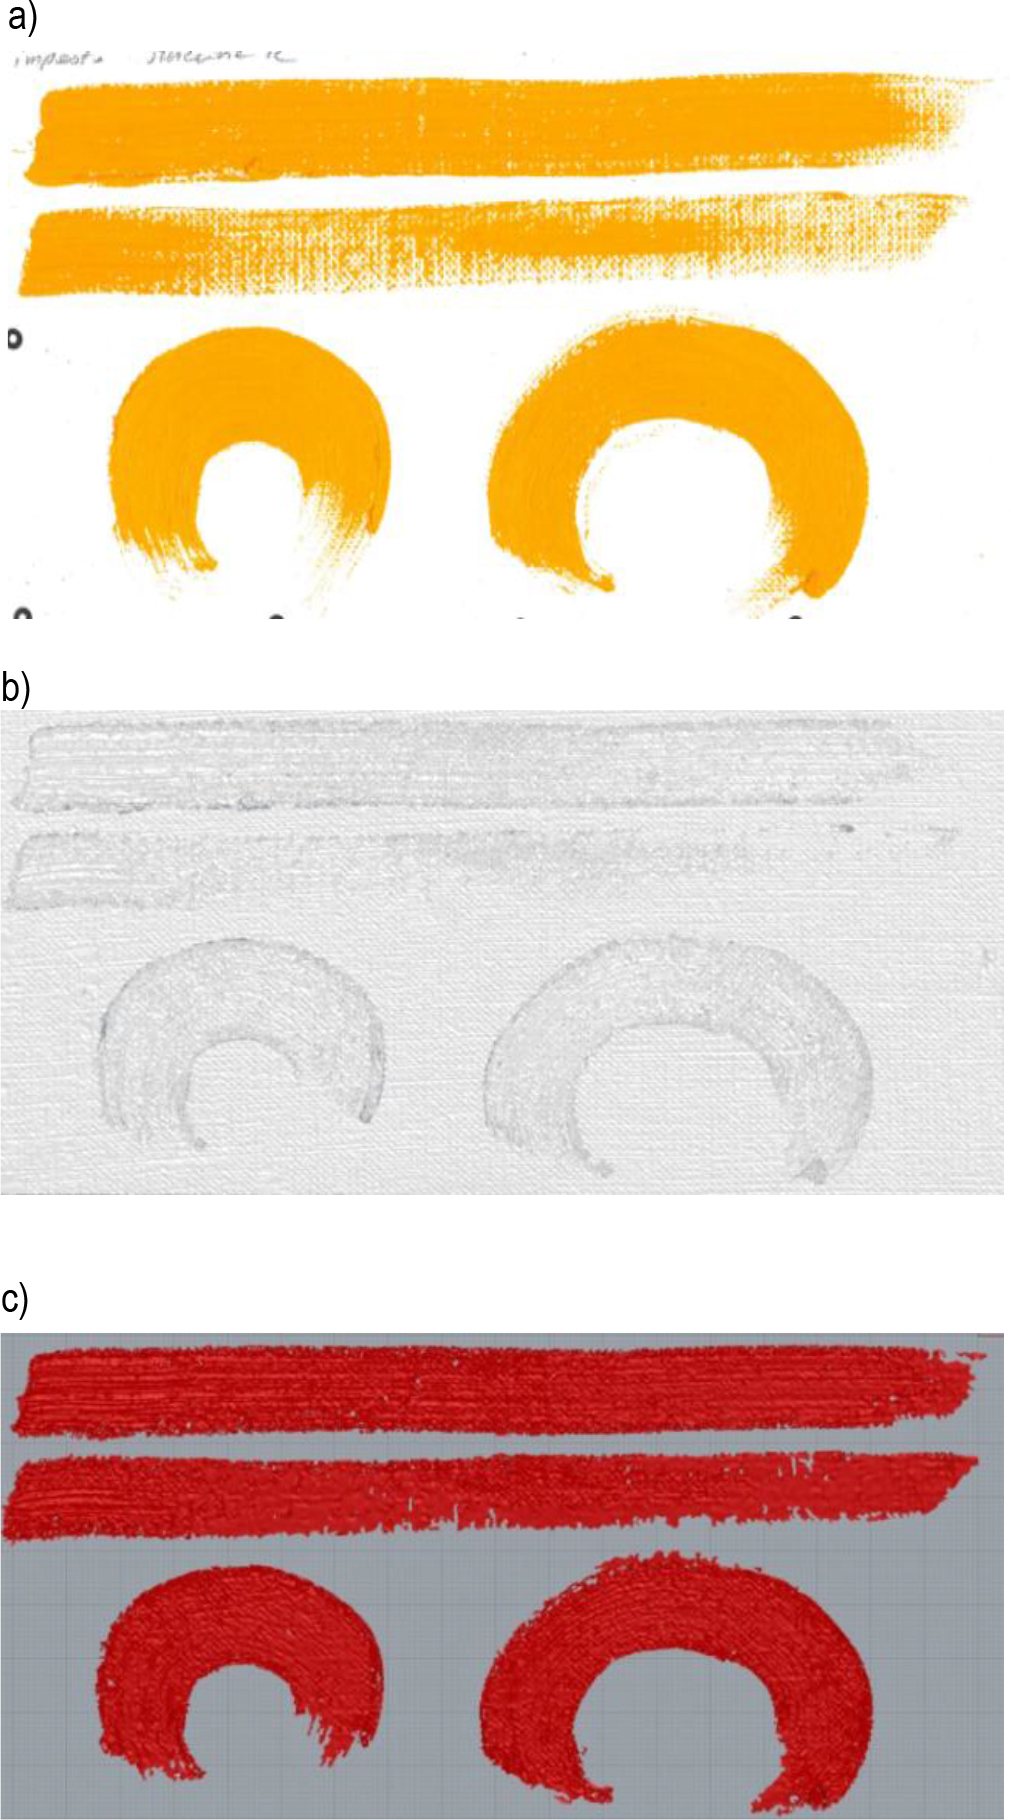
Figure 1 presents selected samples prepared on the canvas ground. Figures 1a and 1b show single (straight and curved) brush paths applied at two different speeds. Figure 1c presents a sample containing intersecting, straight paint paths.
. Measurement Platform
The digitalisation of the canvases and painting paths was carried out using an ATOS Core 200 scanner—a 3D scanner based on blue light technology.
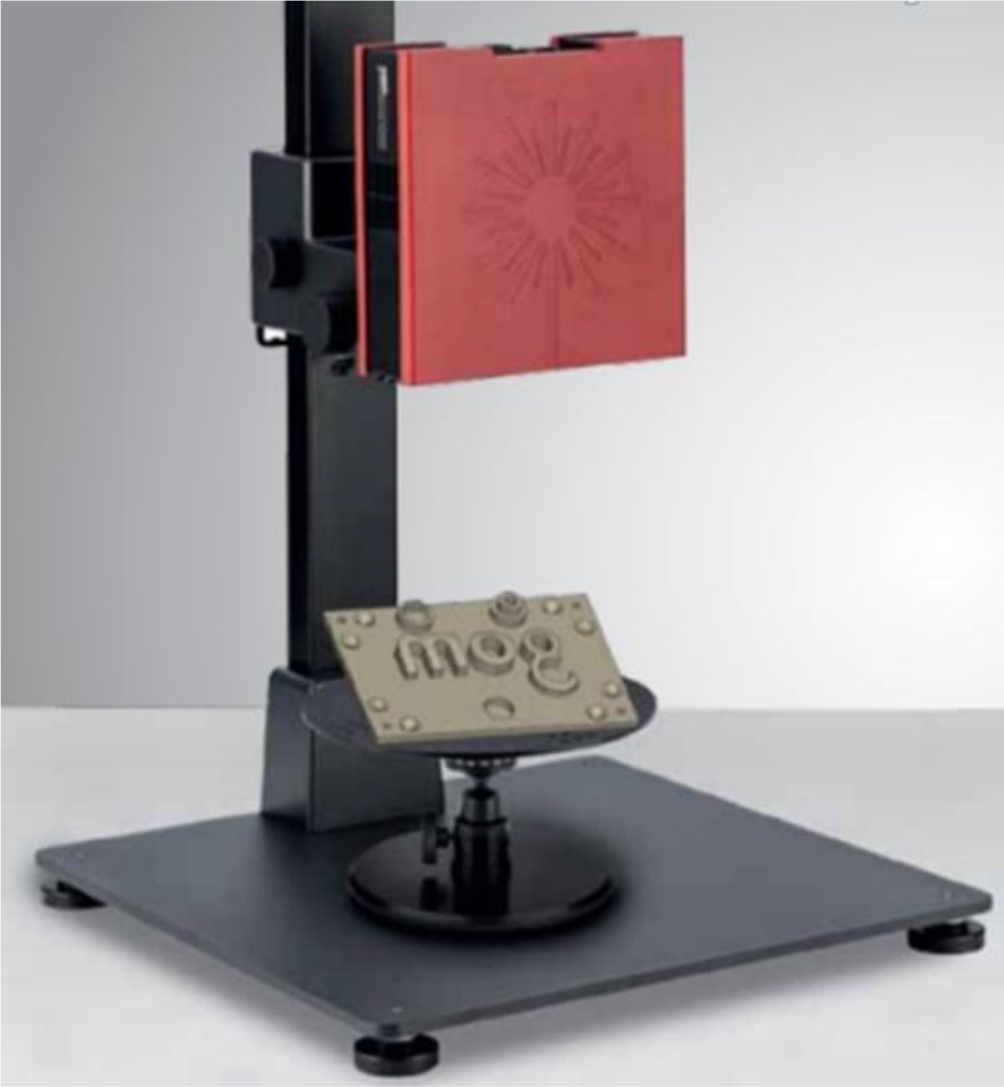
The ATOS Core scanner (Fig. 2) uses a stereoscopic camera system operating on the principle of triangulation. The scanner projects a pattern of stripes onto the surface of the object. These stripes are captured by two cameras, resulting in a phase shift based on the sinusoidal distribution of light intensity across the camera sensors. To achieve the highest sub-pixel accuracy, ATOS Core employs multiple phase shifts based on the heterodyne principle. Using optical transformation equations, independent 3D coordinates are automatically calculated for each camera pixel. The basic specifications of the scanner are presented in Table 1.
Tab. 1.
Technical data of the scanner
| Measurement area | 200 x 150 mm |
| Working distance | 250 mm |
| Point spacing | 0,08 mm |
| The device dimensions | 206 x 205 x 64 mm |
| Working temperature | 5 ° C do 40 ° C, without condensation |
The projection technology developed by GOM is based on a narrow-spectrum blue LED light source. This enables precise measurement regardless of ambient lighting conditions. GOM’s Blue Light Technology is characterised by an exceptionally long service life, minimal heat generation, and low operating costs.
. Measuring the Topography of the Canvas Ground
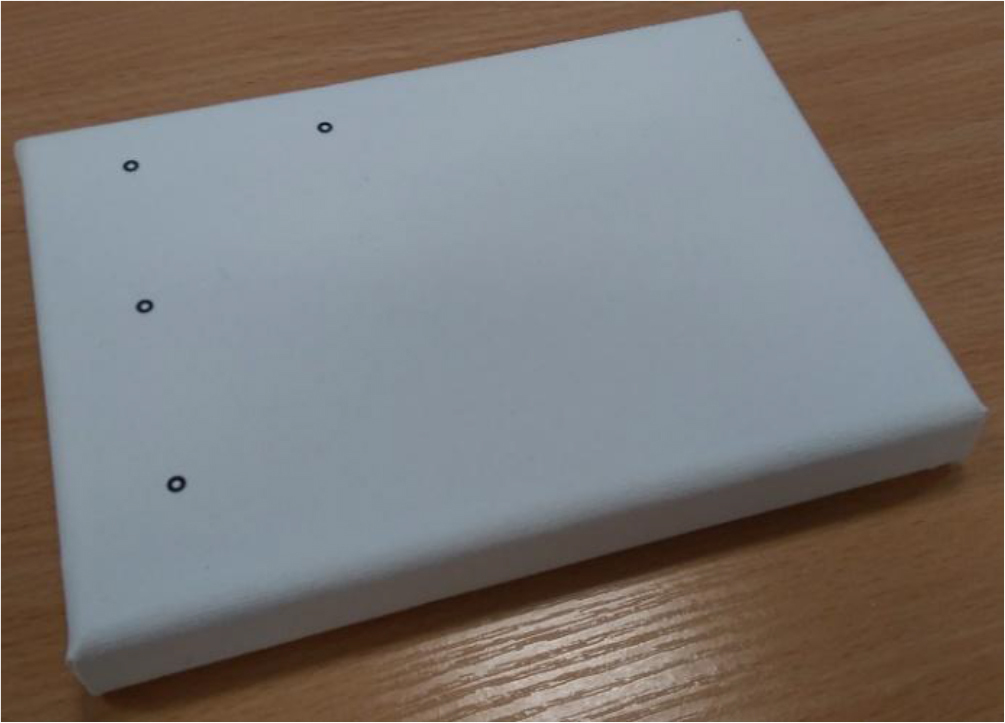
As part of the project, a sample of a linen canvas ground was prepared. The sample fit entirely within the measuring volume of the optical scanner. Preparation for scanning involved the application of reference markers, which enabled the automatic alignment and merging of individual scans during the digitalisation process. Figure 3 presents the canvas sample with the applied positioning markers.
. Determination of the Scanning Parameters
Before scanning the topography of the canvas sample, it was necessary to determine the scanning parameters to ensure optimal final results. The parameters defined included:
– the exposure time of the scanned object,
– the number of exposures,
– the resolution of the scanner matrix.
The entire scanning process was carried out using GOM Scan software, which controls the scanner. Within the software interface, the exposure time is adjusted manually using a virtual knob displayed on the computer screen. The scanner control software analyses the image captured by the scanner’s two cameras and provides feedback to the operator on the expected scan quality.
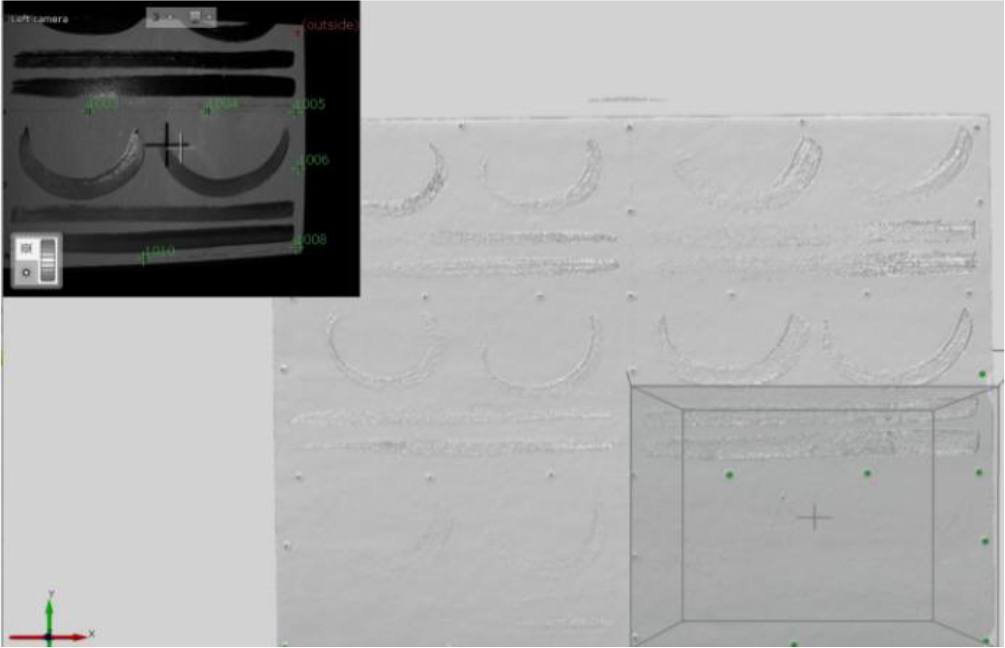
It is important to select an exposure time that prevents overexposure of the object. Overexposed areas are highlighted in red. Figure 4 illustrates a case of excessive exposure: the entire surface of the scanned canvas ground appears red in the scanner camera preview window (upper left corner of the figure). At this exposure setting, only the frame of the canvas ground was properly recorded.
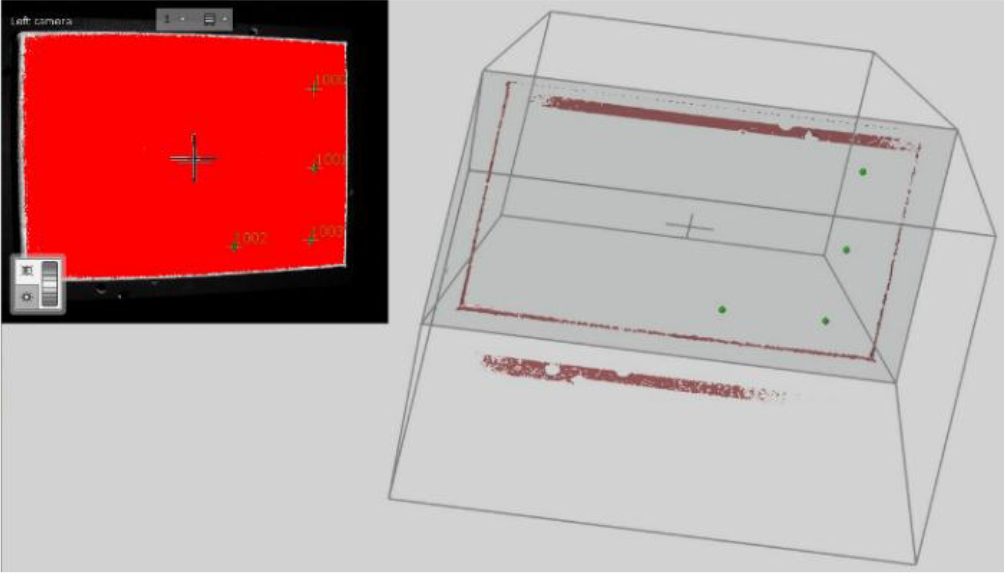
Therefore, the exposure time of the scanned object had to be shortened to eliminate the red-marked areas from the images captured by the cameras. This effect was achieved with an exposure time of 12 ms.
The scanner used allows for the selection of the number of exposures during a single scan. In this case, three options are available: one, two, or three exposures. The time ratio between successive exposures is 1:3:9. Multiple exposures are typically used for multicoloured objects, as each subsequent exposure is longer, improving scanning results across a wider colour range of the digitised object.
For the tested canvases, a trial was conducted using three exposure durations: 12 ms, 36 ms, and 108 ms. The observed percentages of measurement points for each exposure were as follows:
– 12 ms – 98% of measurement points observed,
– 36 ms – 2% of measurement points observed,
– 108 ms – 0% of measurement points observed.
Based on this information, the decision was made to eliminate the longest exposure time (108 ms), during which no measurement points were recorded.
The final scanning parameter selected was the scanner matrix resolution, which directly determines the number and spacing of the observed measurement points. The ATOS 200 scanner offers two scanning modes:
– Full Scan, which provides the scanner’s maximum resolution of 5 MP, and
– Fast Scan, which sets the resolution to 2 MP.
Since the objective of the project was to accurately reproduce the topography of the scanned objects, all canvases samples were scanned using the maximum resolution setting.
In summary, the selected scanning parameters for the canvas ground samples were:
. Determining the Topography of the Canvas
Once the scanning parameters had been established, the canvas sample was digitised. Four reference markers were applied to the canvas, enabling the automatic alignment and merging of individual scans into a unified dataset accurately representing the object's topography.
The digitised object was mounted on a rotary measuring table. The digitisation process involved acquiring five directional scans. The first scan was taken with the measuring table in the horizontal position. The table was then tilted by 30° along the horizontal axis. In this tilted position, four additional scans were performed, with the table rotated by 90° around its vertical axis between each scan.
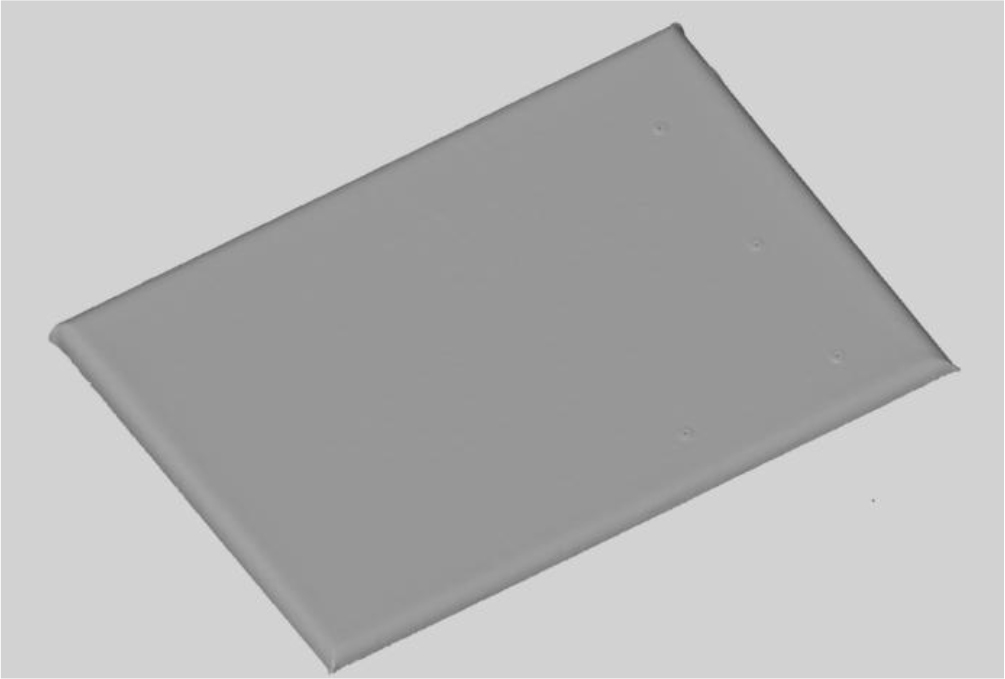
As a result, point clouds were obtained that accurately captured the surface topography of the scanned sub-images (Fig. 5).
The next stage of digitalisation involves converting the resulting point cloud into a triangular grid. During this process, called polygonisation, both filtering and unification of the scanning results take place. When the user initiates the polygonisation process, three levels of triangle mesh density can be selected (Fig. 6):
– Less details – provides a lower-quality representation of object details, resulting in the smallest file size,
– Standard – offers average mapping quality and a moderate file size,
– More details – delivers the highest level of detail, producing the largest file size.
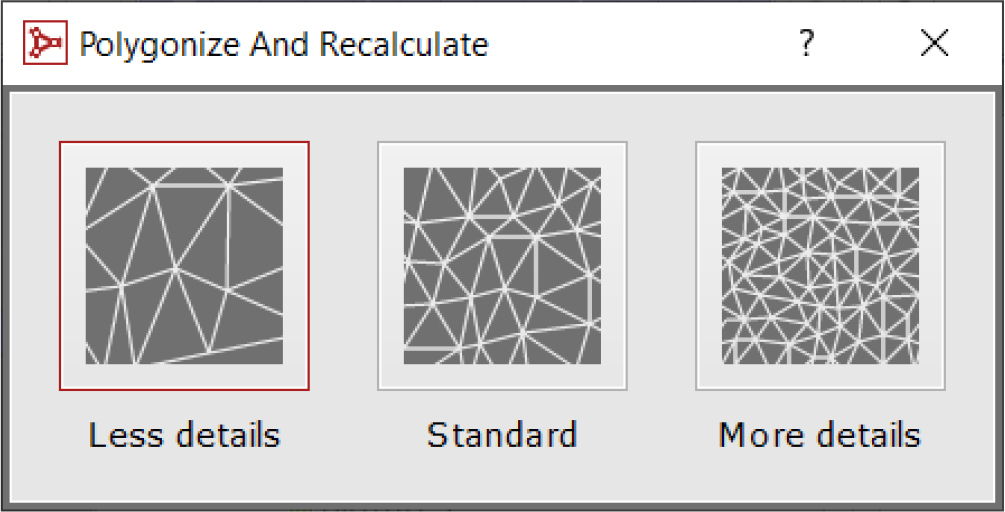
Figure 7 presents a graphical comparison of the three levels of detail achieved through the polygonisation process.
Fig. 7.
Three levels of detail obtained during the polygonisation process: (a) Less details, (b) Standard, (c) More details
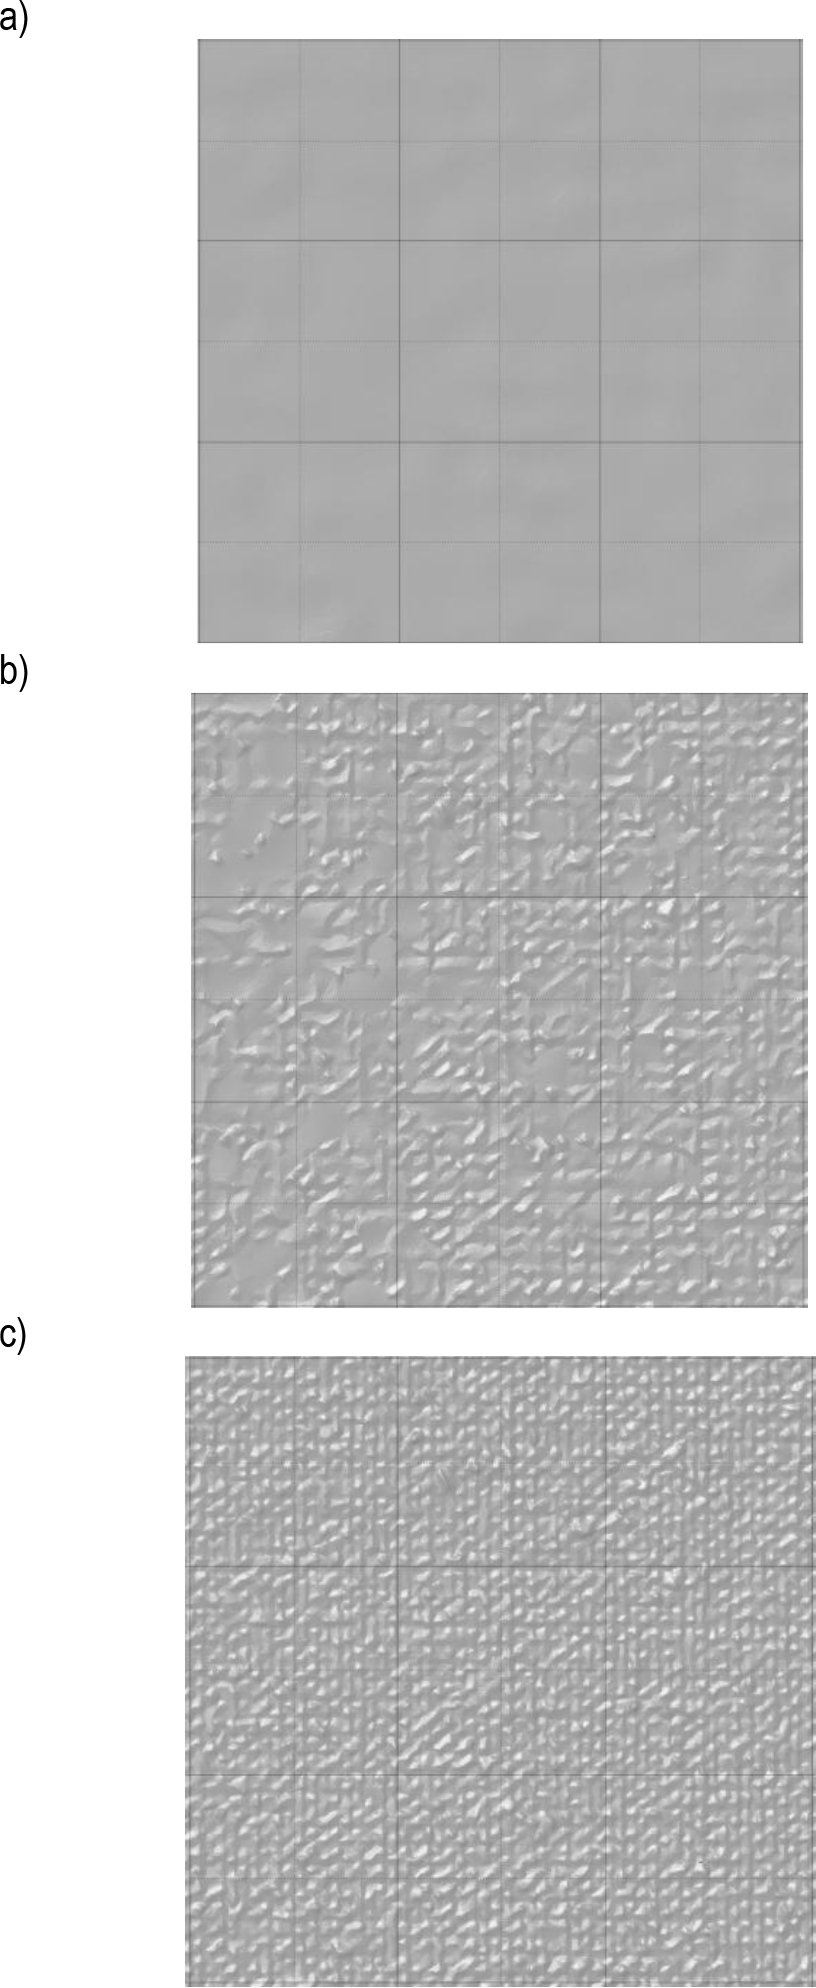
A quantitative summary of the polygonisation results is as follows:
– Less details – triangle mesh composed of 150,143 points,
– Standard – triangle mesh composed of 815,713 points,
– More details – triangle mesh composed of 1,863,953 points.
Given the project requirements, it was determined that the digitalisation should provide the most accurate representation of the surface topography. To meet this standard, the More details polygonisation mode was selected.
The resulting canvas topography scan was saved in STL format, a widely used standard in computer graphics for representing 3D geometry.
. Scanning the Topography of Painting Tool Paths on a 3D Scanner – Linen Canvas
. Selection of Sample Scanning Parameters
At this stage, selecting the number and duration of exposures during a single scan required detailed analysis. This was necessary due to two main factors:
– the samples were not monochromatic,
– the paint paths varied in shade due to differences in application speed and paint density.
Single-exposure scanning typically yields optimal results only for monochromatic objects. However, for the analysed samples, the scanning parameters had to be carefully adjusted to accurately capture both the underlying canvas texture and the variations in the paint paths.
As a result, the most advanced scanning option was selected— performing a single scan using three exposures. The exposure times were set in a ratio of 1:3:9, allowing the system to capture a wider range of shades and details, which is essential for scanning multicoloured or textured surfaces.
The first step in selecting digitalisation parameters was to set the shortest exposure time to prevent overexposure—this was verified by ensuring that no red zones appeared in the scanner camera preview (see Fig. 8).
Fig. 8.
Scanning result using the shortest exposure time, effectively eliminating overexposure of the scanned object
Using the selected exposure times, a series of sample scans were conducted and subsequently analysed. The results confirmed that the chosen exposure settings allowed for accurate reproduction of both the canvas and the painted paths on the samples. However, the initial images of the painting paths displayed several deficiencies, such as blank zones and ambiguous areas, which required correction.
To address this, it was decided that the digitisation of the painting samples would be performed in two separate scan series, each using different exposure settings. The first series, based on the predetermined exposure times, aimed to capture a comprehensive digital image of the entire sample - including both the canvas and the paint paths.
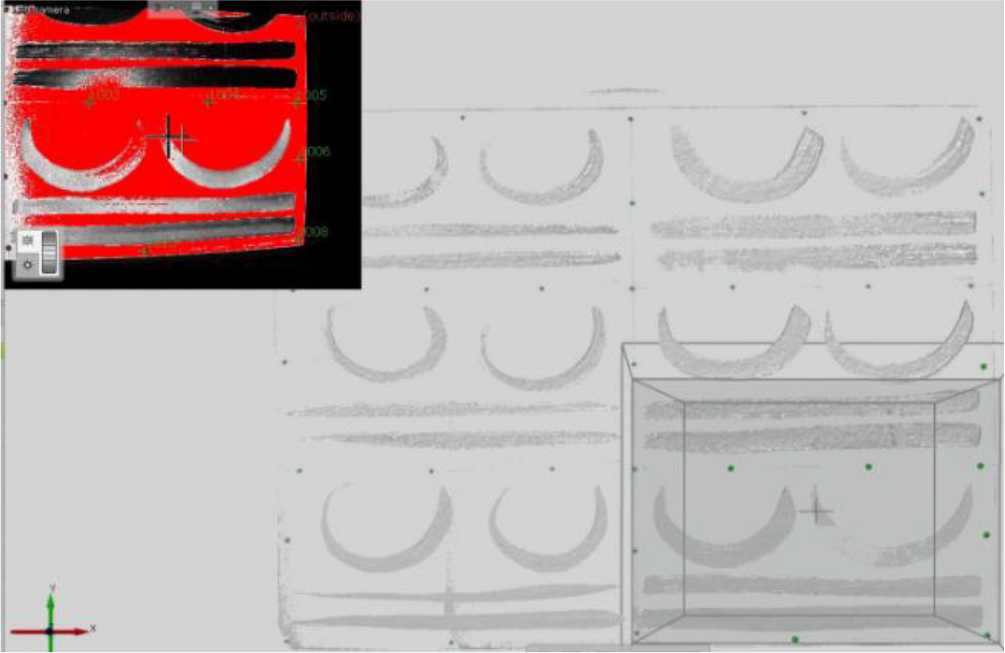
The second objective of the digitisation process was to isolate and accurately map the topography of the paint paths themselves. Therefore, a second series of scans was performed with specifically adjusted exposure settings. For this series, the minimum exposure time was deliberately selected to fully overexpose the canvas areas, as illustrated in Figure 9. These overexposed areas, highlighted in red in the scanner preview, are excluded from the digitalisation output.
Fig. 9.
Scanning effect with the shortest exposure time selected for the digitalisation of the painting paths
Following a series of test scans, it became clear that the canvas was effectively removed from the digital data, leaving behind a highly accurate representation of the topography of the painted paths alone.
Summary of selected scanning parameters for painting path samples on canvas ground:
– basic (shortest) exposure time: 9.56 ms,
– 1st scan series (digitisation of canvas and painting paths): single scan with three exposures at: 9.56 ms, 28.69 ms, 86.07 ms,
– 2nd scan series (digitisation of painting paths only): single scan with three exposures at: 40.05 ms, 120.14 ms, 360.41 ms,
– maximum scanner resolution: 5 MP.
. Determining the Topography of Painting Paths on a Canvas
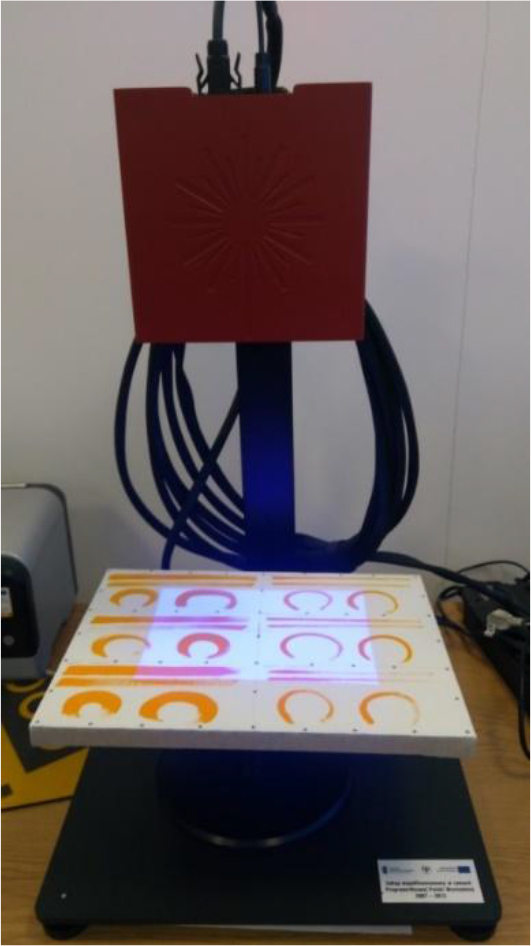
The digitalisation procedure began with the application of reference markers. The positions of these reference points for each sample are shown in Figure 1. Following this, the object was mounted onto the rotating and tilting table of the optical scanner (see Figure 10).
The size of the samples significantly exceeded the measurement volume of the scanner. Therefore, digitising the entire object required multiple repositionings and settings adjustments. Additionally, since two series of scans with different exposure times were necessary, a total of 54 component scans were performed.
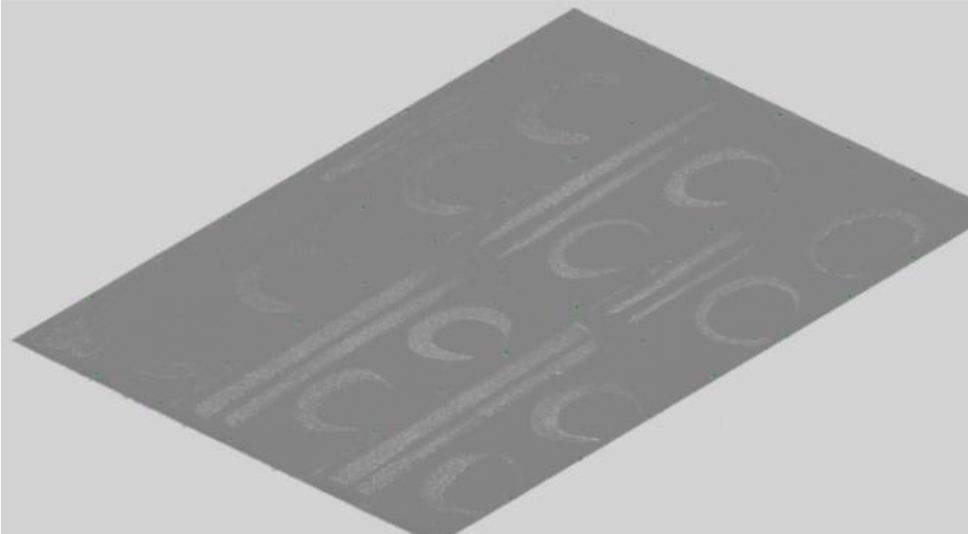
This process generated two separate point clouds: one representing the canvas along with the painting paths, and the other representing only the painting paths. Figure 11 illustrates the point cloud capturing the topography of the entire object.
Fig. 11.
Graphical representation of the scanning results showing the point cloud of the entire object’s topography
Both point clouds were subsequently converted into triangular meshes. The resulting models, saved in STL format, are suitable for further processing in computer graphics applications.
Figure 12 presents a selected fragment of the results corresponding to one brush type and paint density. To facilitate comparison with the initial state, Fig. 12a shows a photograph of the scanned section of the sample. Fig. 12b displays the topography of the painting paths along with the surrounding canvas, while Fig. 12c depicts the topography of the painting paths alone.
SUMMARY
This paper presents a method for the digitalisation of painting paths and canvases. A unique challenge was the large surface area combined with low height of the objects, which made typical equipment designed for small-object digitisation unsuitable. As demonstrated, using a standard professional optical scanner required precise determination of critical scanning parameters and appropriate data processing.
The study shows that accurate selection of the number and duration of individual exposures enables selective data acquisition— either capturing the entire canvas or isolating just the paint paths— and allows for faithful reproduction of the scanned object's shapes.
The research involved close collaboration with a professional visual artist. This collaboration was essential because the resulting models of the canvas and painting paths were used to develop a computer application introducing users to the glazing painting technique.
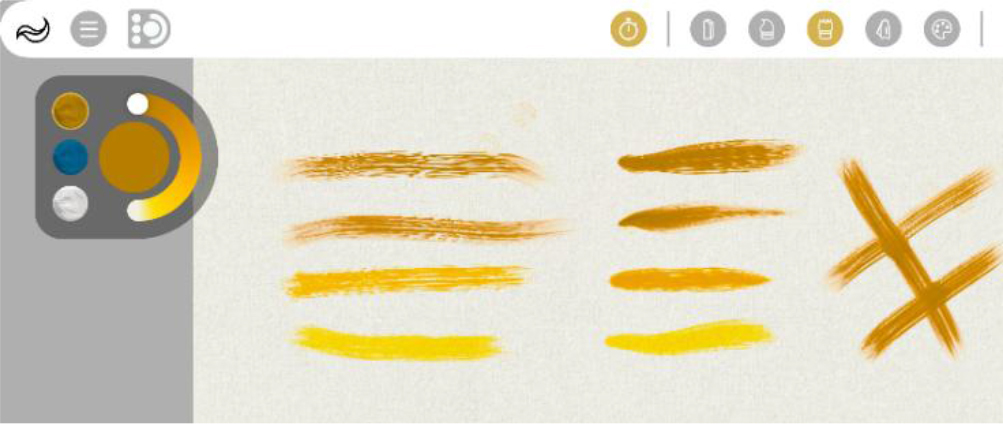
The “Glaze” application, developed from this research, simulates two substrates commonly used in oil painting: board and canvas. For both substrates, the optical properties were modelled based on visible-light spectrograms obtained during scanning. The canvas also incorporates a two-dimensional representation of spatial texture derived from three-dimensional scanning. This texture realistically simulates brushstrokes and paint traces at varying levels of dilution.
Figure 13 presents sample paint strokes created with two different brushes—sable (left column) and hog (right column). The degree of paint dilution varies from impasto (first two rows) to glazing (bottom rows). On the right, crisscrossing brushstrokes illustrate the typical layering order used in the impasto technique.