
Introduction
Selection of the refrigerant in vapour compression refrigeration systems significantly affects the overall performance of the system, energy consumed, and ecological footprint of the system. Among HFC compounds, R134a refrigerant has been used for a very long time because of its thermal efficacy. However, its GWP of 1300 is extremely harmful from an environmental standpoint. 197 countries agreed under the Kigali Amendment to the Montreal Protocol to phase out HFCs with a reduction of 80% by 2028. This clearly shows the need for green substitutes. With a zero Ozone Depletion Potential and extremely low GWP, R600a (isobutane) becomes a good contender to substitute R134a. Although some studies have looked at the basic properties of alternative refrigerants, there is a lack of understanding of the performance of these refrigerants on different system configurations, especially the capillary tube lengths which are important in shot determining the refrigerant flow rate, pressure drop, cooling effect, and work done by the compressor.
In VCR systems, capillary tubes act as expansion devices, and their length influences the throttling of the refrigerant and heat absorption in the evaporator. A tube that is too short may lead to overfeeding, while a tube that is too long will result in underfeeding, decreased cooling efficiency, and increased compressor effort. Therefore, for each refrigerant, the corresponding capillary tube length must be optimised to achieve maximum performance.
This study seeks to plug the breach in literature by assessing the presentation of R134a and R600a in a VCR system with mutable capillary tube lengths of 2.43m, 3.04m, 3.65m, and 4.26m. The aim of this work is to measure the COP, cooling effect, and compressor power use, and to clearly show how different capillary tube arrangements influence the performance of both eco-friendly and conventional refrigerants. The findings are expected to help in designing refrigeration systems that offer better efficiency while keeping their environmental impact as low as possible.
Literature survey
Another challenge in adopting low-GWP, environmentally friendly refrigerants is the need for deeper research into alternatives for traditional vapor-compression systems. In one study, Al-Sayyab et al. [1] tested R1234yf and found that its COP was only about 3–5% lower than that of R134a. Their results suggest that R1234yf can still work well in both refrigeration and heat-pump applications. Velasco et al. [2] studied R513A as a drop-in replacement for R134a in a minichannel chiller and found 3–6% lower power consumption and up to 4% higher COP, which established its potential as a high-efficiency alternative. Colombo et al. [3] tested R1234yf and R1234ze(E) in water-to-water heat pumps and demonstrated competitive performance, with the latter showing up to 10% higher volumetric efficiency at low temperatures. Mota-Babiloni et al. [4] reviewed low-GWP synthetic refrigerants and highlighted that many HFOs offer energy savings between 5 and 15%, although barriers to market adaption include mild flammability. McLinden et al. [5] have identified performance–safety trade-offs among low-GWP refrigerants and have noted that only a small fraction of these molecules meets both high efficiency and low environmental impact criteria. Aprea et al. [6] have presented HFO/HFC-134a mixtures that improve energy efficiency by 4–7%, therefore offering reduced environmental impact without performance compromise. Morales-Fuentes et al. [7] compared R134a and R1234yf in display refrigeration and found similar COP values if proper tuning is carried out. Li et al. [8] have demonstrated that low-GWP refrigerant compressor modulation strategies reduce power consumption by up to 8% in household systems. Lee and Jung [9] reported that R1234yf has delivered 2–3% lower cooling capacity but maintained comparable COP to R134a in automotive AC. Among natural refrigerants, Srinivas et al. [10] have evaluated LPG (R290/R600a blend) and recorded 12–15% higher COP, thus emphasizing flammability challenges. Kumar et al. [11] showed that using nanocomposite-enhanced refrigerants in vapor-compression systems can raise the COP by as much as 20%, particularly when the capillary tube length is properly optimized. Albà et al. [12] examined refrigerants at the molecular level and linked their structural characteristics to their thermodynamic behavior. At the system scale, Pektezel and Acar [14] found that hybrid energy–exergy configurations can boost overall efficiency by 6–12%. Sazhin [15] suggested design changes in evaporators that improved heat release and made operation more stable under different load conditions. Shabir et al. [16] looked at adsorption cooling systems based on carbon-based adsorbents and reported COP values 3–5% higher than those achieved with traditional silica-gel systems. For R600a specifically, Leão et al. [17] compared it with R134a, R245fa, and R407C in microchannel heat sinks. Their results showed that R600a produced the lowest pressure drop along with better thermal performance. Sempértegui-Tapia and Ribatski [18] also reported strong boiling heat-transfer behavior for R600a, especially at low mass fluxes. Yang et al. [19] and Shafaee et al. [20] confirmed that R600a offers efficient heat transfer with very low pressure losses, with performance improving further in helically dimpled tubes. Oliveira et al. [21] verified its suitability in small-diameter tubes and observed a 6–8% increase in COP when mass flux was optimized. Ahamed et al. [22] compared R600a with R134a in domestic refrigerators and recorded up to 18% higher exergy efficiency for R600a. Yan et al. [23] then reported that R290/R600a zeotropic blends could raise the COP by 10–12% while cutting power consumption noticeably.Recent research continues to highlight the value of environmentally friendly, high-efficiency refrigerants for both household and commercial cooling. Smith et al. (2025) demonstrated that low-GWP refrigerants can deliver strong performance when operated under optimized conditions [24]. Khan and Verma (2025) observed improved thermal and exergetic characteristics in vapor-compression units running on alternative refrigerants, particularly under varying outdoor temperatures [25]. Zhang et al. (2025) examined advanced control strategies and system-level optimizations that significantly raise COP and lower emissions in modern refrigeration systems [26]. Lopez and Martinez (2024) provided a detailed thermodynamic evaluation of hydrocarbon refrigerants, showing their strong potential as replacements in capillary-tube-based systems [27].
Tab. 1
Study/Source | Refrigerant(s) | System/ Conditions | Capillary/System Configuration | Key Outcomes (COP, Energy, Heat Transfer, Performance Trends) |
Al-Sayyab et al. [1] | R1234yf vs. R134a | Heat pump & refrigeration | Standard expansion device | R1234yf COP 3–5% lower; suitable low-GWP alternative |
Velasco et al. [2] | R513A vs. R134a | Minichannel water chiller | Chiller loop | R513A shows 3–6% lower power use; COP up to 4% higher |
Colombo et al. [3] | R1234yf, R1234ze(E) | Water-to-water heat pump | Standard heat pump layout | R1234ze(E) improves volumetric efficiency by ~10% at low temps |
Aprea et al. [6] | HFO/HFC blends | Domestic refrigeration | Capillary + compressor system | Mixtures show 4–7% higher energy efficiency |
Morales-Fuentes et al. [7] | R134a vs R1234yf | Display refrigeration | Conventional DX system | Comparable COP when tuned correctly |
Li et al. [8] | Low-GWP fluids | Household compressor systems | Variable-speed compressor | Up to 8% power savings with modulation |
Lee & Jung [9] | R1234yf vs R134a | Automotive AC | TXV-based system | R1234yf: 2–3% lower cooling capacity, nearly same COP |
Srinivas et al. [10] | R600a/LPG | Domestic refrigerator | Capillary tube | COP improvement of 12–15%; safety concerns noted |
Leão et al. [17] | R134a, R245fa, R407C, R600a | Microchannel heat sinks | Microchannel tubes | R600a lowest pressure drop&strong thermal performance |
Sempértegui-Tapia & Ribatski [18] | R600a | Horizontal microchannels | Microchannel evaporator | High boiling HTC especially at low mass flux |
Oliveira et al. [21] | R600a | Small-diameter tubes | 1–3 mm tubes | COP improves 6–8% with optimized mass flux |
Ahamed et al. [22] | R600a vs. R134a | Domestic refrigerator | Capillary tube + compressor | R600a has up to 18% higher exergy efficiency |
Yan et al. [23] | R290/R600a | Household appliances | Capillary-based system | COP improves 10–12%; lower power usage |
Current Study | R134a vs. R600a | VCR system at 31°C–37°C ambient | Capillary lengths: 2.43 m, 3.04 m, 3.65 m, 4.26 m | Capillary 2.43 m: R134a COP higher by 7.86–23.91%; Capillary 3.04 m: R134a higher by 8.53–24.49%; Capillary 3.65 m: Mixed—R600a slightly better at 35°C; R134a better at 31°C, 33°C, 37°C; Capillary 4.26 m: R600a significantly better at high temperatures (35°C: +50.53%, 37°C: +36.26%); Overall: R134a excels at short tubes; R600a excels at long tubes & high temperatures |
Novel contribution of this study
Comprehensive Comparative Evaluation: This study presents a unified experimental comparison of R134a and R600a over four different capillary tube lengths (2.43–4.26 m). Earlier research has not covered this full range in a single study, even in recent work focused on low-GWP refrigerants and VCR system optimization.
Integrated Performance Assessment: By examining COP, power consumption, and cooling capacity together, this work provides a clearer overall picture of system behavior. Most previous studies looked at these parameters separately. The combined approach used here reflects current efforts to improve efficiency in thermal systems using low-GWP refrigerants.
Refrigerant–Configuration Interaction: Unlike earlier studies that treated refrigerant properties and component design independently, this work evaluates how the refrigerant and the capillary configuration interact. This combined perspective is highly practical for designing sustainable, adaptable VCR systems using modern optimization strategies.
Safe and Optimized Use of R600a: Although R600a is flammable, the results show that appropriate capillary selection and careful system tuning can balance safety and efficiency. This supports the engineering-based mitigation methods suggested in recent literature and shows how R600a can be used safely in practice.
Post-Kigali Contribution: By linking refrigerant choice with component-level optimization, this study helps close an important research gap in the post-Kigali phase-down era. It supports the global shift toward refrigeration technologies that are both environmentally responsible and technically efficient.
Problem identification
The growing apprehension with regard to the ecological impact of conventional refrigerants, mainly R134a, owing to its high Global Warming Potential, has motivated the quest for environmentally friendly alternatives in VCR systems. While natural refrigerants like R600a and Hydrofluoro-olefins such as R1234yf present much lower GWP values, differences in performance optimization, safety concerns, and compatibility with the existing system pose several challenges. Key knowledge gaps are the long-term efficiency of the alternative refrigerants, influence of length variation in the capillary tube, lack of comparative studies between HFOs and hydrocarbons, and how nanofluids can enhance the performance of such systems.
Further, safety issues regarding hydrocarbon refrigerants and the requirement for hybrid refrigerant blends will need to be investigated in order to come up with appropriate energy-efficient and environment-friendly refrigeration systems.
Objectives of the study
To empirically compare the performance of R134a and R600a in a vapor compression refrigeration system under supervised test conditions.
To evaluate the effect of capillary tube length (2.43 m, 3.04 m, 3.65 m, and 4.26 m) on the system’s coefficient of performance (COP), power consumption, and cooling capacity for both refrigerants.
To analyse the effect of varying ambient temperatures (31°C–37°C) on the operating behaviour of R134a and R600a.
To identify the optimal combination of refrigerant and capillary tube length that maximizes efficiency and minimizes power consumption for given environmental conditions.
To assess the suitability of R600a as a replacement for R134a based on experimental evidence derived from the combined effects of refrigerant type, capillary geometry, and ambient temperature.
In overall, “The objective of this study is to experimentally compare the performance of R134a and R600a under different capillary tube lengths and ambient temperatures, focusing on COP, power consumption, and cooling capacity.”
Methodology
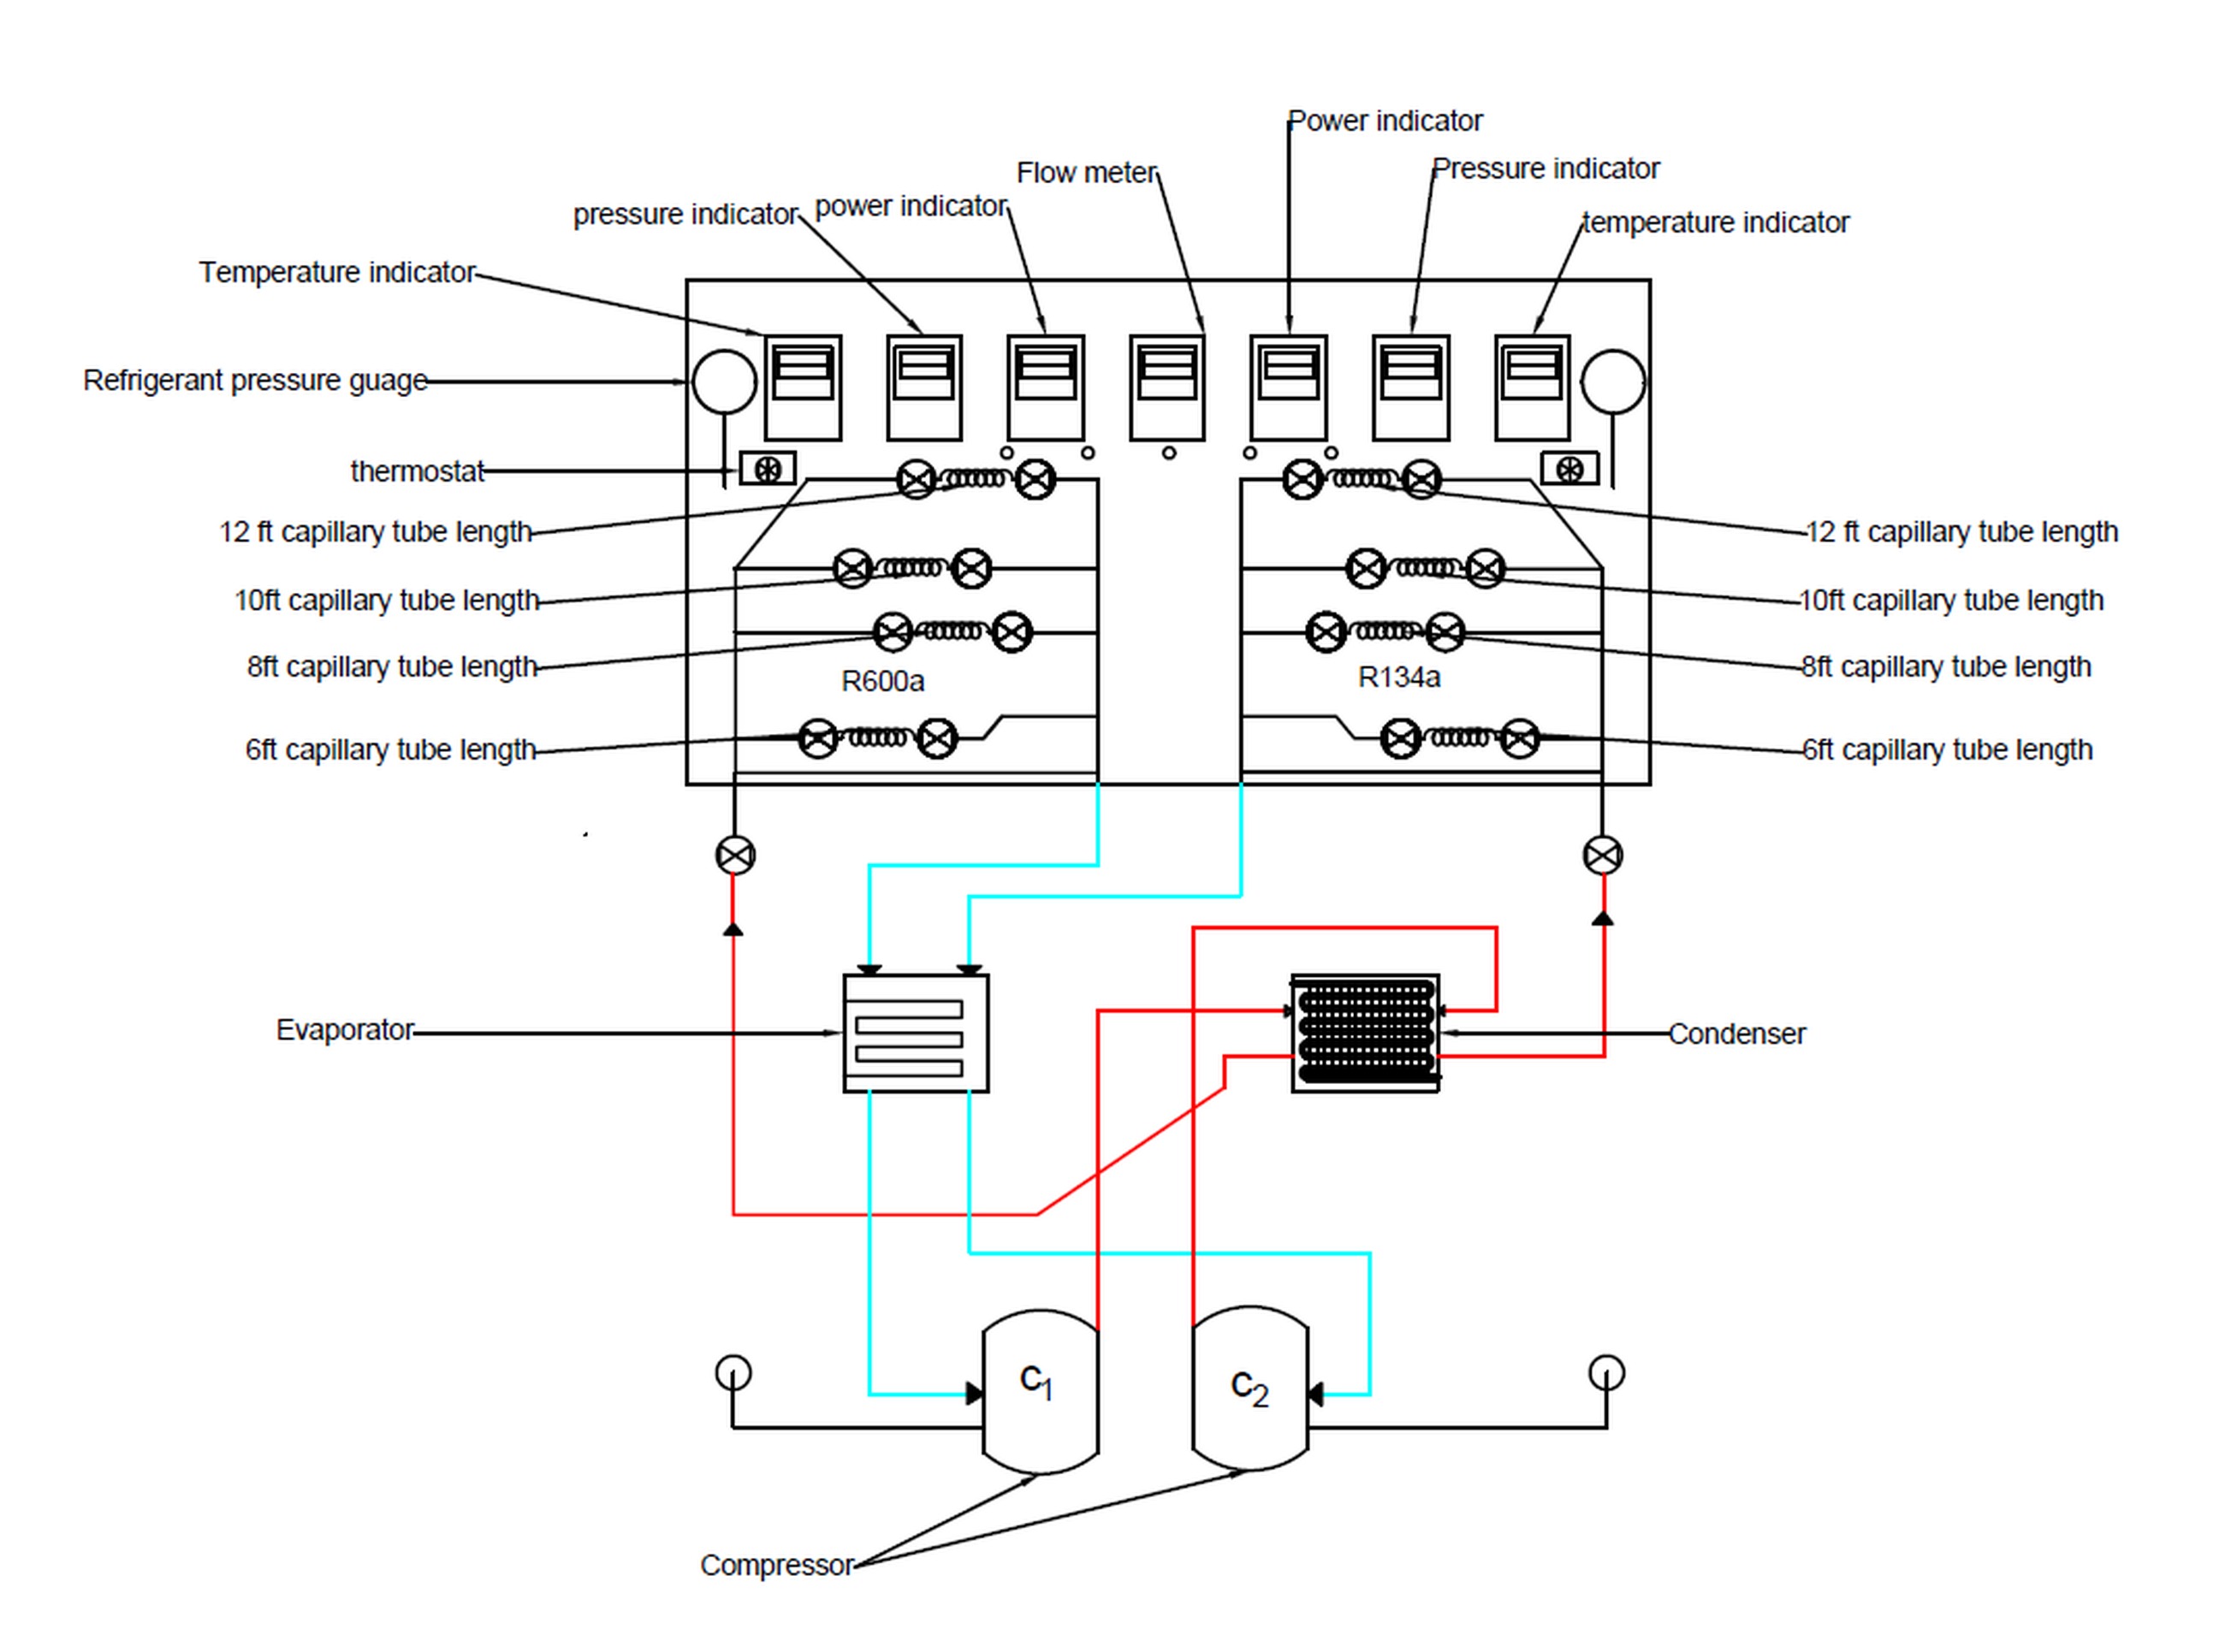
The test facility consisted of a VCR system with varying range of capillary tubes as in shown in Figure 1. The experiments were conducted on a custom vapor compression refrigeration (VCR) test rig incorporating a 1/3 HP hermetic compressor (R134a compatible), an air-cooled fin-tube condenser, an evaporator coil immersed in a water bath, interchangeable capillary tubes made of copper material and having a diameter of 1.1mm and lengths 2.43 m, 3.04 m, 3.65 m, and 4.26 m, a dimmer-controlled 230 V electrical heater for load variation, a 230 V solenoid valve for refrigerant flow control, a rotameter for water flow indication, and HP/LP cut-outs for compressor protection. System pressures and temperatures were monitored using calibrated Bourdon gauges (±1% F.S.) and K-type thermocouples (±0.5°C), while compressor power input was recorded using a digital wattmeter (±0.5%). The system was evacuated prior to each trial and then charged with either R134a or R600a, which were tested under identical ambient conditions (31–37°C). A 7-liter water load was placed in the evaporator bath, and cooling performance was recorded down to a water temperature of 10°C. In each run, suction and discharge pressures, refrigerant temperatures, power consumption, and water bath temperatures were recorded continuously with the data acquisition system. Each refrigerant–capillary-length combination was run three times, and average values were used for evaluation. COP, cooling capacity, and power consumption were computed using standard refrigeration equations, and an uncertainty analysis based on instrument accuracy and data variability yielded an overall COP uncertainty within ±3–5%.
The experimental study was carried out with a vapor compression refrigeration set-up using R134a refrigerant, which was subjected to different condenser temperatures of 31°C, 33°C, 35°C, and 35°C, together with capillary tube lengths of 2.43m, 3.04m, 3.65m, and 4.26m, respectively. The experiment was repeated with R600a as the refrigerant. For a given condenser temperature of 31°C and a capillary length of 2.43m, the temperatures in the system were defined as follows: T₁ is the compressor inlet temperature, T₂ is the compressor outlet temperature, T₃ is the condenser outlet temperature, T₄ is the evaporator outlet temperature, and T₅ is the temperature of the thermal load inside the evaporator. Delivery pressure or condenser pressure is represented as Pd, and suction pressure or evaporator pressure is represented as Ps. Work input to the compressor and time in seconds taken for each cooling or pull-down cycle were also measured. The above procedure was again repeated by using capillary tubes of lengths 3.04m, 3.65m, and 4.26m. The obtained values of R134a refrigerant are tabulated in Table 1, while the values of R-600a are tabulated in Table 2.
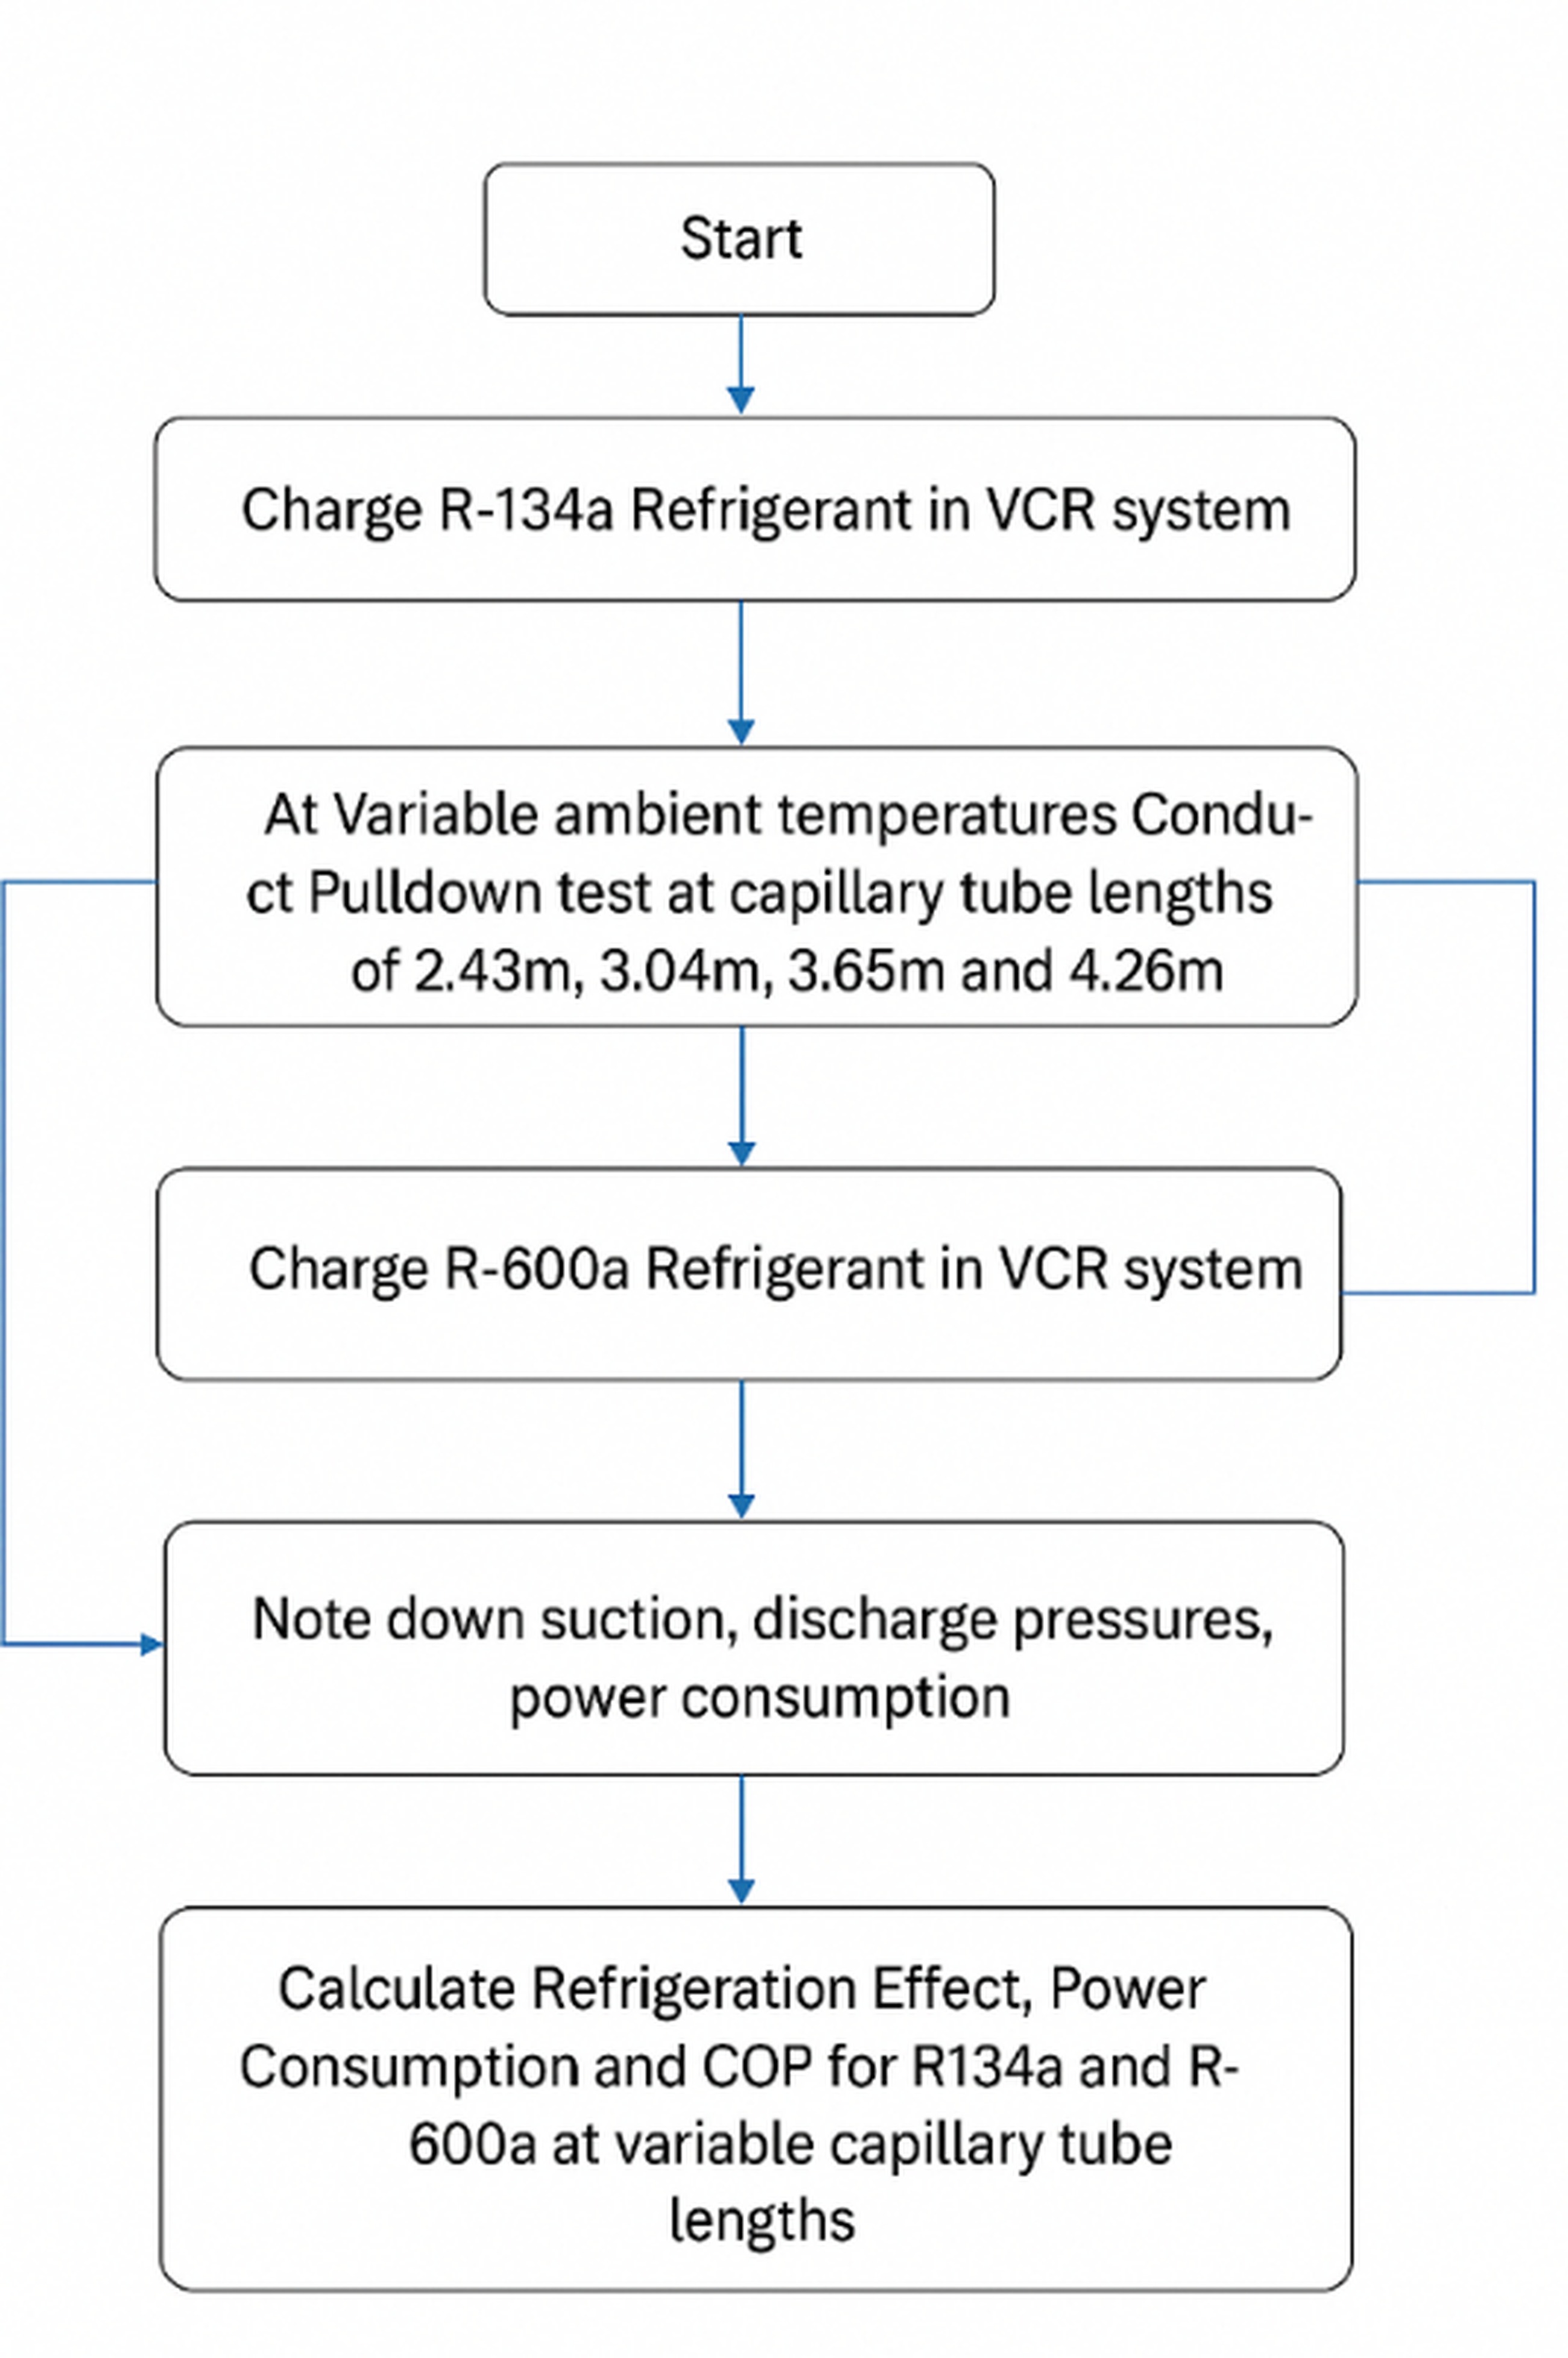
Figure 2 presents a flow diagram of the experimental procedure. The testing and data collection process are visually and logically represented in this flow diagram. It highlights the major steps involved, which start with the vapor compression refrigeration setup, changes in the capillary tube lengths, filling the system with refrigerants R134a and R600a, measuring pressure and temperature of the system, and evaluation of system performance at different operating conditions.
L represents the capillary tube length in meters. In general, temperature is expressed in degrees Celsius and pressure in kg/cm². The energy input to the compressor is measured in watts and pulldown time in seconds. The loading device in use is a dry evaporator with a 7-liter water load preserved at the required temperature, T5 of the evaporator. Calculations are performed for different observations to determine the coefficient of performance with R600a as the refrigerant.
Tab. 2
Investigational Remarks at several temperatures and Dissimilar extents of capillary tubes for R134a
Tab. 3
Investigational Remarks at several temperatures and Dissimilar extents of the capillary tubes for R600a
. Data reduction and modeling
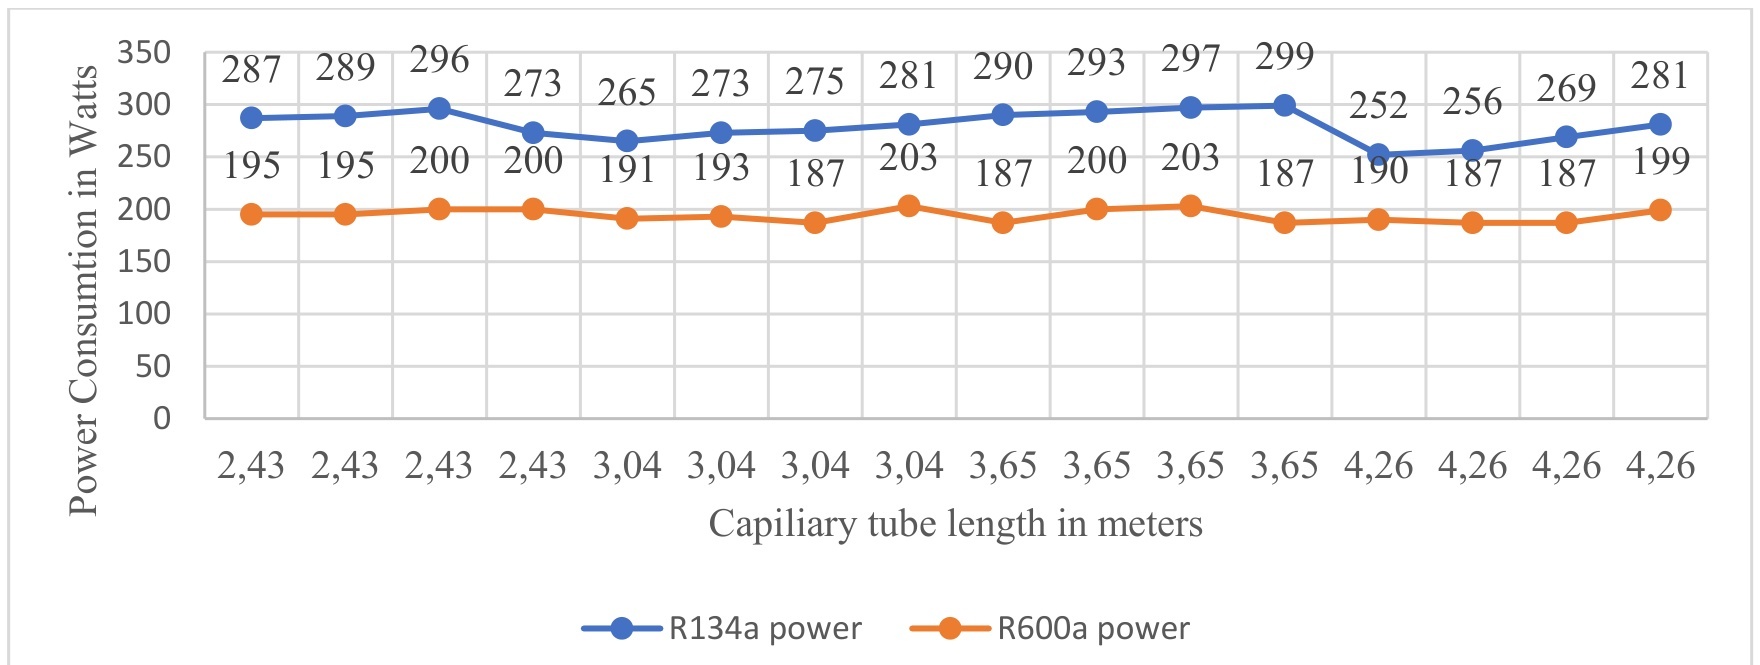
Figure 3 presents the variation in energy consumption of R134a and R600a with capillary tube length L. R134a has energy consumption in the range of 265–299 W, whereas R600a lies in the range of 187–203 W. Energy consumption by R134a decreases slightly with an increase in tube length and then it becomes constant while R600a is almost independent of variation in L. The above-presented predictive results have been obtained with a fitted MLR model, given below:
R134a Power = 174.26 + 0.77L + 0.50T₁ + 0.93Pd + 23.67Ps
R600a Power = 129.26 − 1.33L − 0.98T₁ + 13.85Pd − 4.36Ps.
With R² = 0.764, the model explains 76.4% of the variation in R134a power consumption, while its predictive strength for R600a is lower, with R² = 0.419. A separate regression of power vs. tube length reveals only a weak, statistically insignificant trend for R134a, as confirmed by the low R² value of 0.124 and high p-value of 0.182, which reassures that L has limited standalone influence on power consumption.
Analogously, R600a power exhibits a weak negative trend as well: 204.73−0.975⋅L, with R2=0.134 and p=0.163. The discharge pressure (Pd) does not vary significantly with L for either coolent (p>0.7), while the suction pressure (Ps) significantly decreases with L such that Ps=4.40−0.125⋅L, R2=0.281, p=0.035. These indicate L is a weak predictor of the variation in power consumption and discharge pressure but has a significant effect on suction pressure. The difference in power consumption between the coolants reduces slightly with increasing lengths, emphasizing that R600a has higher energy efficiency and is perhaps less sensitive to capillary length. R600a, with its lower power consumption and environmental benefits, is said to be more environmentally friendly.
Experimental Results
Table 3 shows the cooling capacity produced, power consumption and COP of the VCR System at variable ambient conditions at variable capillary tube lengths.
The Coefficient of Performance (COP) is defined as the ratio of the cooling capacity produced by the evaporator to the power input supplied to the compressor.
where m = mass of water to be cooled in kg,
The cooling effect generated by the evaporator is quantified in Watts, and the electrical power input can be directly measured using a wattmeter. Experimental results for both R134a and R600a as refrigerants are presented in Table 3, corresponding to capillary tube lengths of 2.43 m, 3.04 m, 3.65 m, and 4.26 m respectively.
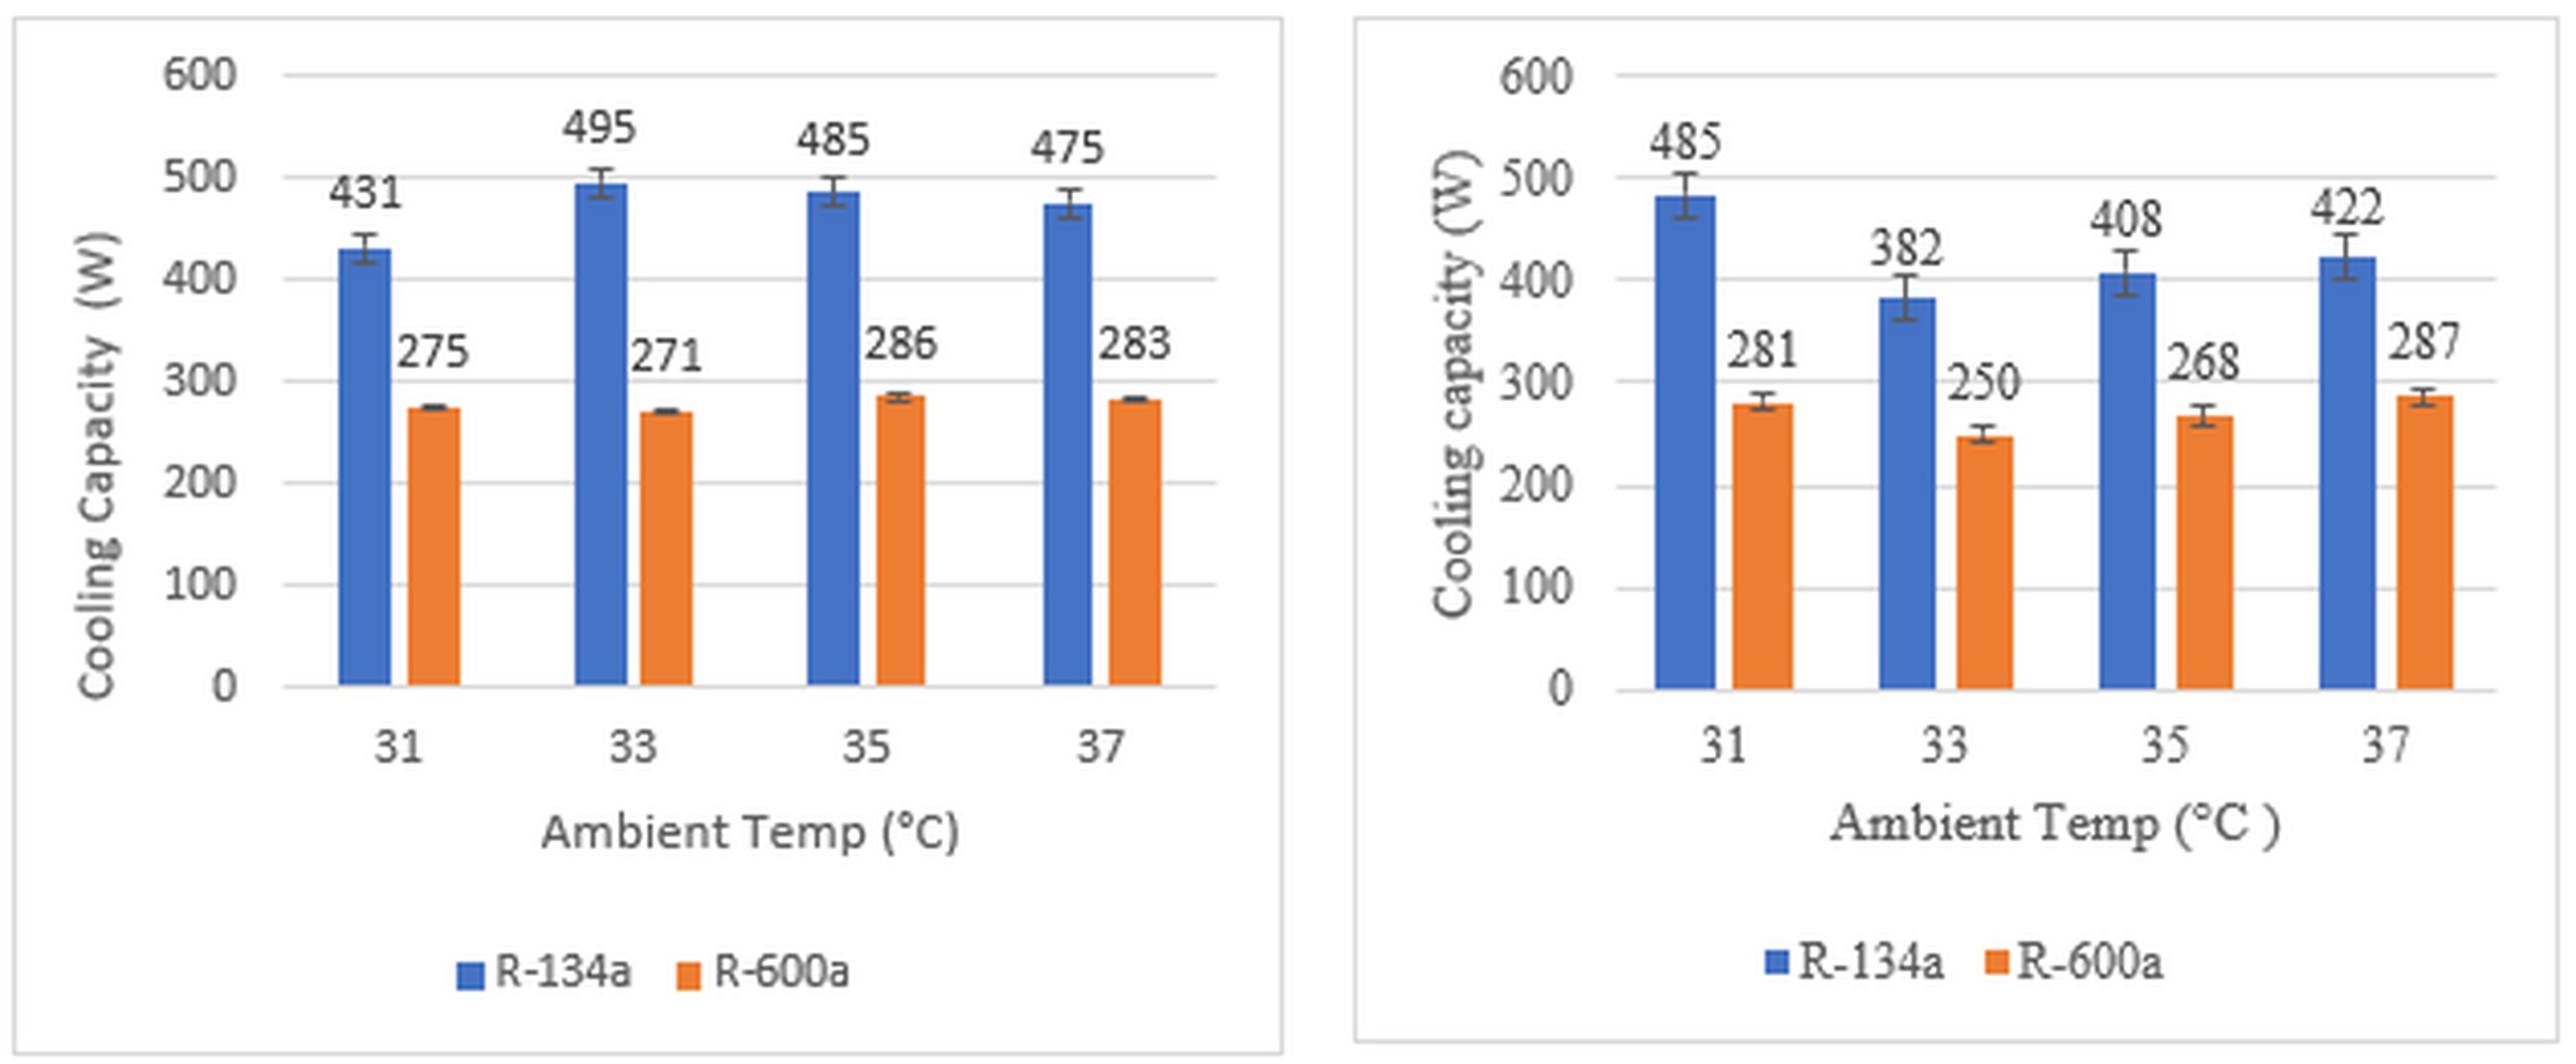
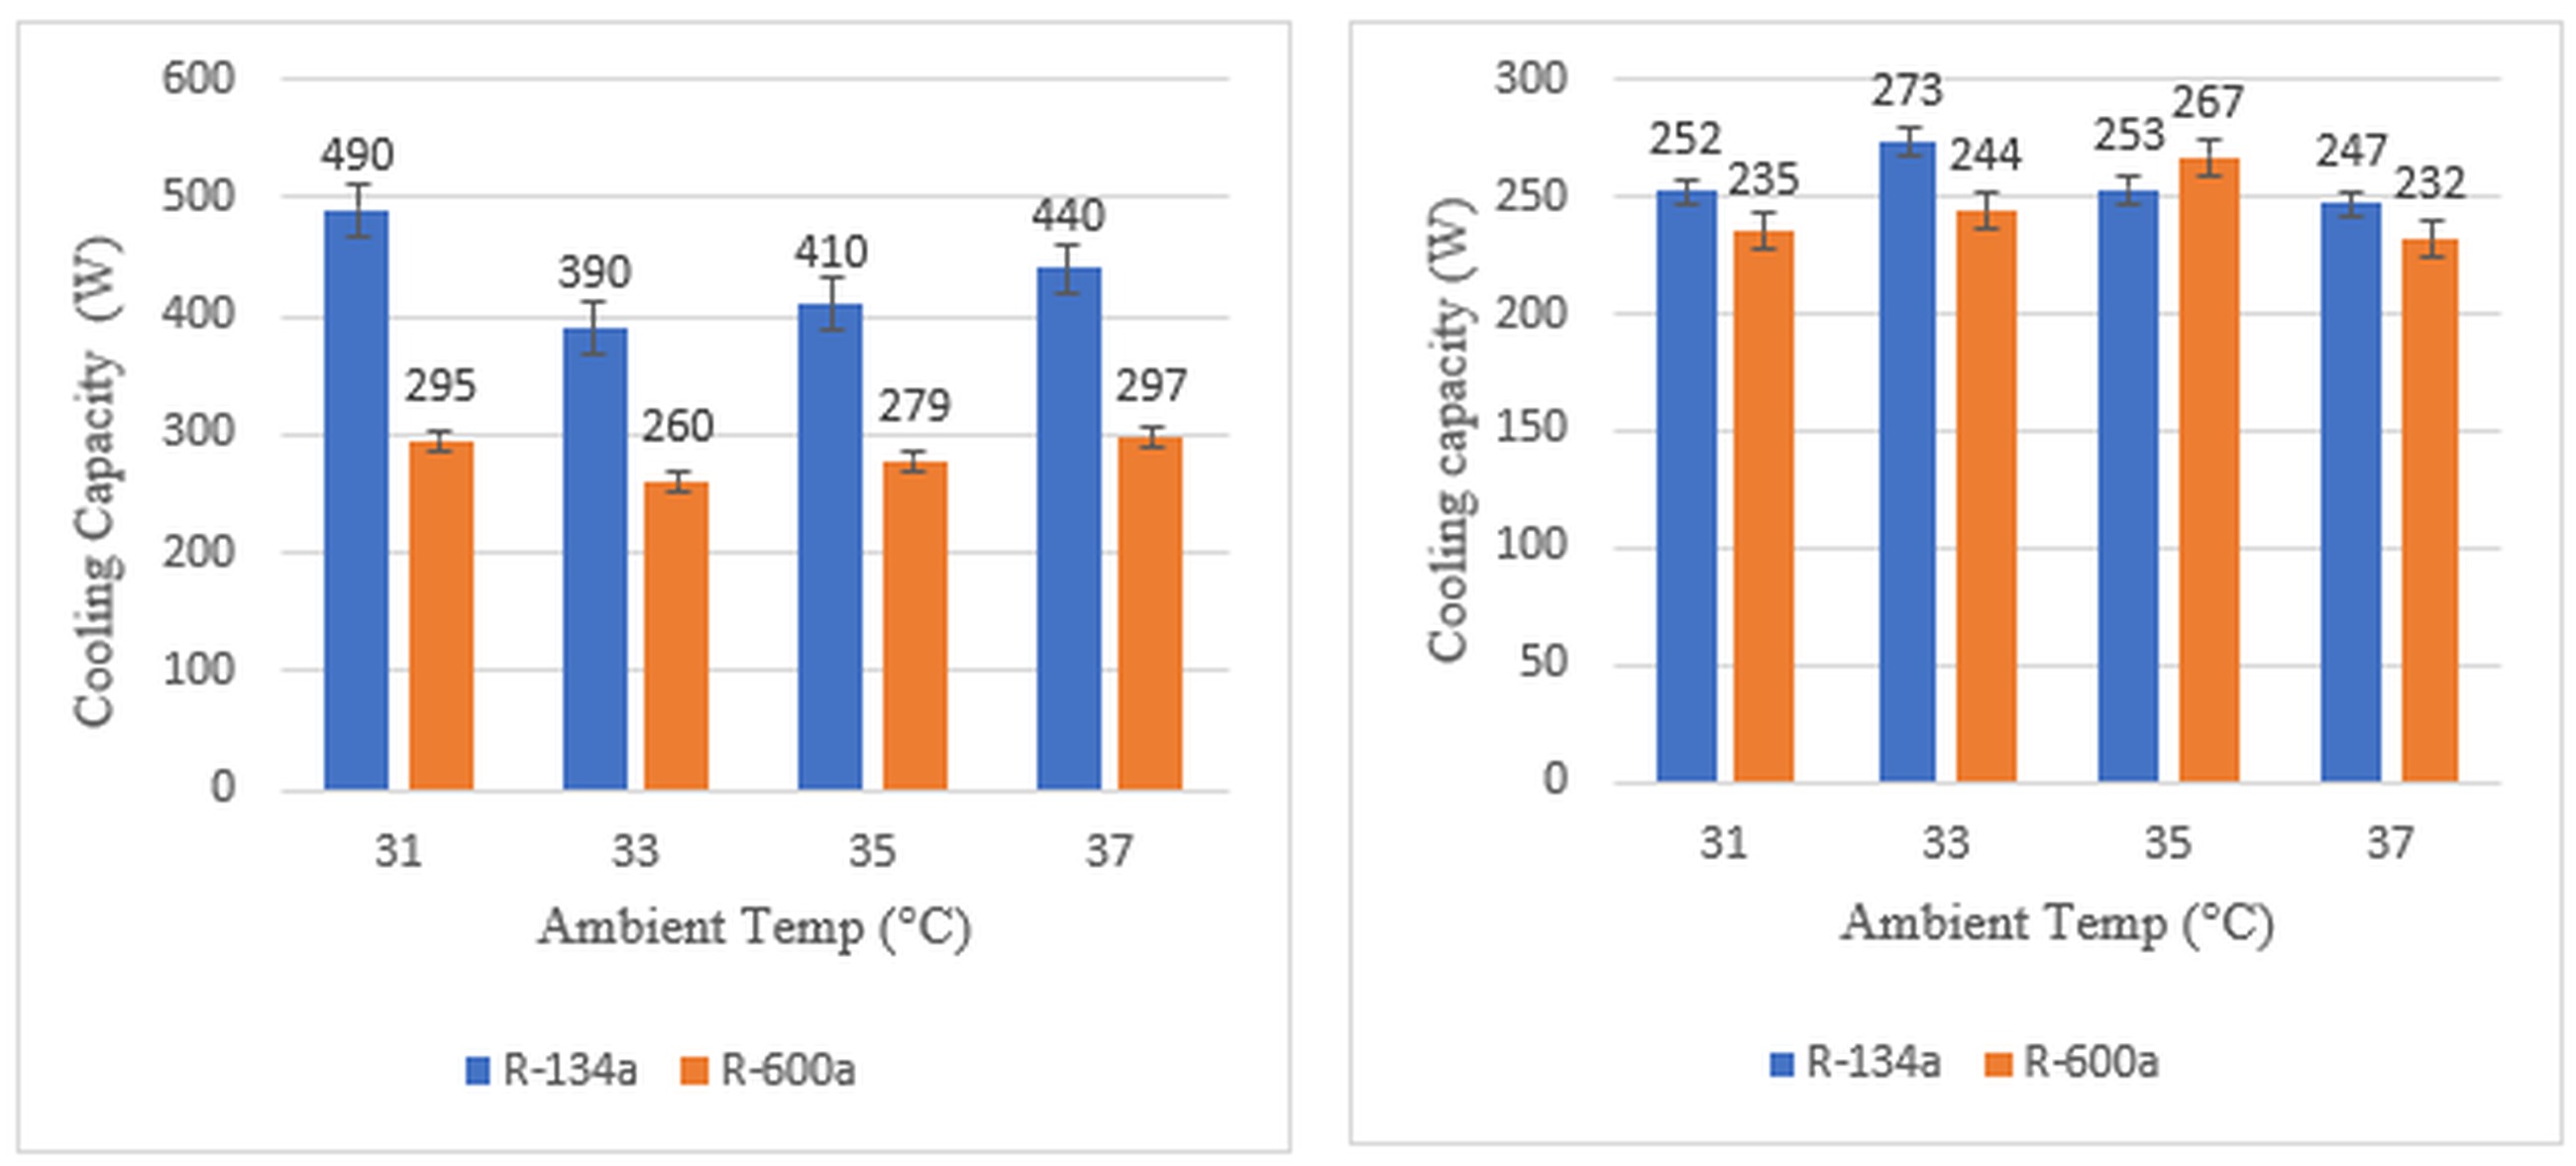
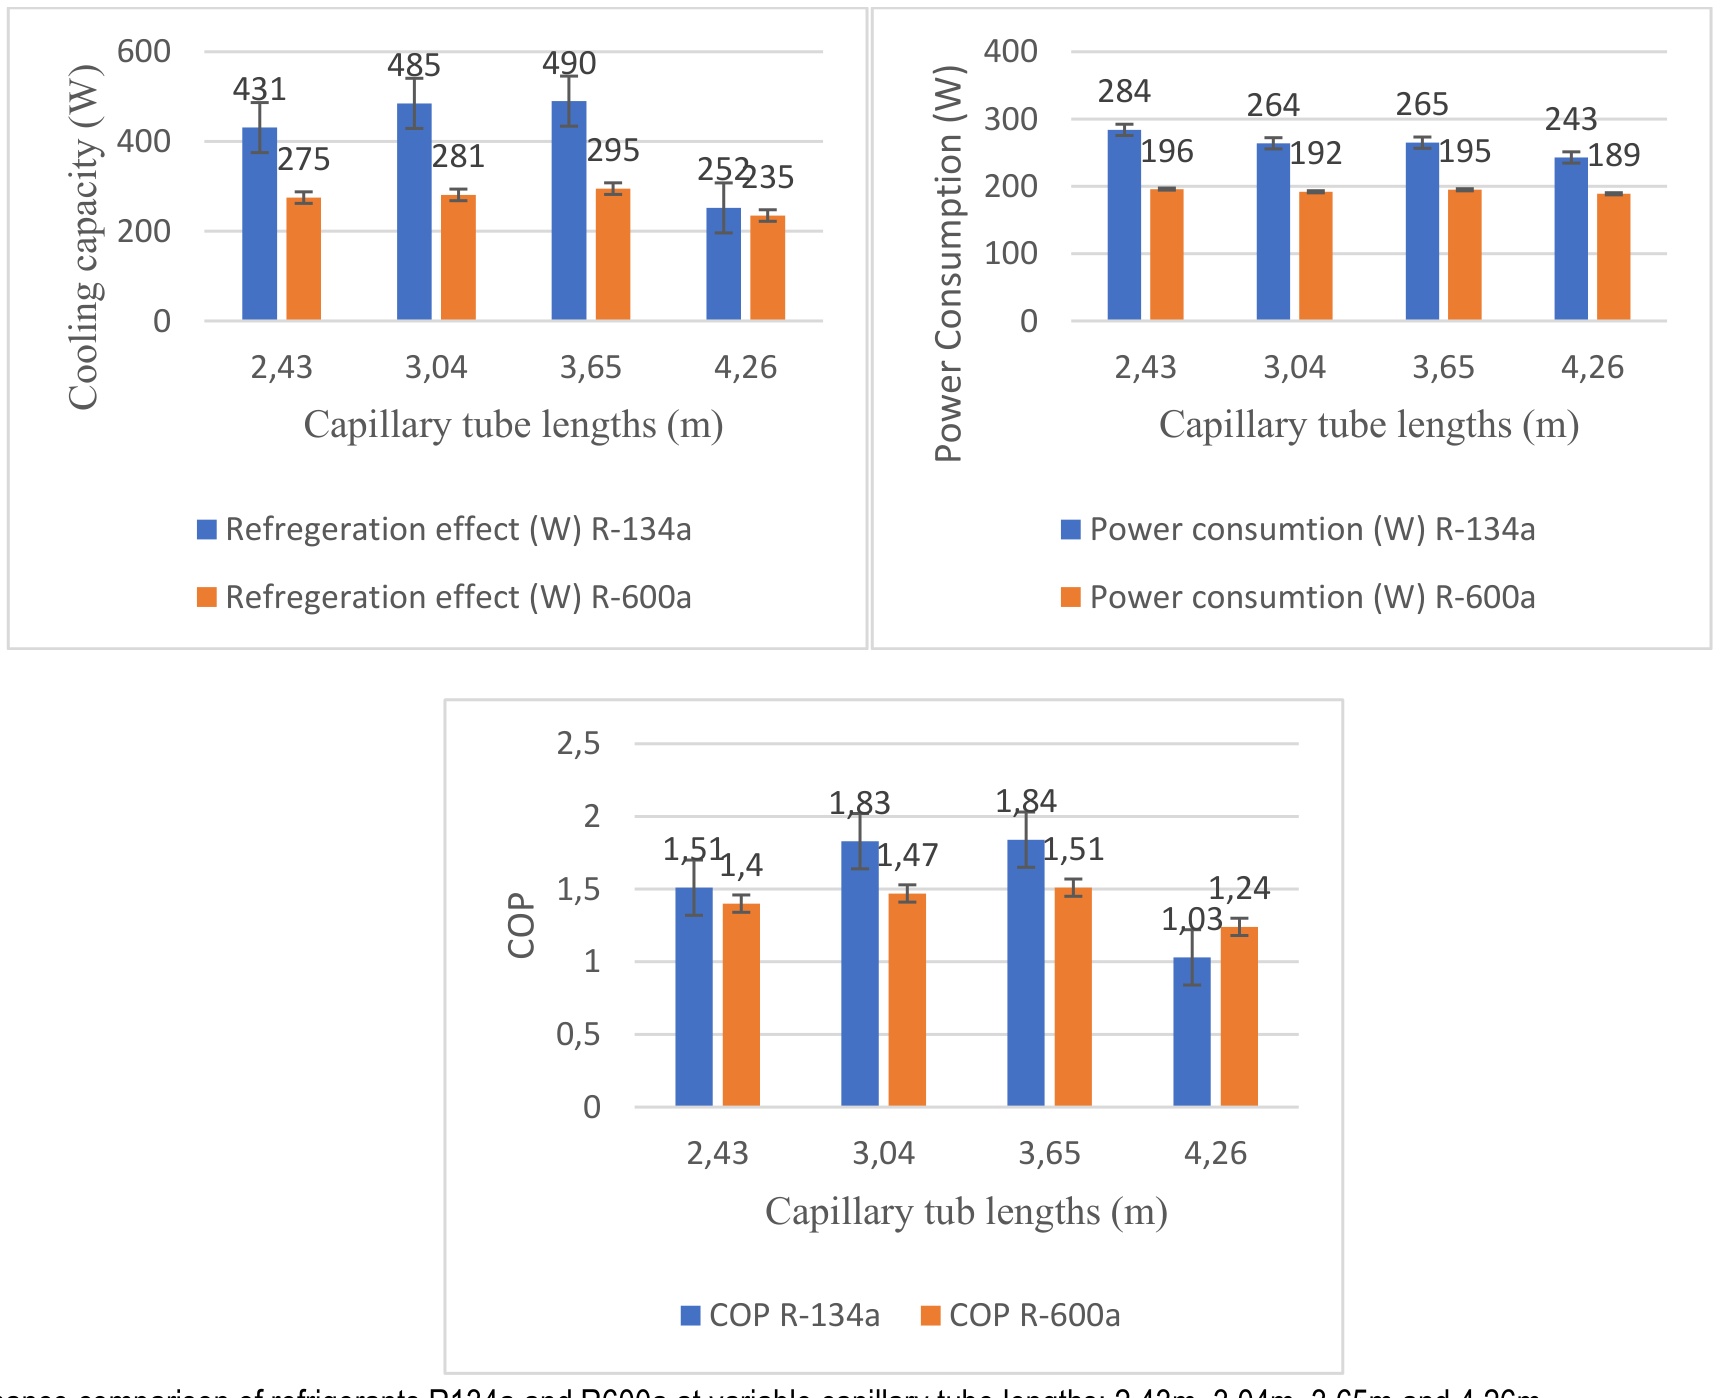
Figure 4 compares the cooling capacity of refrigerants R-134a and R-600a across varying capillary tube lengths and ambient temperatures in a vapor compression refrigeration system. The cooling capacity, representing the cooling capacity, is consistently higher for R-134a under all tested conditions. For instance, at 31°C with an 2.43m capillary tube, R-134a achieves 431 W compared to 275 W for R-600a; at 3.65m and the same temperature, R-134a provides 490 W while R-600a yields 295 W. This superior performance is likely due to R-134a’s favourable thermodynamic properties, such as higher latent heat of vaporization, enabling it to absorb and transfer more heat during evaporation.
R-600a is a natural low-environmental-impact refrigerant, though it has a smaller cooling capacity; thus, it can be considered as an environmentally friendly substitute for R-134a. R-134a has a higher cooling capacity, yet energy efficiency, safety, and sustainability must be put into consideration. Capillary tube length and refrigerant charge are the other influencing parameters in system design. The figure therefore indicates that a trade-off between higher cooling capacity with R-134a and the environmental benefits of R-600a must be considered when selecting the refrigerant for specific applications.
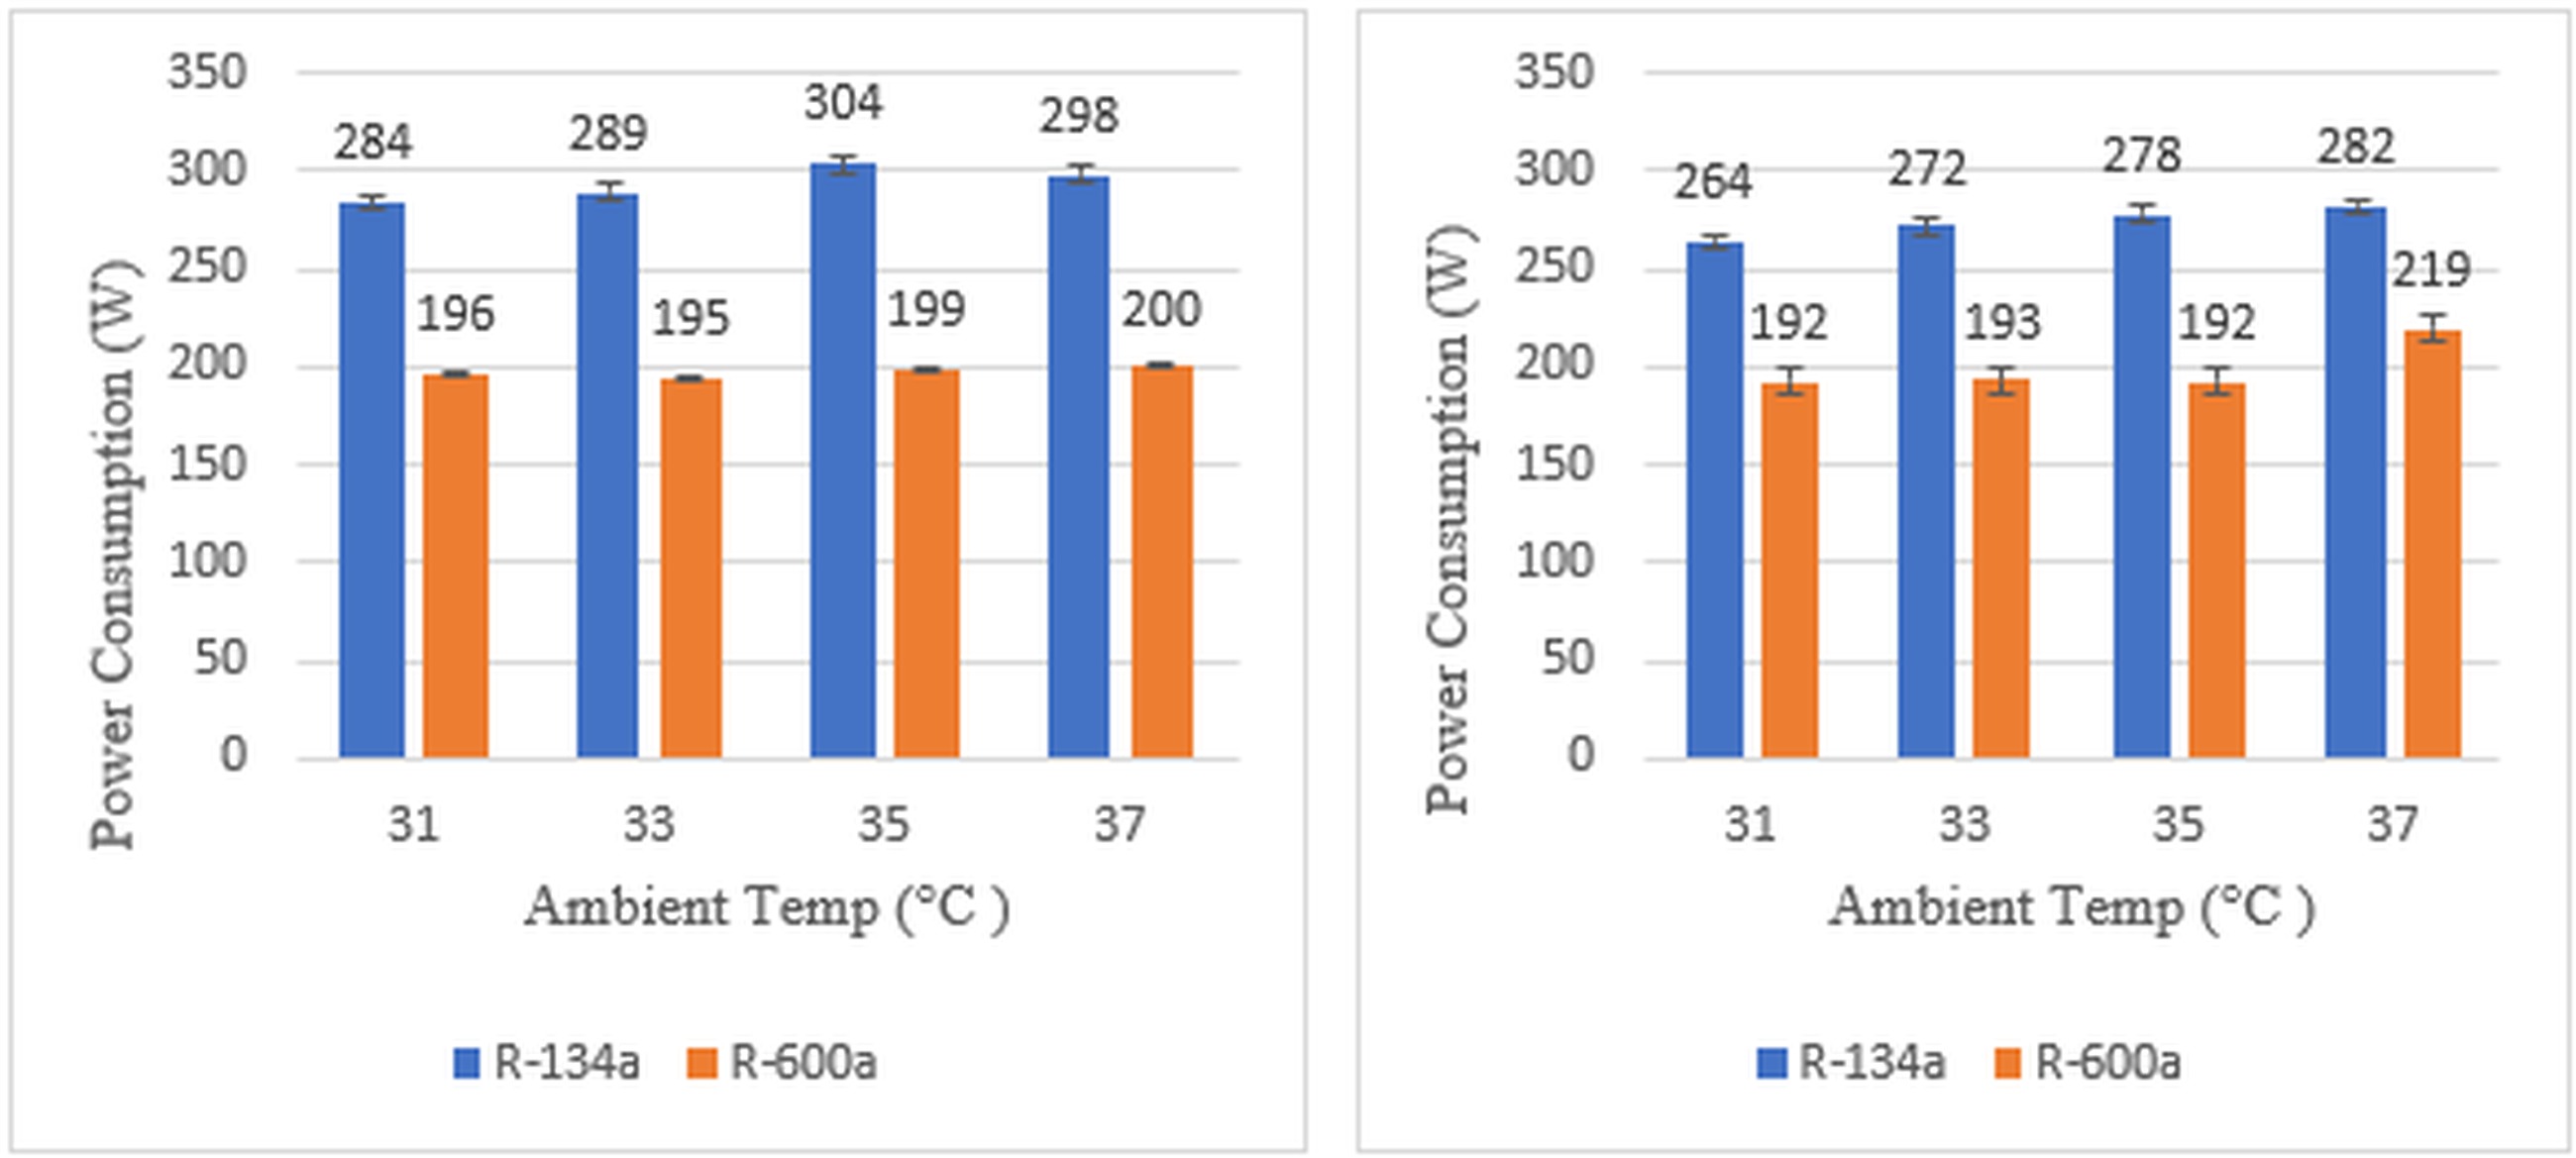
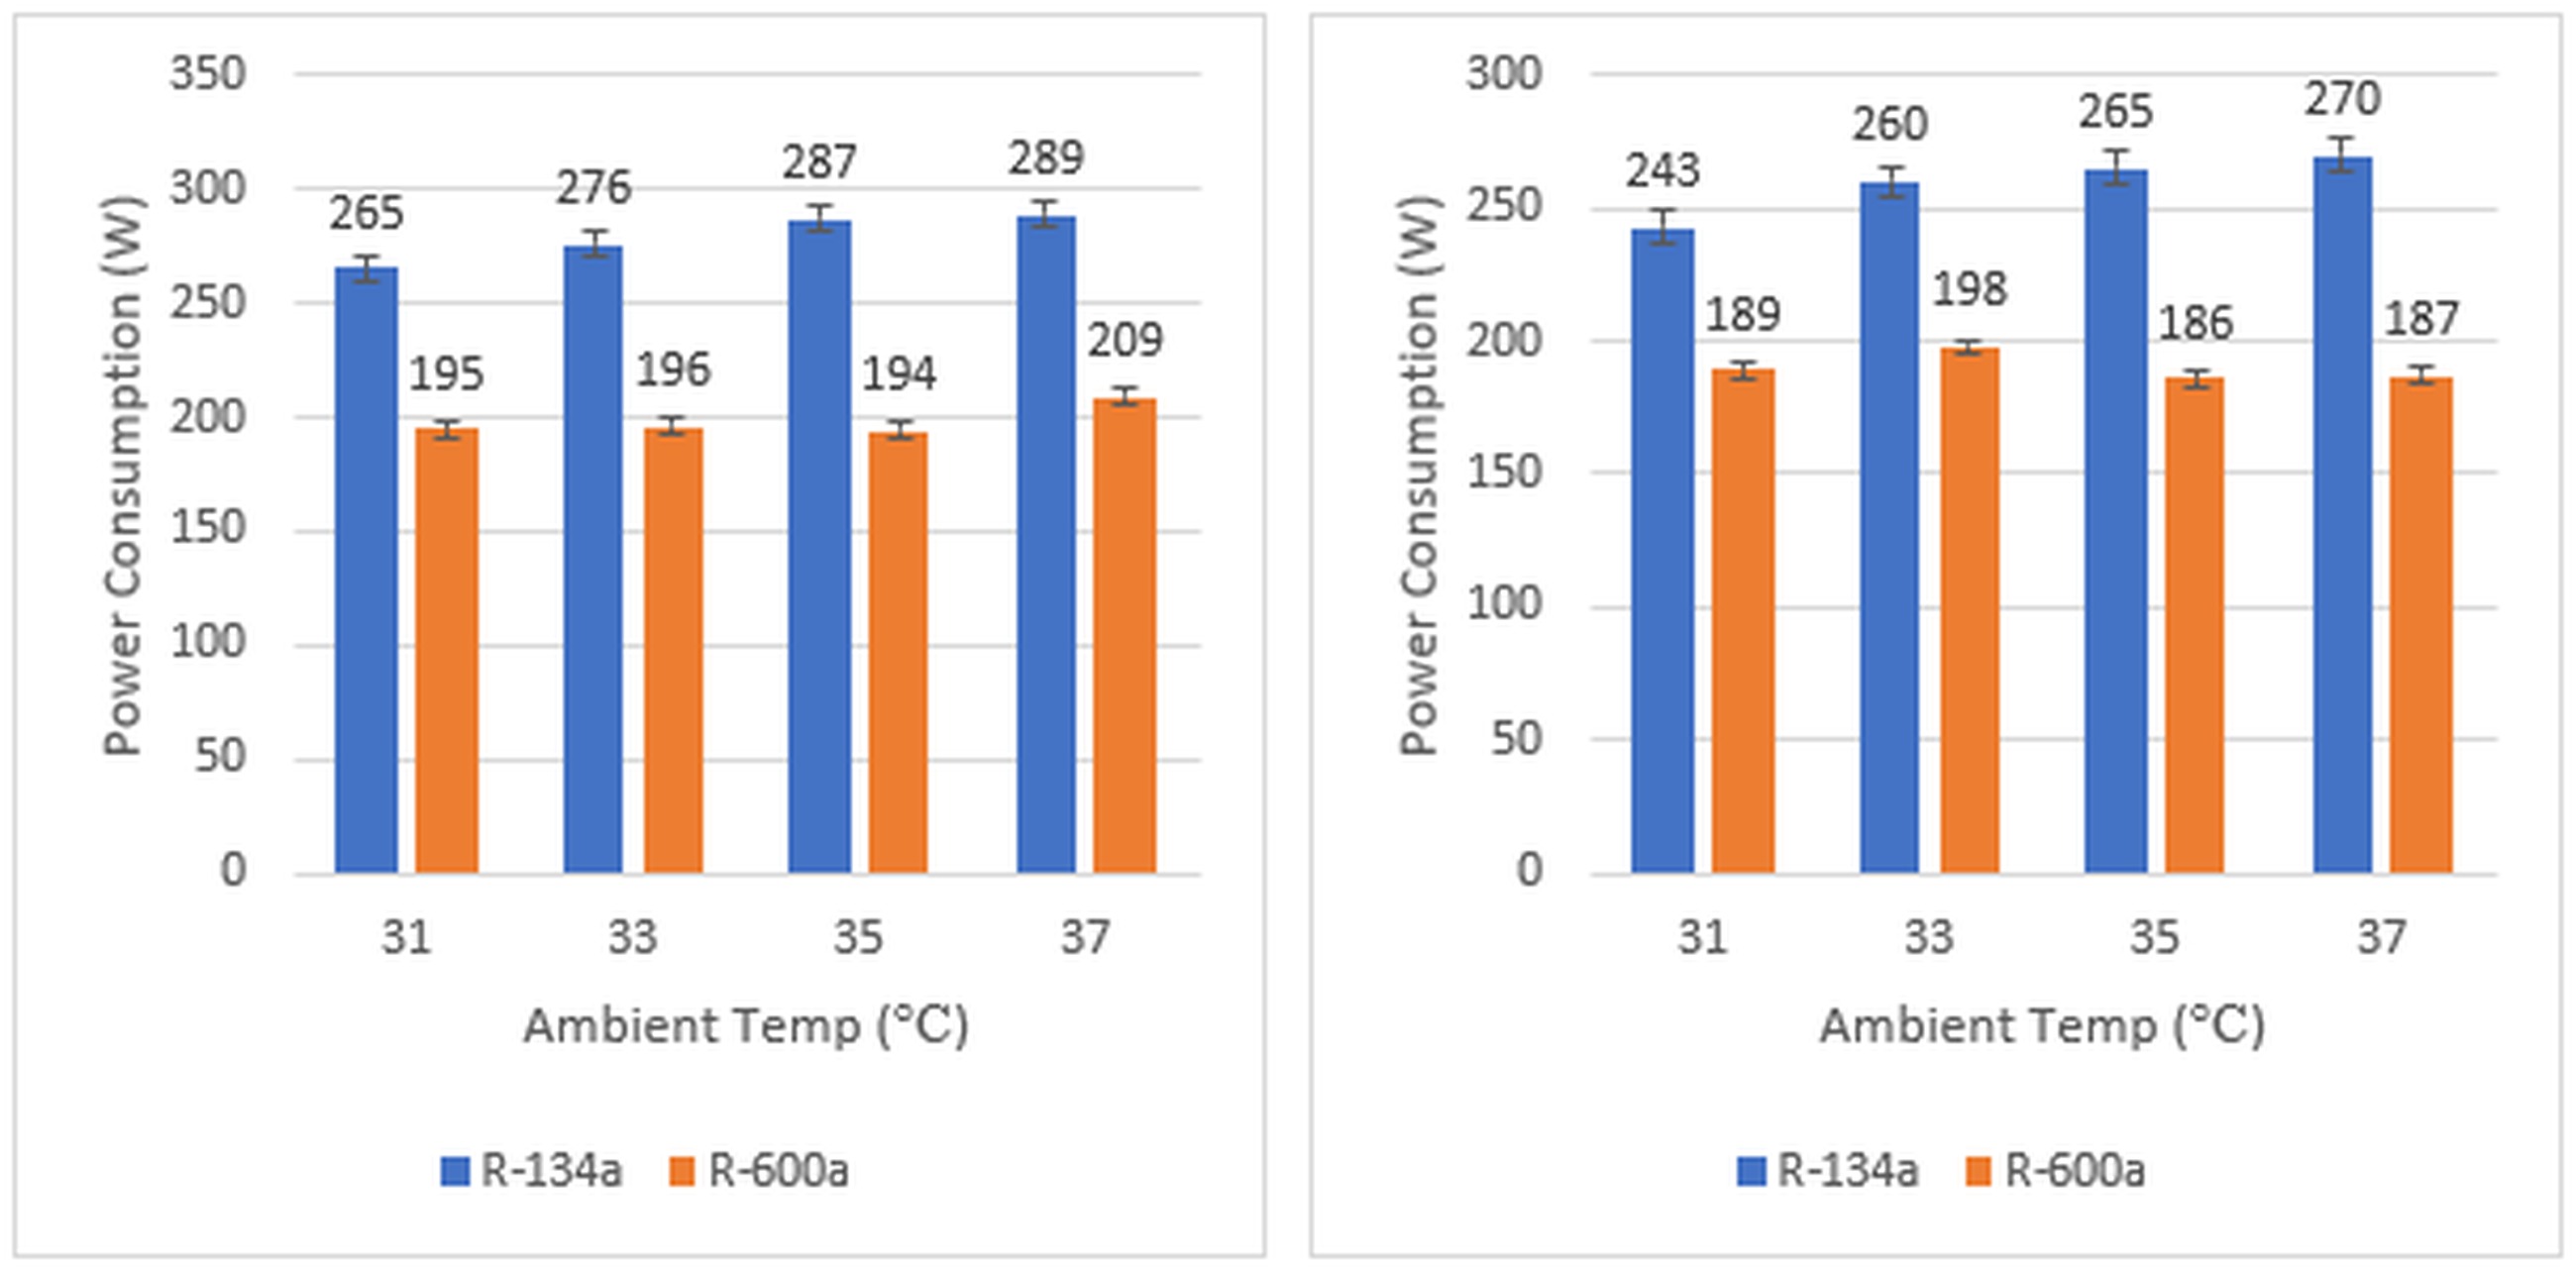
Figure 5 shows, in terms of power consumption, R-600a consistently consumes less energy than R134a, making it more energy-efficient. At 3.04m and 35°C, R-600a consumes 192 W compared to R134a's 278 W. At 4.26m and 31°C, R600a's power usage is 189 W, significantly lower than R134a's 243W.
The COP is exactly interpersonal to the desired effect produced and indirectly relative to power provided to the compressor, Figure 6 shows COP, R600a exhibits better or comparable performance at most conditions, particularly at higher ambient temperatures and longer capillary tube lengths. For example, at 4.26m and 35°C, R600a achieves a COP of 1.43, outperforming R134a's 0.95. However, at lower temperatures and shorter capillary lengths, R134a often shows higher COP values, such as at 3.04m and 31°C, where it records a COP of 1.83 against R600a's 1.47. R134a has typically got greater refrigeration capacity compared to R600a, but R600a's better efficiency makes it look a considerably more attractive solution for several software. This is proof that the increased of capillary tube length led to reduce in COP but very slightly for both coolents. Nevertheless, R-600a still outperforms it in terms of efficiency along all tube lengths.
Tab. 4
Cooling capacity produced, power consumption and COP of the VCR System at variable ambient conditions and at variable capillary tube lengths
(a) Capillary tube length-2.43m (b) Capillary tube length-3.04m
(c) Capillary tube length-3.65m (d) Capillary tube length-4.26m
Fig. 4. Cooling capacity p roduced in Watts f or the capillary length of: (a) 2.43m (b) 3.04m (c) 3.65m and (d) 4.26m
(a) Capillary tube length- 2.43m (b) Capillary tube length-3.04m
(c) Capillary tube length-3.65m (d) Capillary tube length-4.26m
Fig. 5. Power consumption in Watts f or the capillary length of: (a) 2.43m (b) 3.04m (c) 3.65m and (d) 4.26m
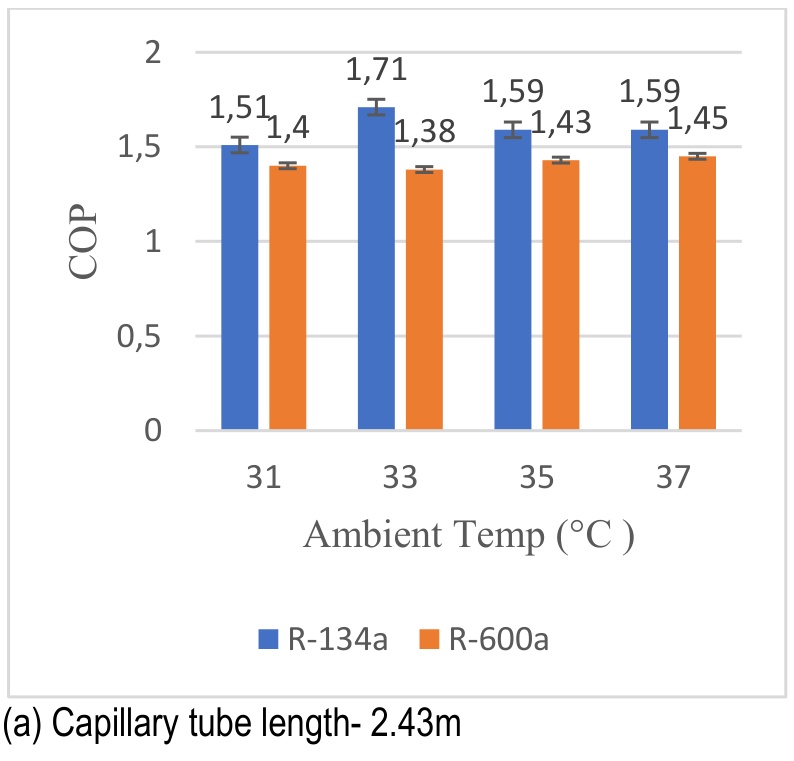
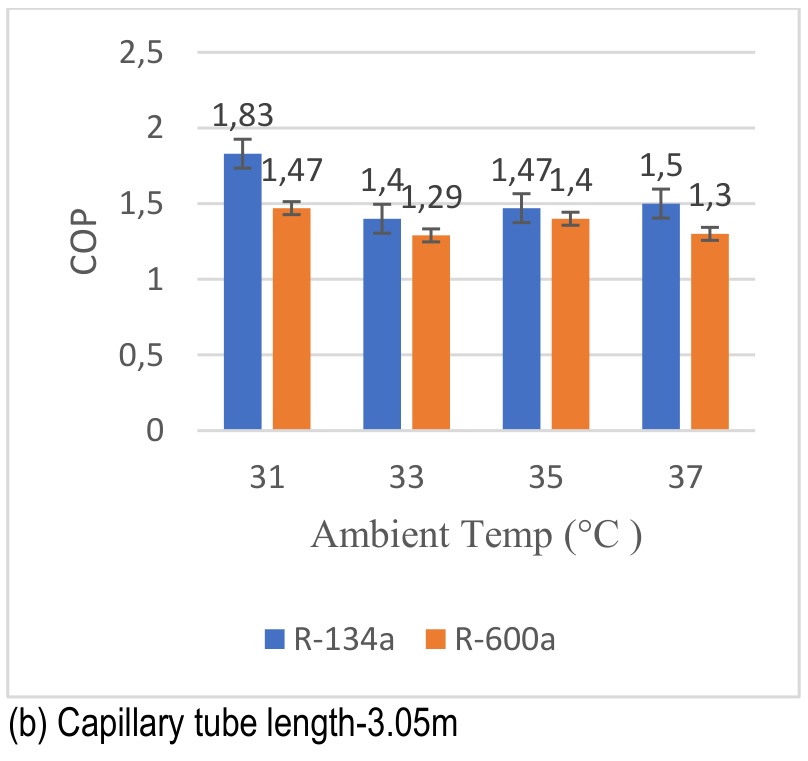
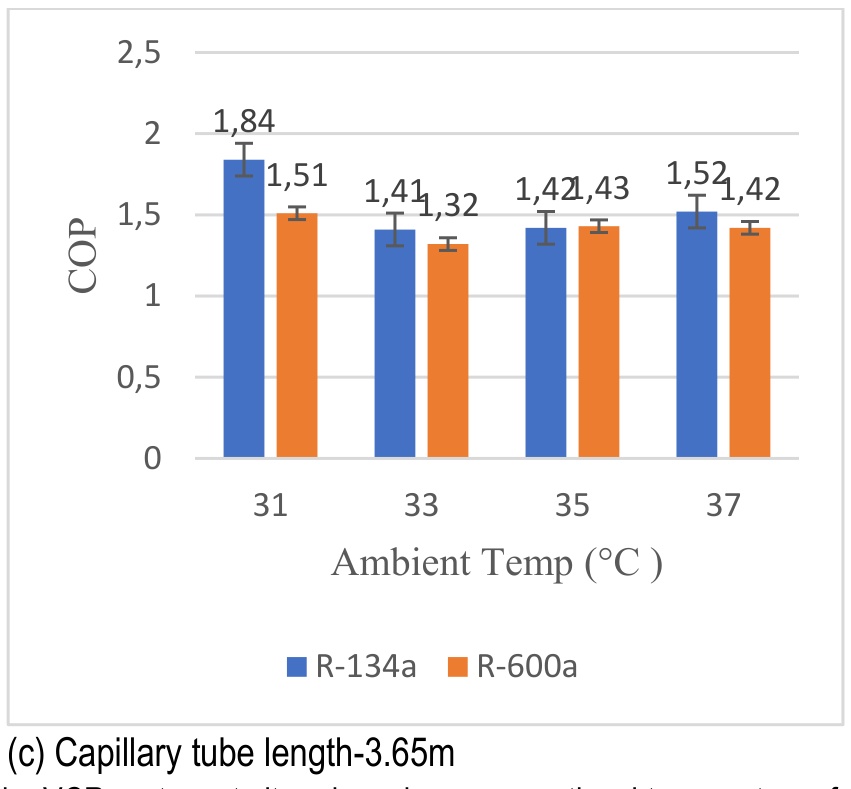
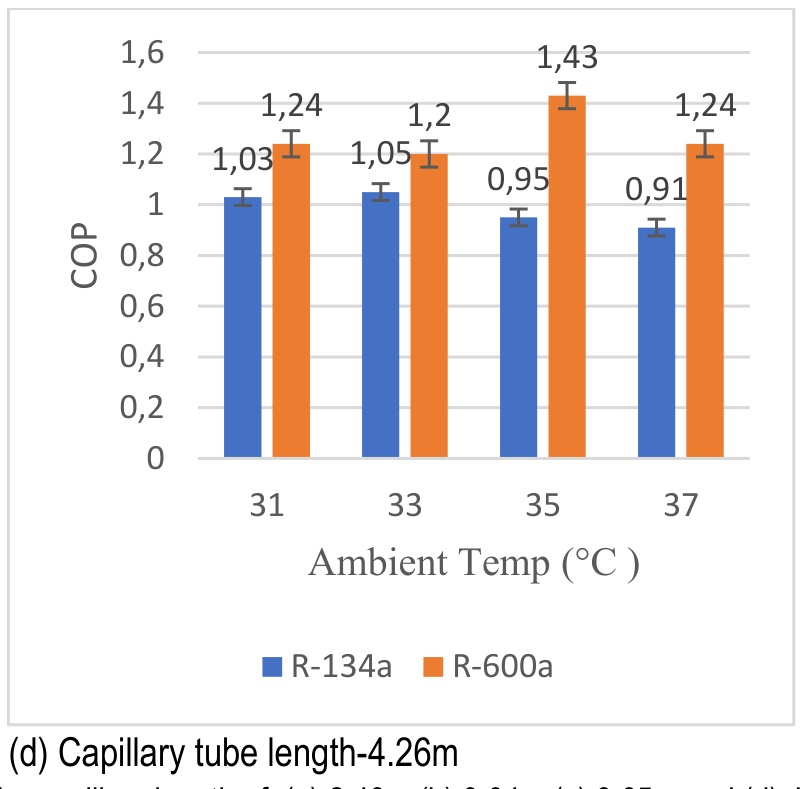
Fig. 6. COP of the VCR system at altered condenser operational temperatures for the capillary length of: (a) 2.43m (b) 3.04m (c) 3.65m and (d) 4.26m
R-134a yields higher COP values than R-600a over the range of capillary tube length and ambient temperature tested. versus R-600a for shorter capillary tube lengths (2.43m and 3.04m). However, at a length of capillary tube of 4.26m, the performance of R-600a is better at higher ambient temperatures 35°C and 37°C. This suggests that R-600a, however, may be more efficient in certain applications, which illustrates the importance of choosing the right coolent and system configuration according to operating conditions. The comparative study of R134a and R600a is shown in Fig 7.
Conclusions
It is seen that the performance difference between R-134a and R-600a depends on tube length and ambient temperature clearly. For the shorter capillaries, 2.43 m and 3.65 m, the COP of R-134a is always higher, providing a gain in efficiency in the range of 7.86% to 24.49% compared to R-600a. When the capillary length is 3.04 m, the better performance of R-134a at lower ambient temperatures yields to the competitive performance exhibited by R-600a as the temperature increases. A marked reversal is observed for the longest capillary length of 4.26 m, where R-600a outperforms R-134a, especially at the two highest ambient temperatures of 35 °C and 37 °C, with large COP gains of 50.53% and 36.26%, respectively. These trends highlight how closely the refrigerant’s thermophysical properties, the capillary tube’s geometry, and the operating conditions are linked. They also show that choosing the right refrigerant–capillary combination is essential for achieving the best possible system efficiency.
Discussion And Comparison With Literature
The experiments showed that R600a performs better than both R134a and the R134a–R600a blend, with the advantage becoming more noticeable at longer capillary lengths and higher ambient temperatures. This can be attributed to the fact that with lower density, R600a would provide a more optimum mass flow rate through long capillaries where frictional pressure losses are high. Its higher latent heat of vaporization further increases the cooling capacity even with reduced mass flow, and the system will then operate at lower evaporator temperatures and higher COPs under higher ambient conditions. On the other hand, R134a’s higher density and lower latent heat of vaporization restrict its performance to increased capillary lengths; the former causes underfeeding of the evaporator, a loss in cooling capacity, and higher power consumption of the compressor. The behavior of the mixture lies in between due to the fact that the presence of R600a lowers the discharge pressure and increases the heat absorbed; however, its non-azeotropic temperature glide limits the overall improvement.
These results are in good agreement with the literature, which has consistently demonstrated that R600a yields better thermodynamic performance and lower discharge temperatures whenever appropriately sized capillaries have been used. The same conclusions have also been obtained in related work by Mohanraj, Wongwises, and Bolaji, who identified R600a as a higher efficiency alternative to R134a, especially when applied in systems optimized based on capillary flow characteristics. However, the present results show only moderate improvements for the R134a/R600a blend when compared to some earlier reports, a discrepancy that is likely due to differences in blend ratio, system charge optimization, or capillary geometry. Overall, the performance trends observed strongly support the conclusion that R600a was the best-performing refrigerant within the conditions tested, although it also underlined the important role played by capillary design and refrigerant properties in the determination of system efficiency.