
Introduction
Contemporary research [1-13] on gearbox fault diagnosis focuses on multisensory measurements [1], spectral analysis [13, 14], wavelet techniques [4, 12], the development of compound methods and algorithms [12], feature fusion [3, 14], filter applications [5], probabilistic approaches [3, 6], adaptive stochastic resonance [7], angular position identification [8], spectral coherence [10], and other techniques aimed at ensuring the reliable operation of rotating machinery. Although gearbox diagnostics has a long history of methodological development, effective diagnostic approaches dedicated specifically to cycloidal gear trains remain limited [3, 4, 14-16].
In this article, the investigation of various spectral- and wavelet-based fault diagnosis methods led to the assumption that the defect geometry proposed in [4] induces spectral scattering. This phenomenon can be quantified using spectral entropy. A similar approach was presented in [15], where the authors concluded that defects in cycloidal discs influence the vibration spectrum. In particular, harmonic peaks accompanied by sidebands were observed and identified as potential diagnostic features.
In study [15], a rotation vector (RV) gearbox – comprising both a planetary stage and a cycloidal stage - was analyzed, and defects in the cycloidal disc were associated with distinct spectral peaks. In contrast, the present work focuses exclusively on a cycloidal gear reducer, without any additional stages. Attempts to extract diagnostic features using Morris Minimum Bandwidth Wavelets corresponding to specific harmonic frequencies – defined as the input shaft rotational frequency multiplied by the number of lobes or the number of pins in the pinwheel – were unsuccessful. Moreover, no clear pattern was observed in the vibration spectrum that could be directly associated with an increasing number of defects in the cycloidal disc.
Additionally, the analysis of the vibration signal envelope proved difficult to exploit, despite its successful application in distinguishing between a healthy cycloidal gearbox and one with a pin defect in [3].
Fault diagnosis attempts using Morris Minimum Bandwidth Wavelets [4], which have been widely applied in vibration signal analysis of rotating machinery also failed to reveal any consistent patterns that could support reliable defect identification.
The experimental data used for the investigation of fault diagnosis methods presented in this article were obtained from a laboratory test rig (Figure 1), consisting of: cycloidal gearbox with 16 external sleeves, 15 lobes, and 8 internal sleeves; two cycloidal discs; input and output shafts; a driving motor; a braking motor; and a torque measurement device. The measurement system was connected to National Instruments data acquisition cards interfaced with a notebook computer. An additional tachometer was used to measure the angular position of the cycloidal disc.
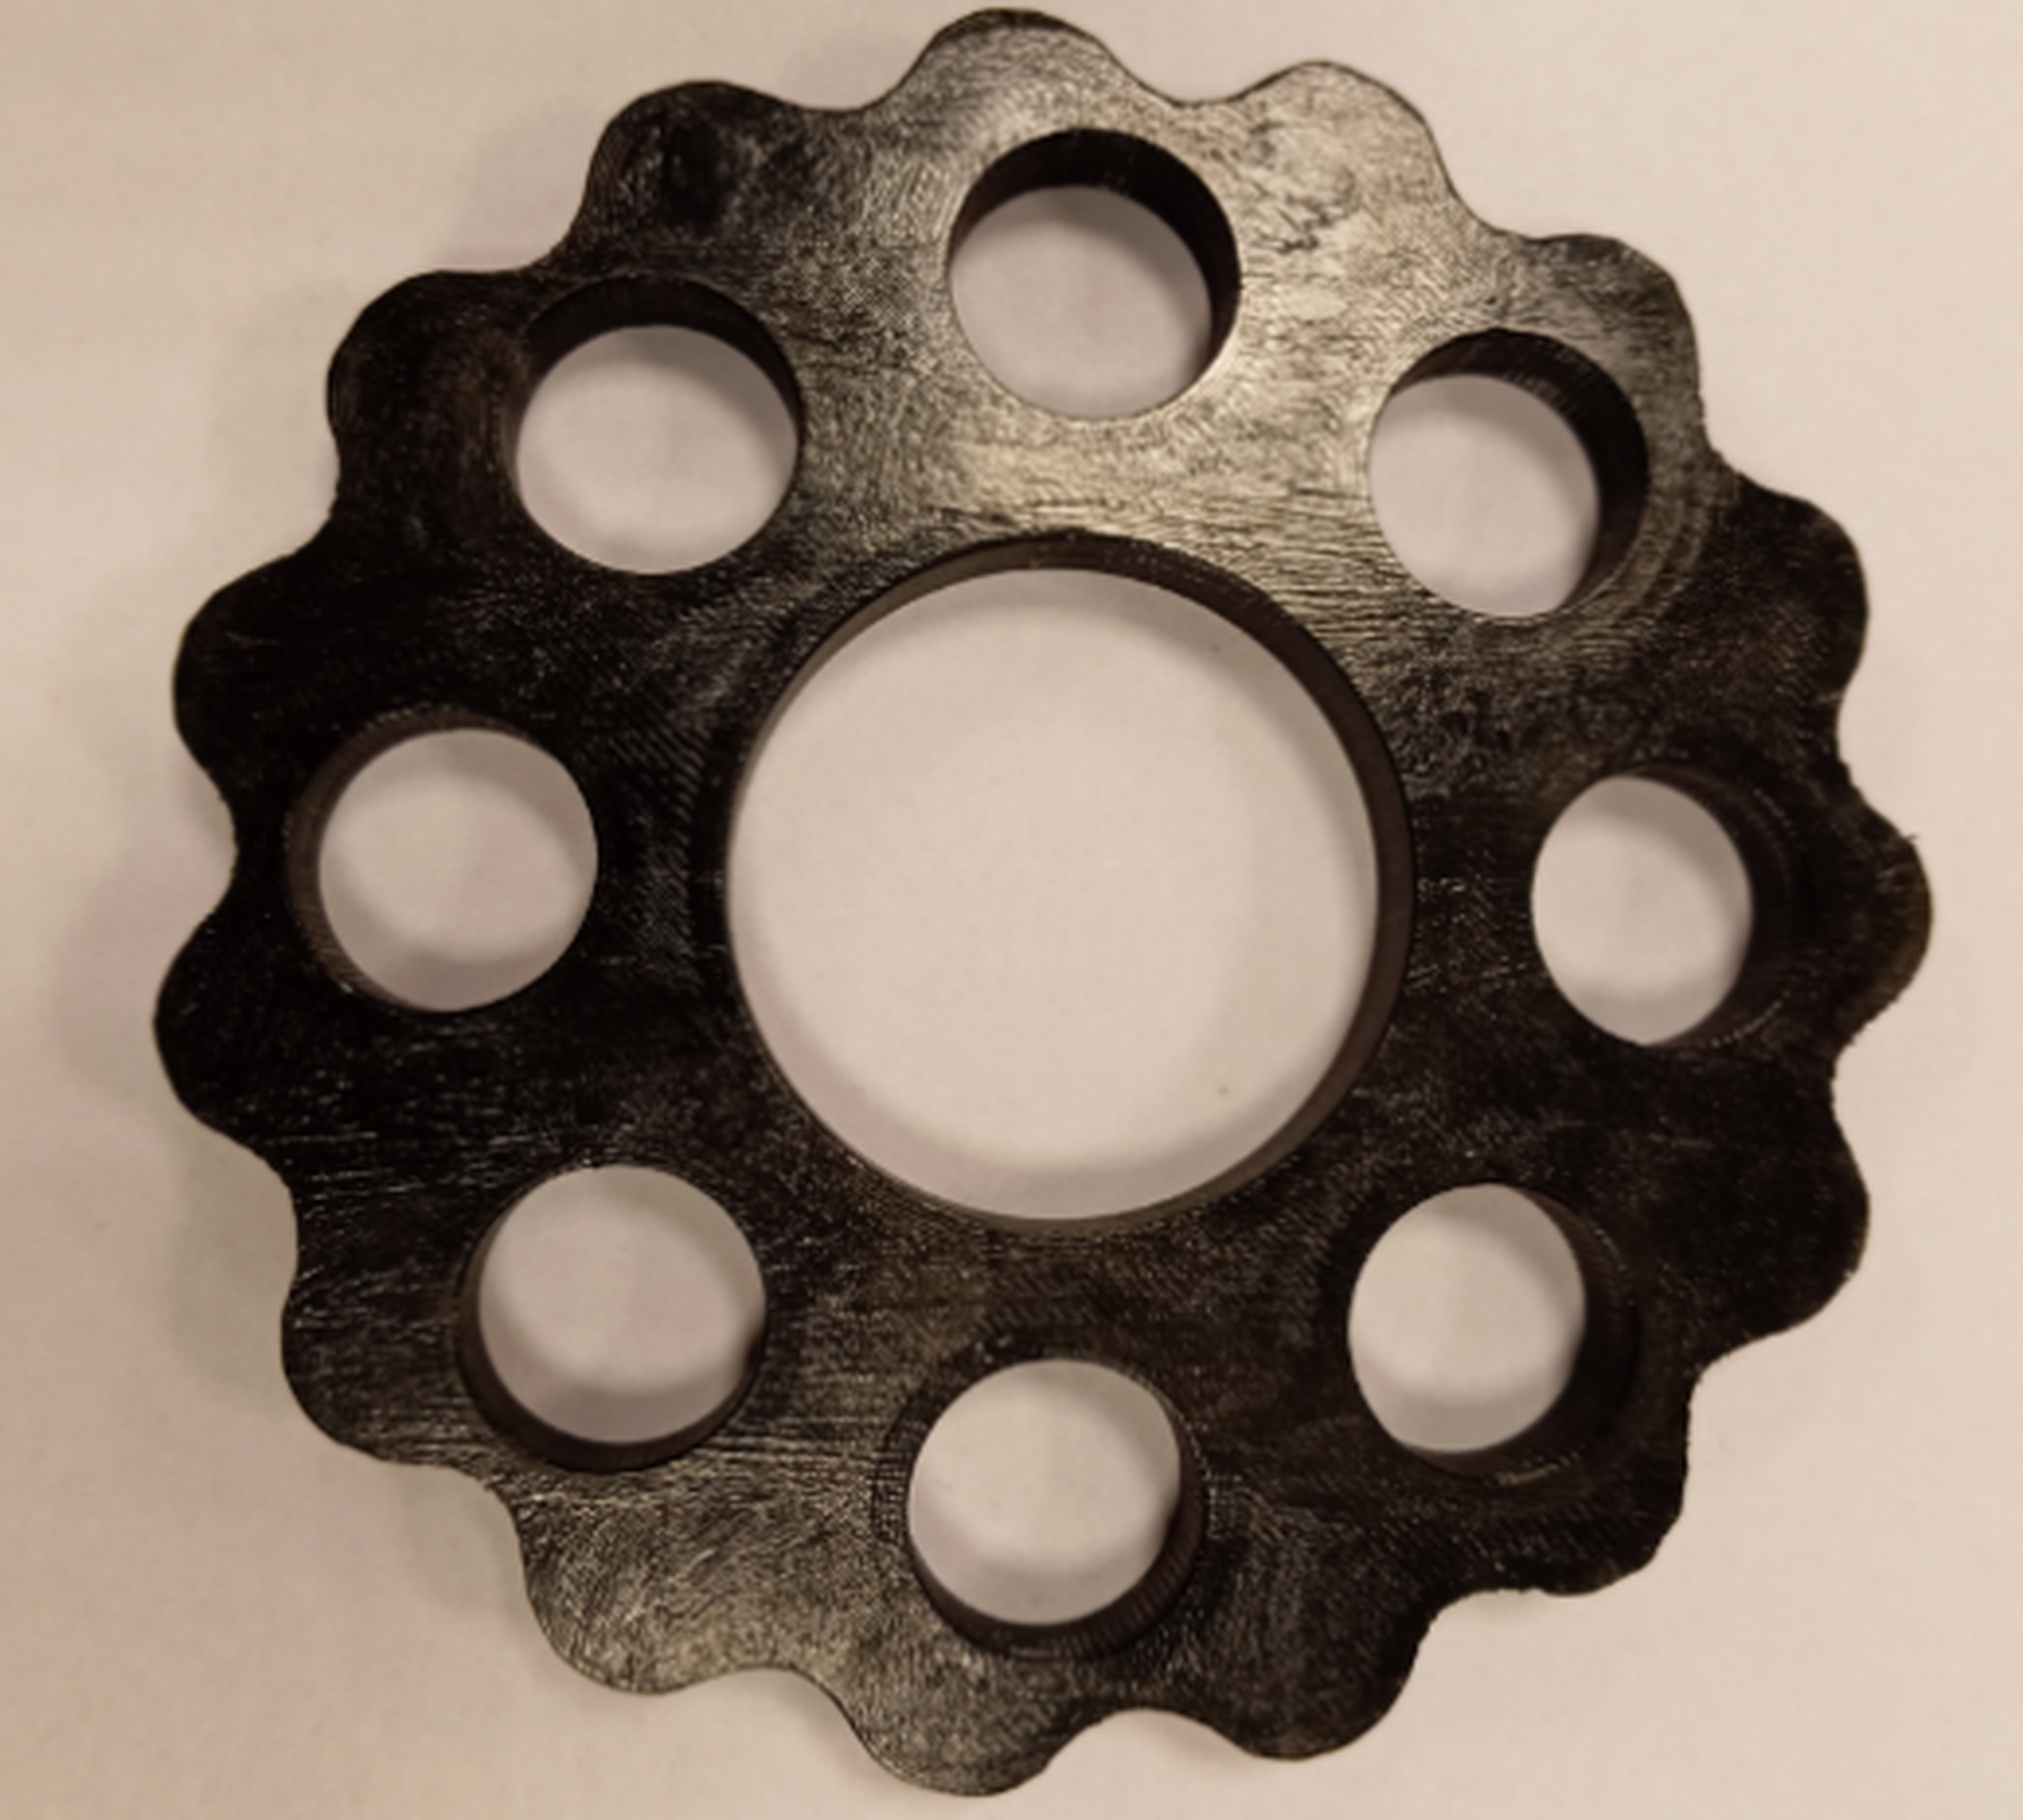
For each measurement, a cycloidal disc with a different number of defects was installed in the cycloidal gearbox. In total, eight cycloidal discs were manufactured using a 3D printer from ABS material. One disc was defect-free, while the remaining seven discs contained from one to seven defects, respectively. Representative examples of disc without the defects and a defective one are shown in Figures 2 and 3.
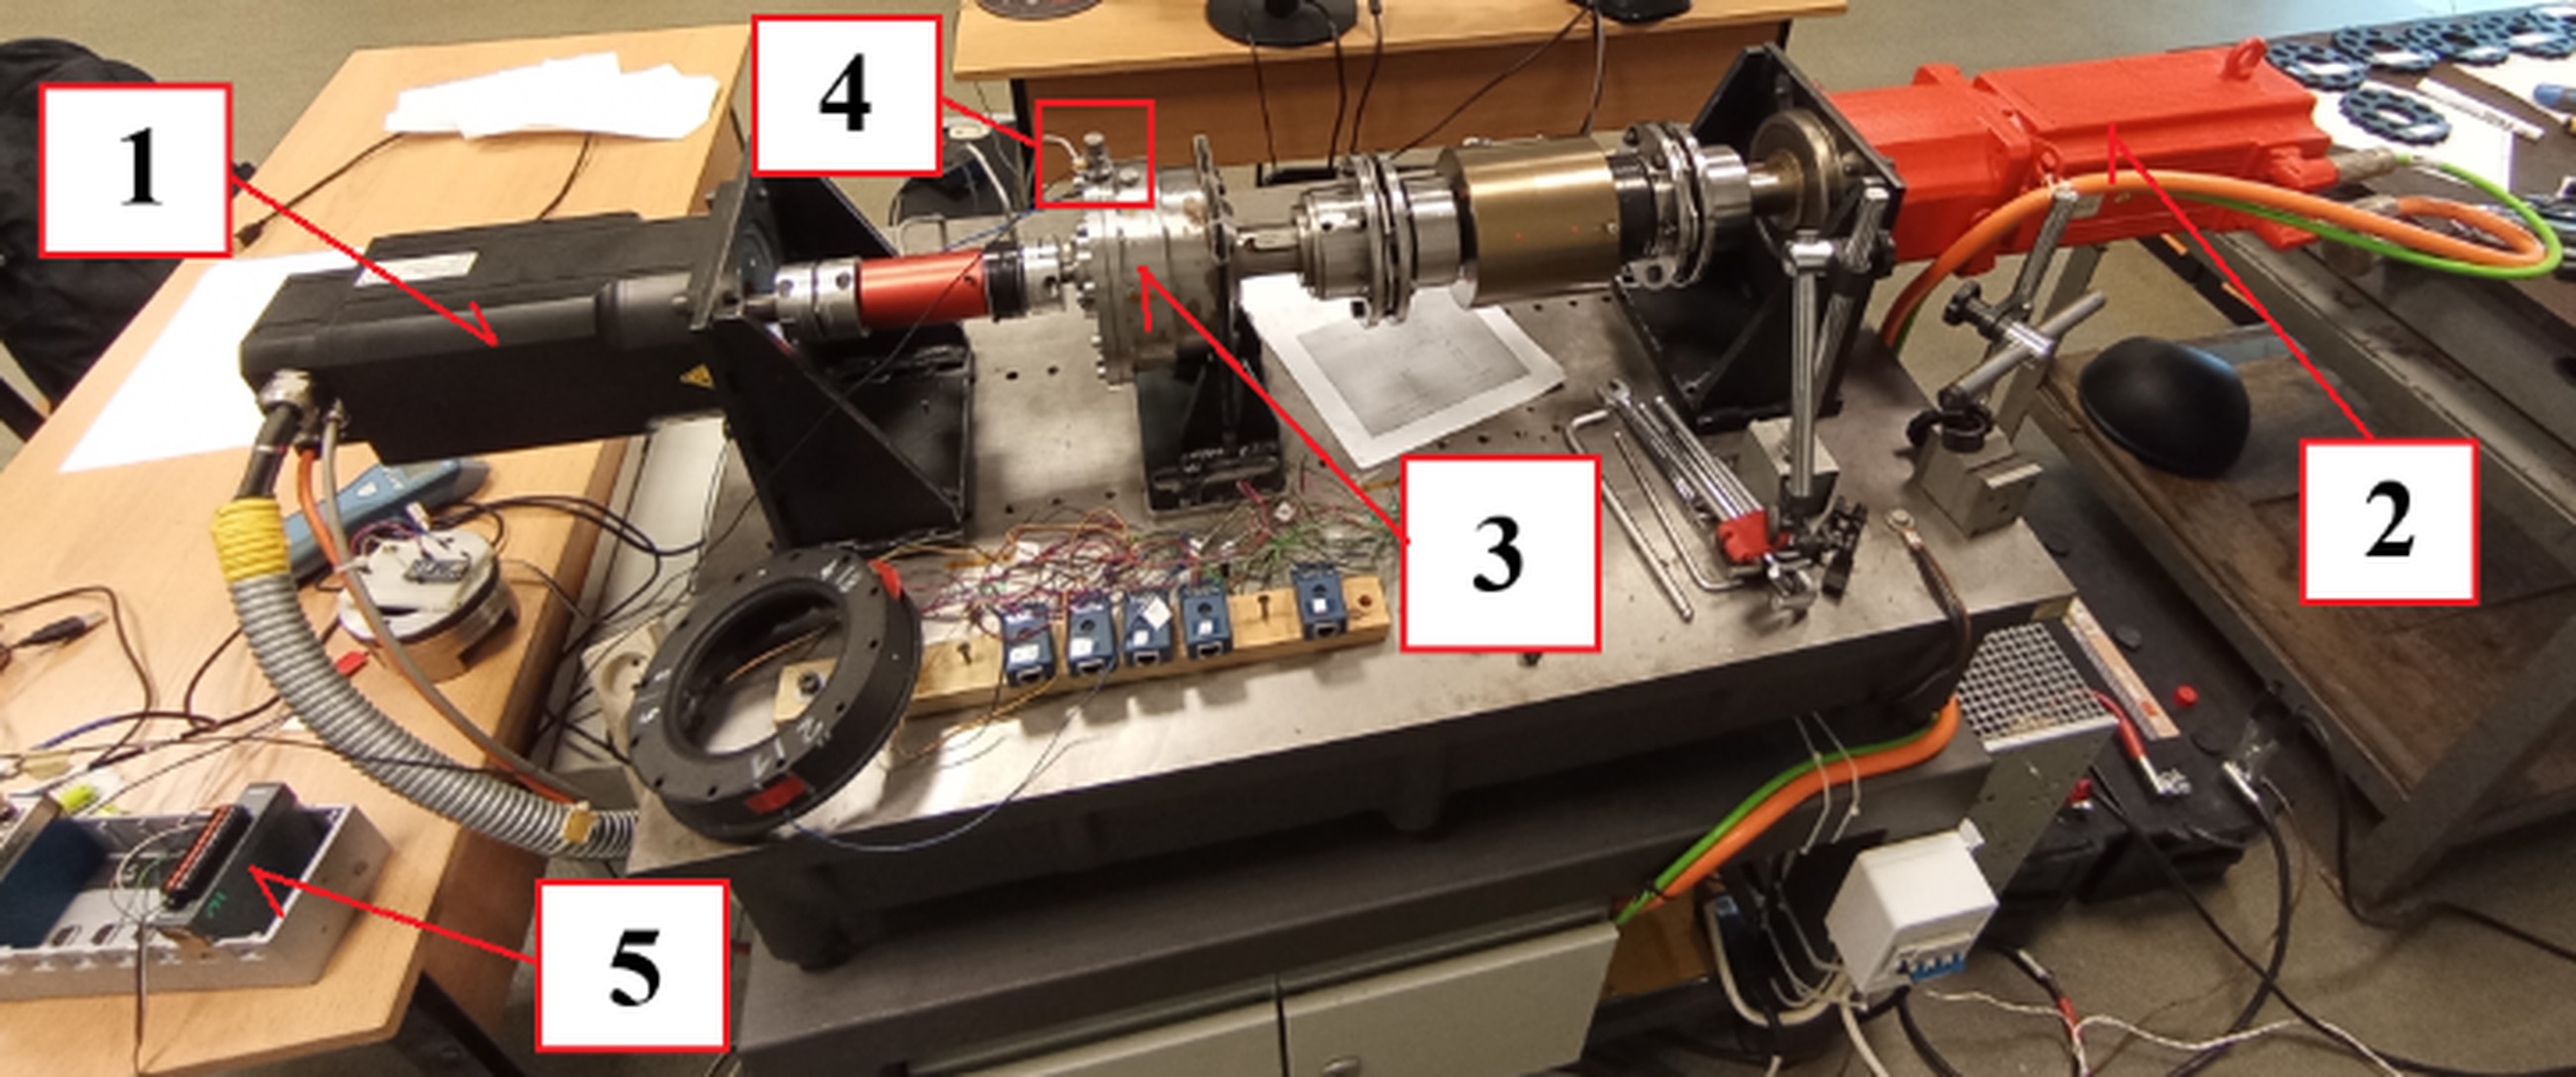
Fig. 1. Measurement rig. Driving motor (1), Braking motor (2), Cycloidal gearbox (3), Tachometer sensor (4), National Instruments data acquisition cards (5)
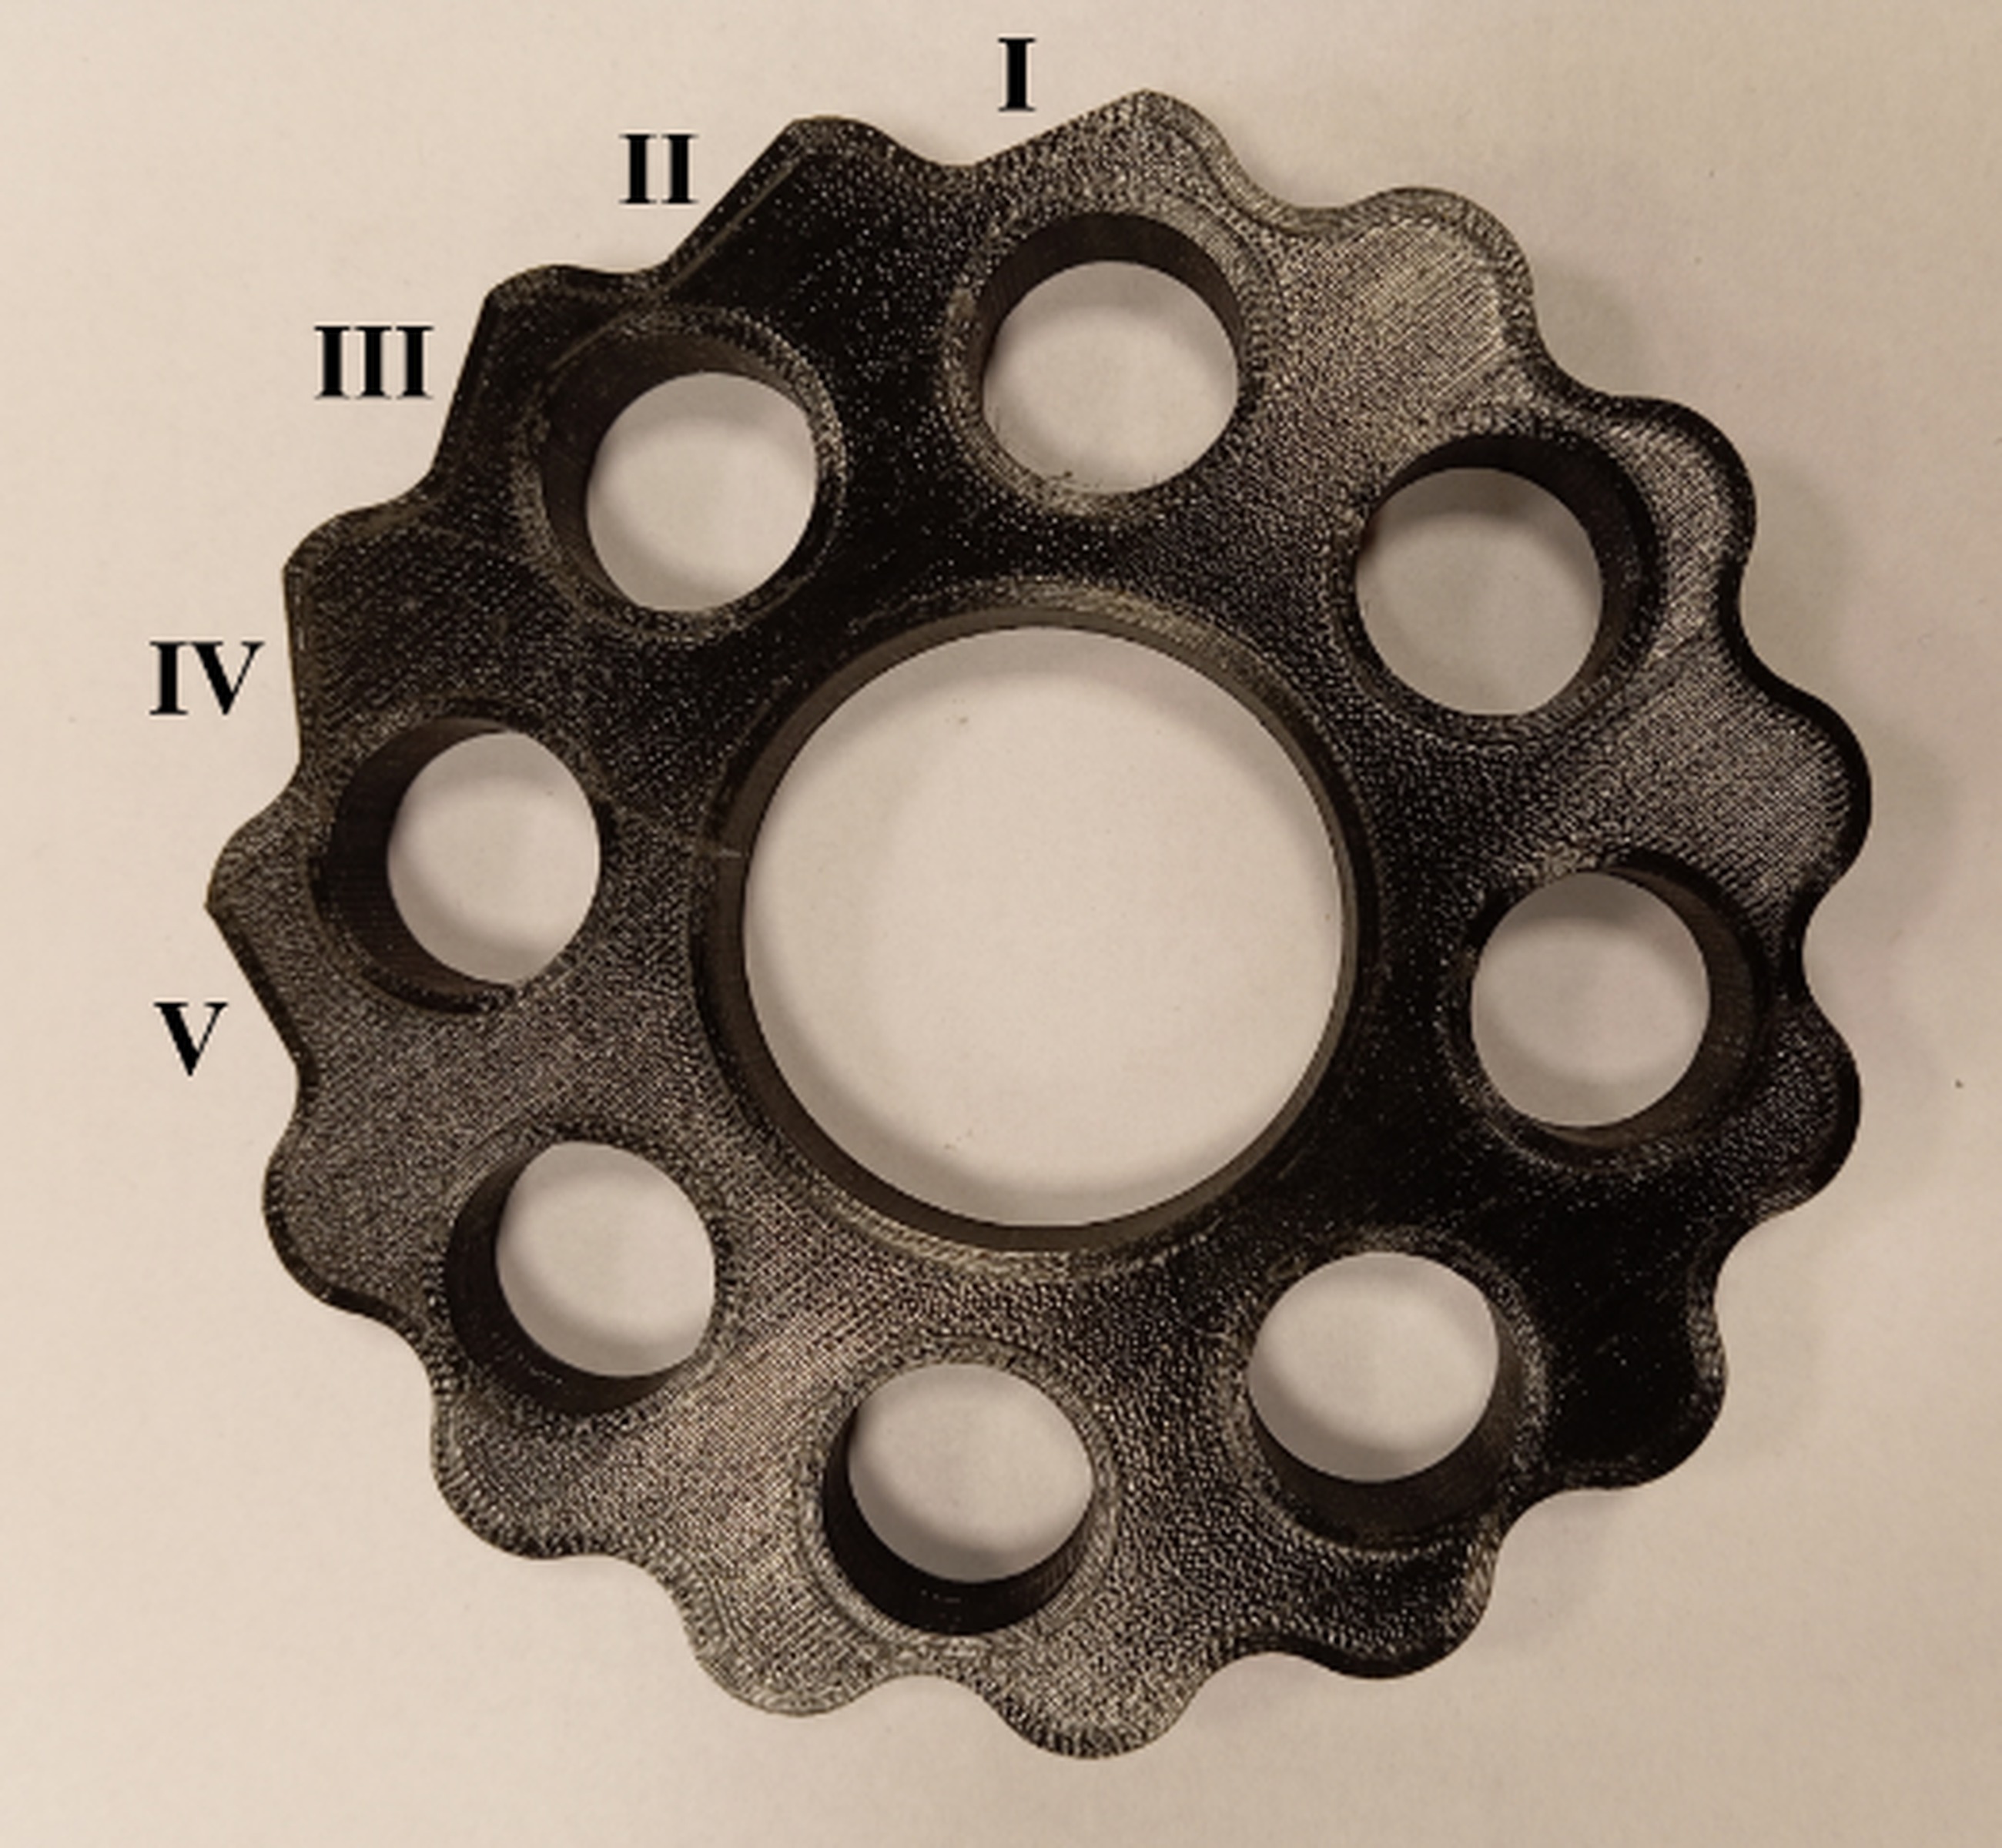
The defects introduced in the cycloidal discs were designed to simulate surface wear. Half of each lobe was replaced with a planar surface extending from the pit to the tip of the lobe. Contact with a surface of effectively infinite curvature radius leads to an increase in the contact force, which in turn affects the measured output torque.
The measured data were processed using MATLAB software, in which the fault diagnosis methods evaluated in this study were implemented. These methods included: 1) adjustment of Morris wavelet parameters to match the general frequency characteristics of the analyzed gearbox, 2) Power Spectral Density (PSD) analysis, 3) methods based on PSD roll off and spectral centroid, 4) analysis of narrowband-to-wideband energy ratios, 5) spectral flatness analysis, and 6) application of spectral entropy.
Parameters Of The Measurement Set Up
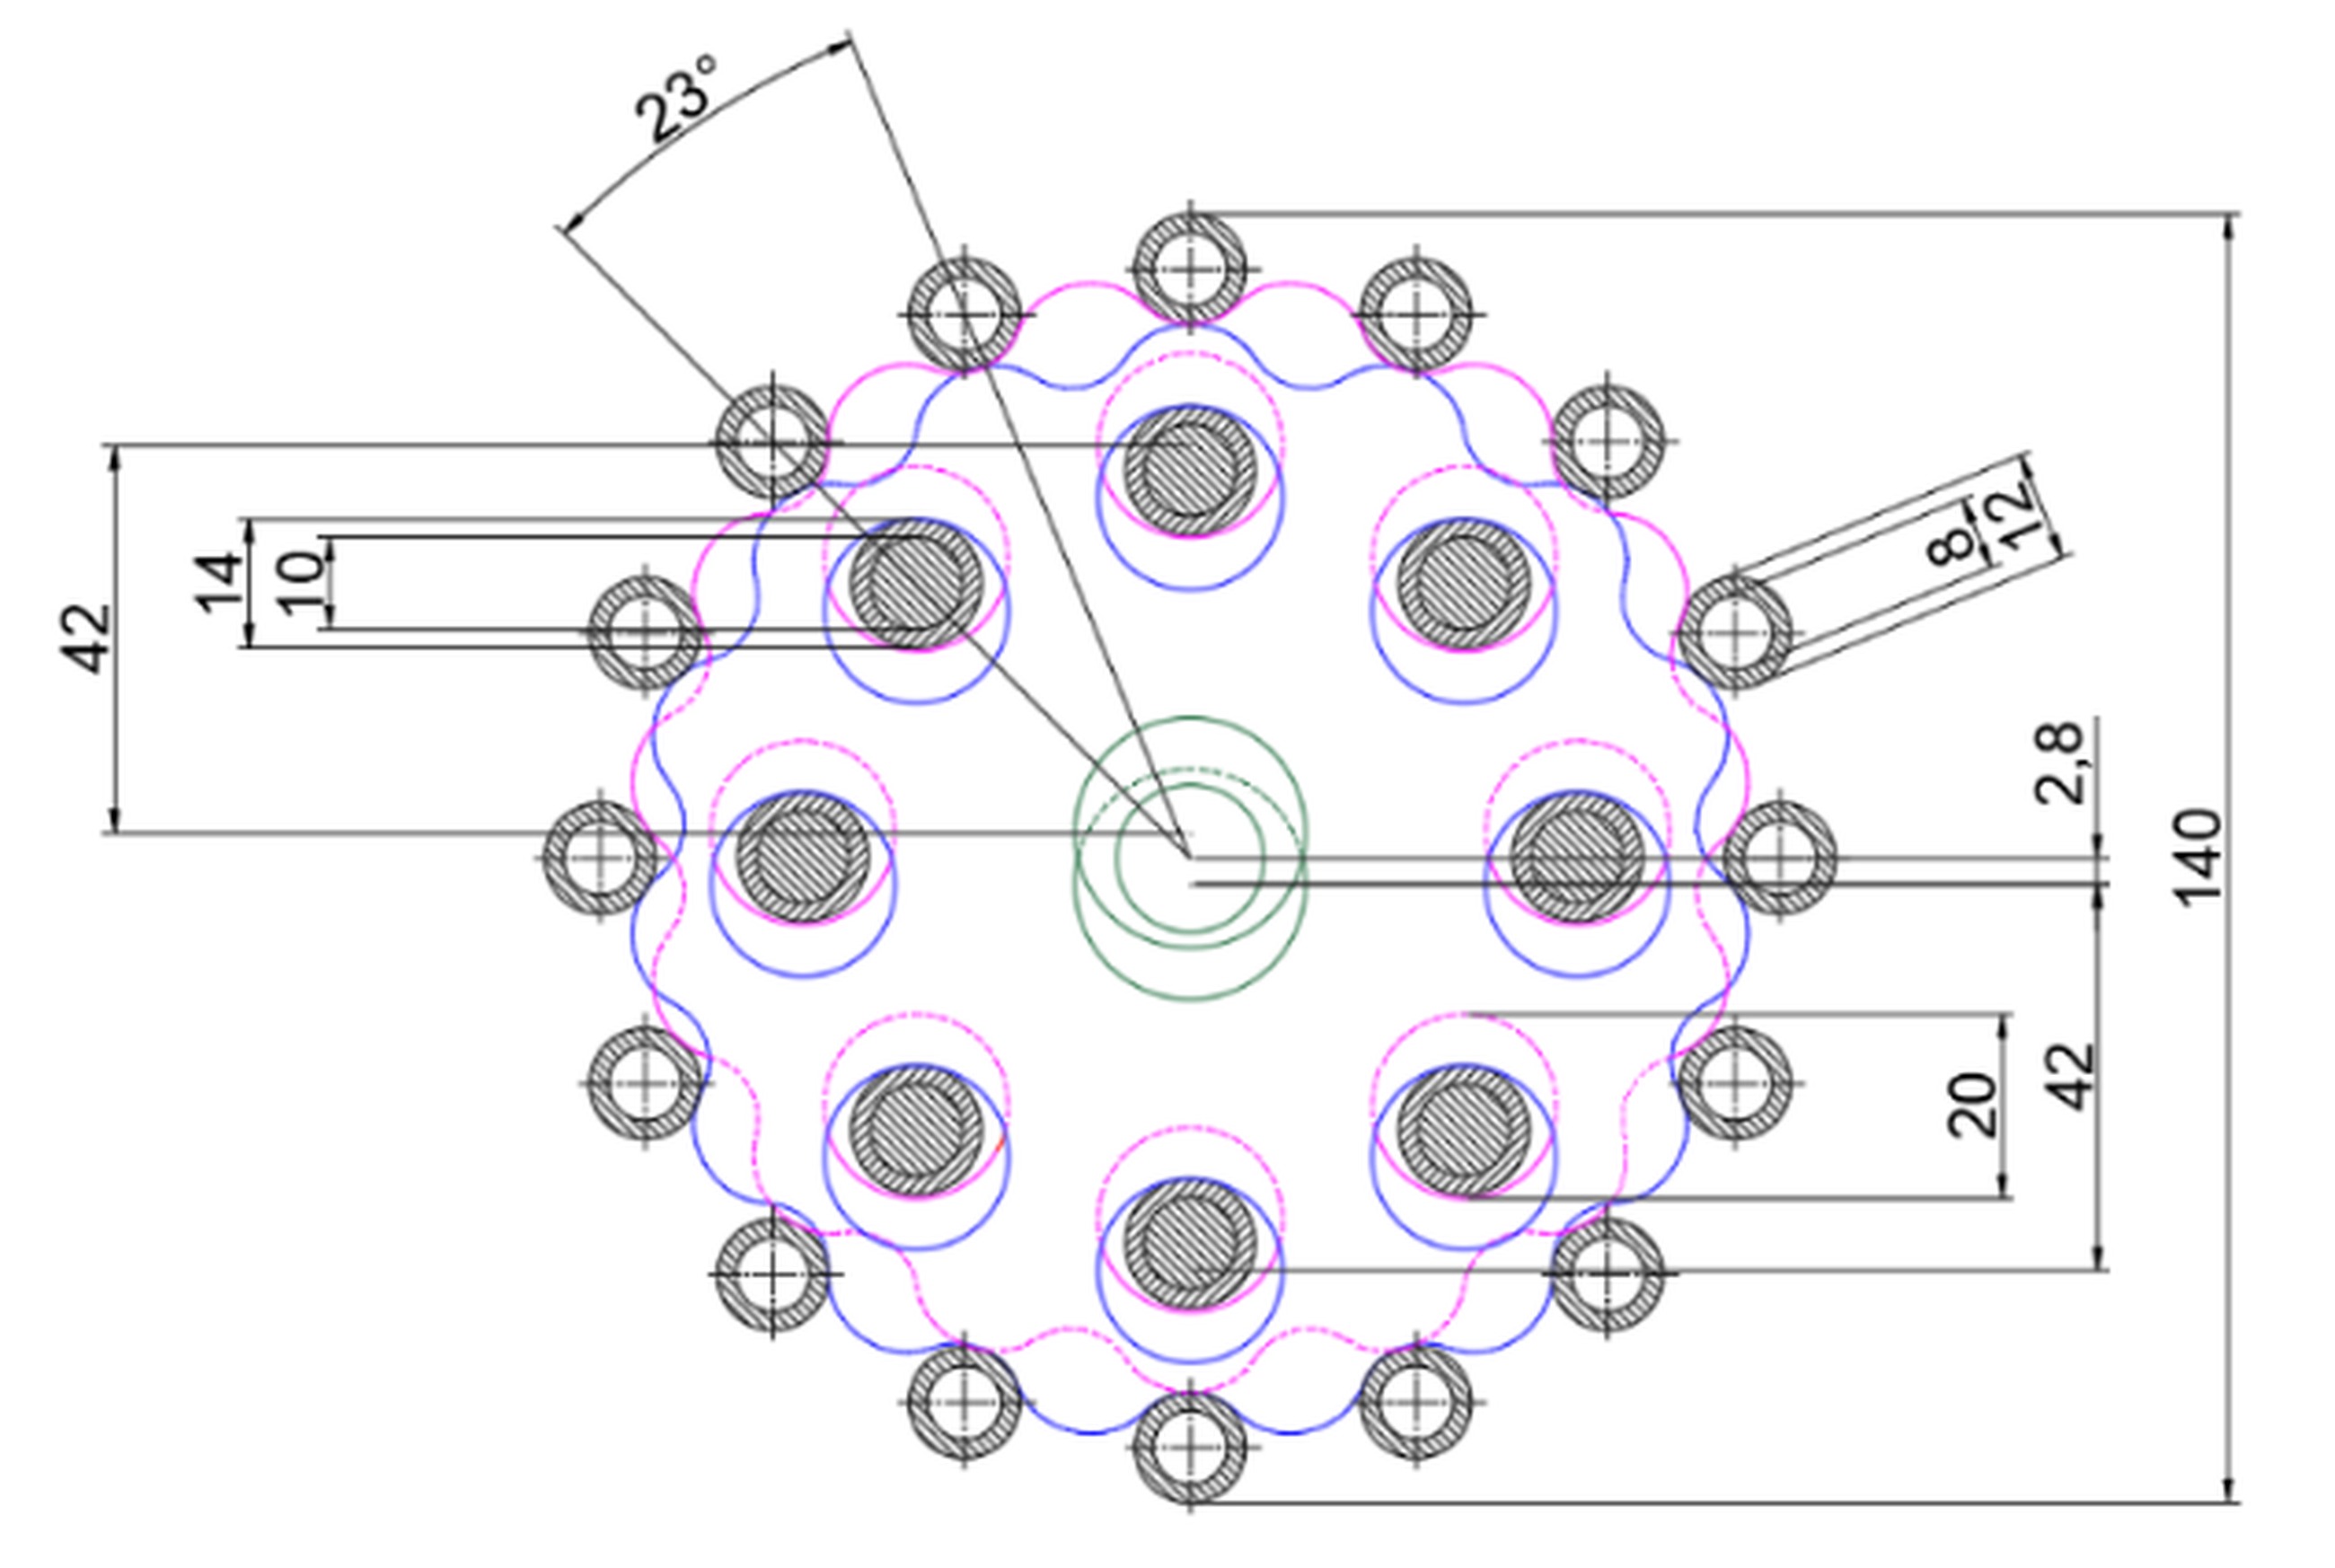
The structure of the cycloidal gearbox is shown in Figure 4. The parameters of the cycloidal discs are specified in Equation (1) and summarized in Table 1, while the parameters of the measurement rig are provided in Table 2.
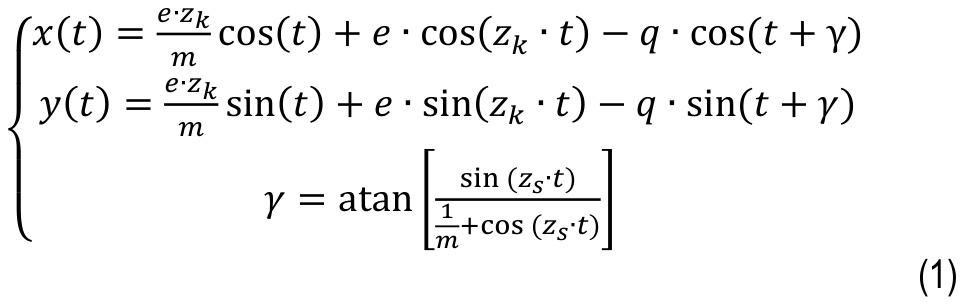
Tab. 1
Parameters used in the equation (1)
Tab. 2
Parameters of the measurement rig
Parameter | Description | Value |
M | Moment of the braking motor | 22 Nm |
f | Sampling frequency | 25.6 kHz |
ω | Angular velocity of the input shaft | 500 RPM |
During the measurements, the braking motor torque was not constant. Although it was set to a nominal value of 22 Nm, significant fluctuations were observed. These fluctuations were filtered using a high-pass filter implemented in MATLAB. Cut-off frequencies of 0.5 Hz, 1 Hz, 10 Hz and 50 Hz were applied. Unfortunately, the elimination of low frequency components led to significant difficulties in verifying the proposed methods. Low-frequency components are more important in the measured data than in the data obtained from the Fortran simulation model. Moreover, the high-frequency peaks in the FFT spectrum of the measured data were significantly lower than those obtained in the simulations. Therefore, all methods were ultimately tested on the unfiltered measured data, which include low-frequency fluctuations of the braking motor torque.
Multibody Dynamics Model Programmed In Fortran
GNU Fortran was used to implement multibody dynamics model of the cycloidal gearbox with parameters given in Figure 4, Equation 1 and Table 1. The model was employed to verify the measured signals. In the simulations, the system of equations (2) is integrated using 2nd order Runge Kutta method.
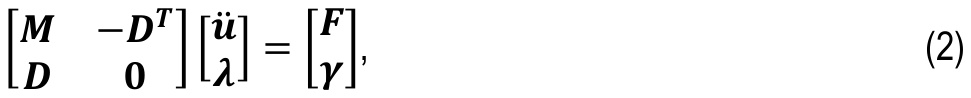
where: M – is the mass matrix (contains masses and moments of inertia of the system components), D – is the Jacobian matrix, 0 – denotes the zero matrix, u – represents the solved accelerations, λ – denotes the solved reaction forces, F – is the vector of applied forces and moments, γ – is the right-hand side vector of the acceleration equations.
The bodies in the multibody dynamics model are allowed to rotate about their mounting points, which are modeled as revolute joints. Friction in the joints was neglected. Contact interactions were modeled using the Hunt-Crossley Hertzian contact model (3), with parameters listed in Table 3.

where: Fn – is the normal contact force, K – is the contact stiffness, δ – is the penetration depth, p – is the force exponent, C – is the viscous damping coefficient, and vn - is the normal velocity, defined as the relative velocity of the contacting points.
The cycloidal discs in the multibody dynamics model were discretized using uniform increments of the parameter t in the cycloidal disc equation (1).
Tab. 3
Hertzian contact parameters in the Fortran model
Measured Data
Measurements were conducted using a single cycloidal gearbox, tested in both a healthy configuration and with cycloidal discs containing defects. The gearbox was operated with seven consecutive discs exhibiting an increasing number of defects. In the first disc, a defect was present in a single lobe; in the second disc, defects were present in two consecutive lobes; in the third disc, three consecutive lobes were defective, and so on. The parameters of the measured signals are summarized in Table 4.
Tab. 4
Parameters of the measured data
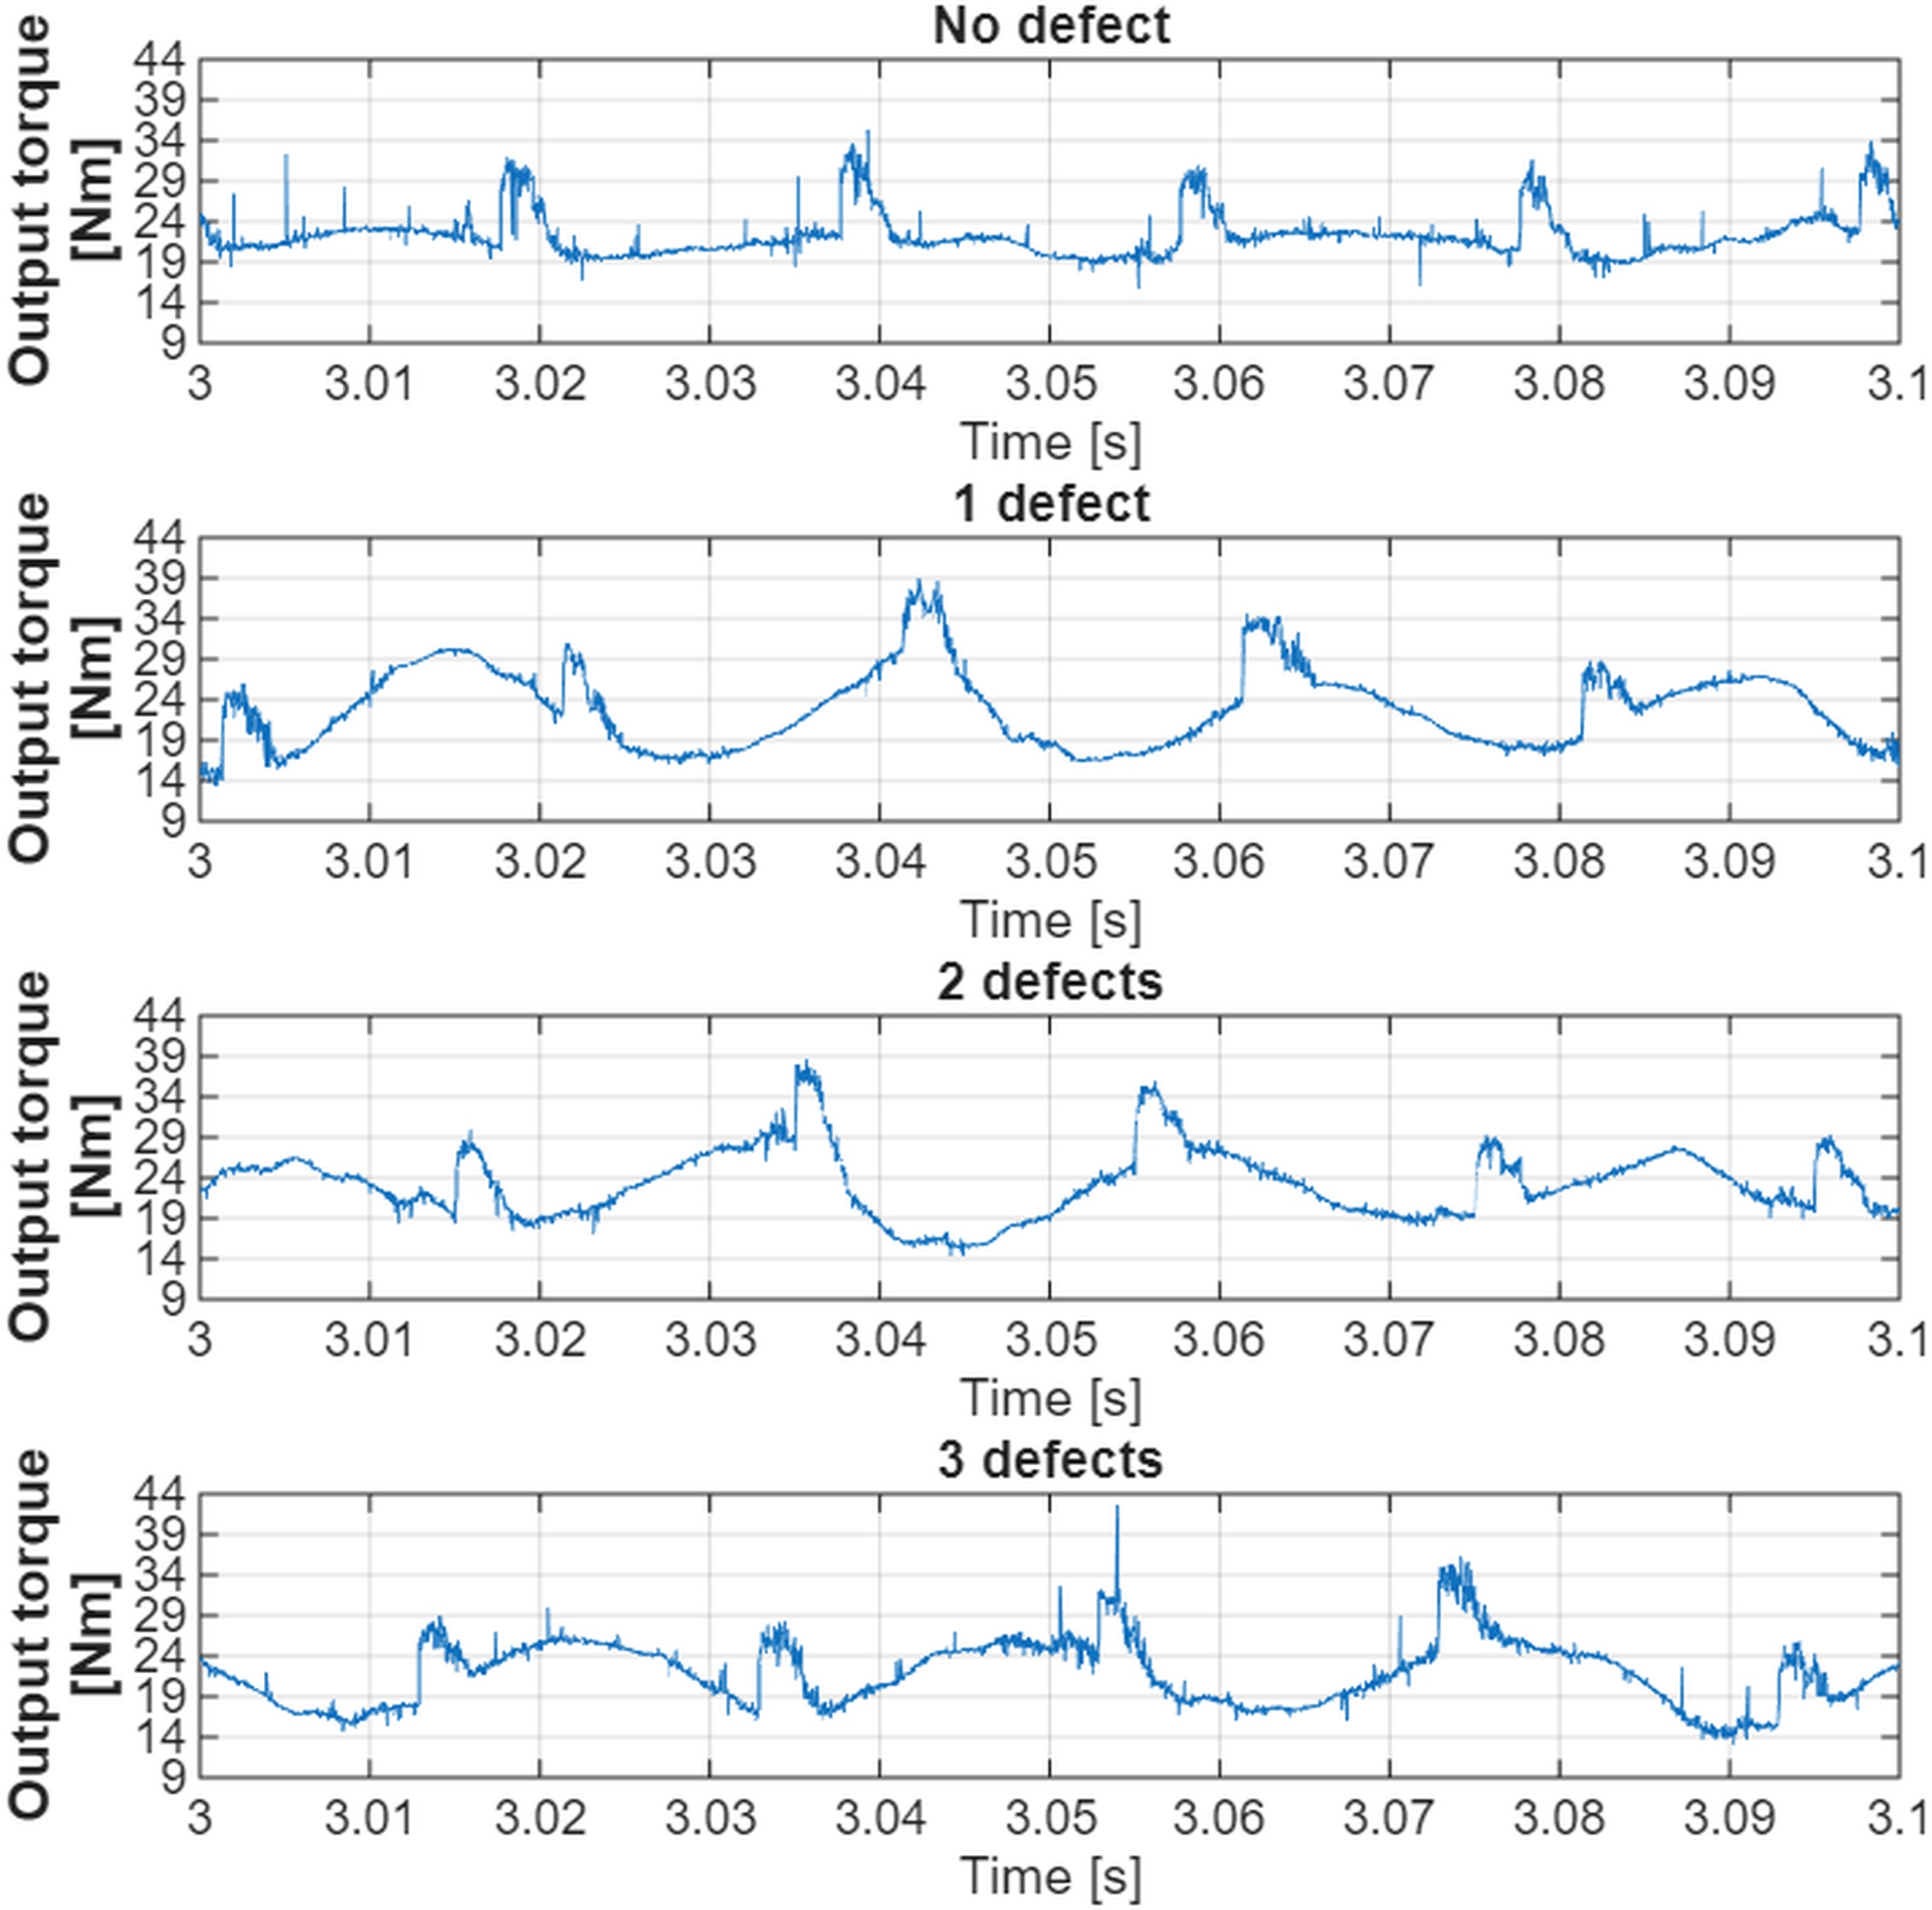
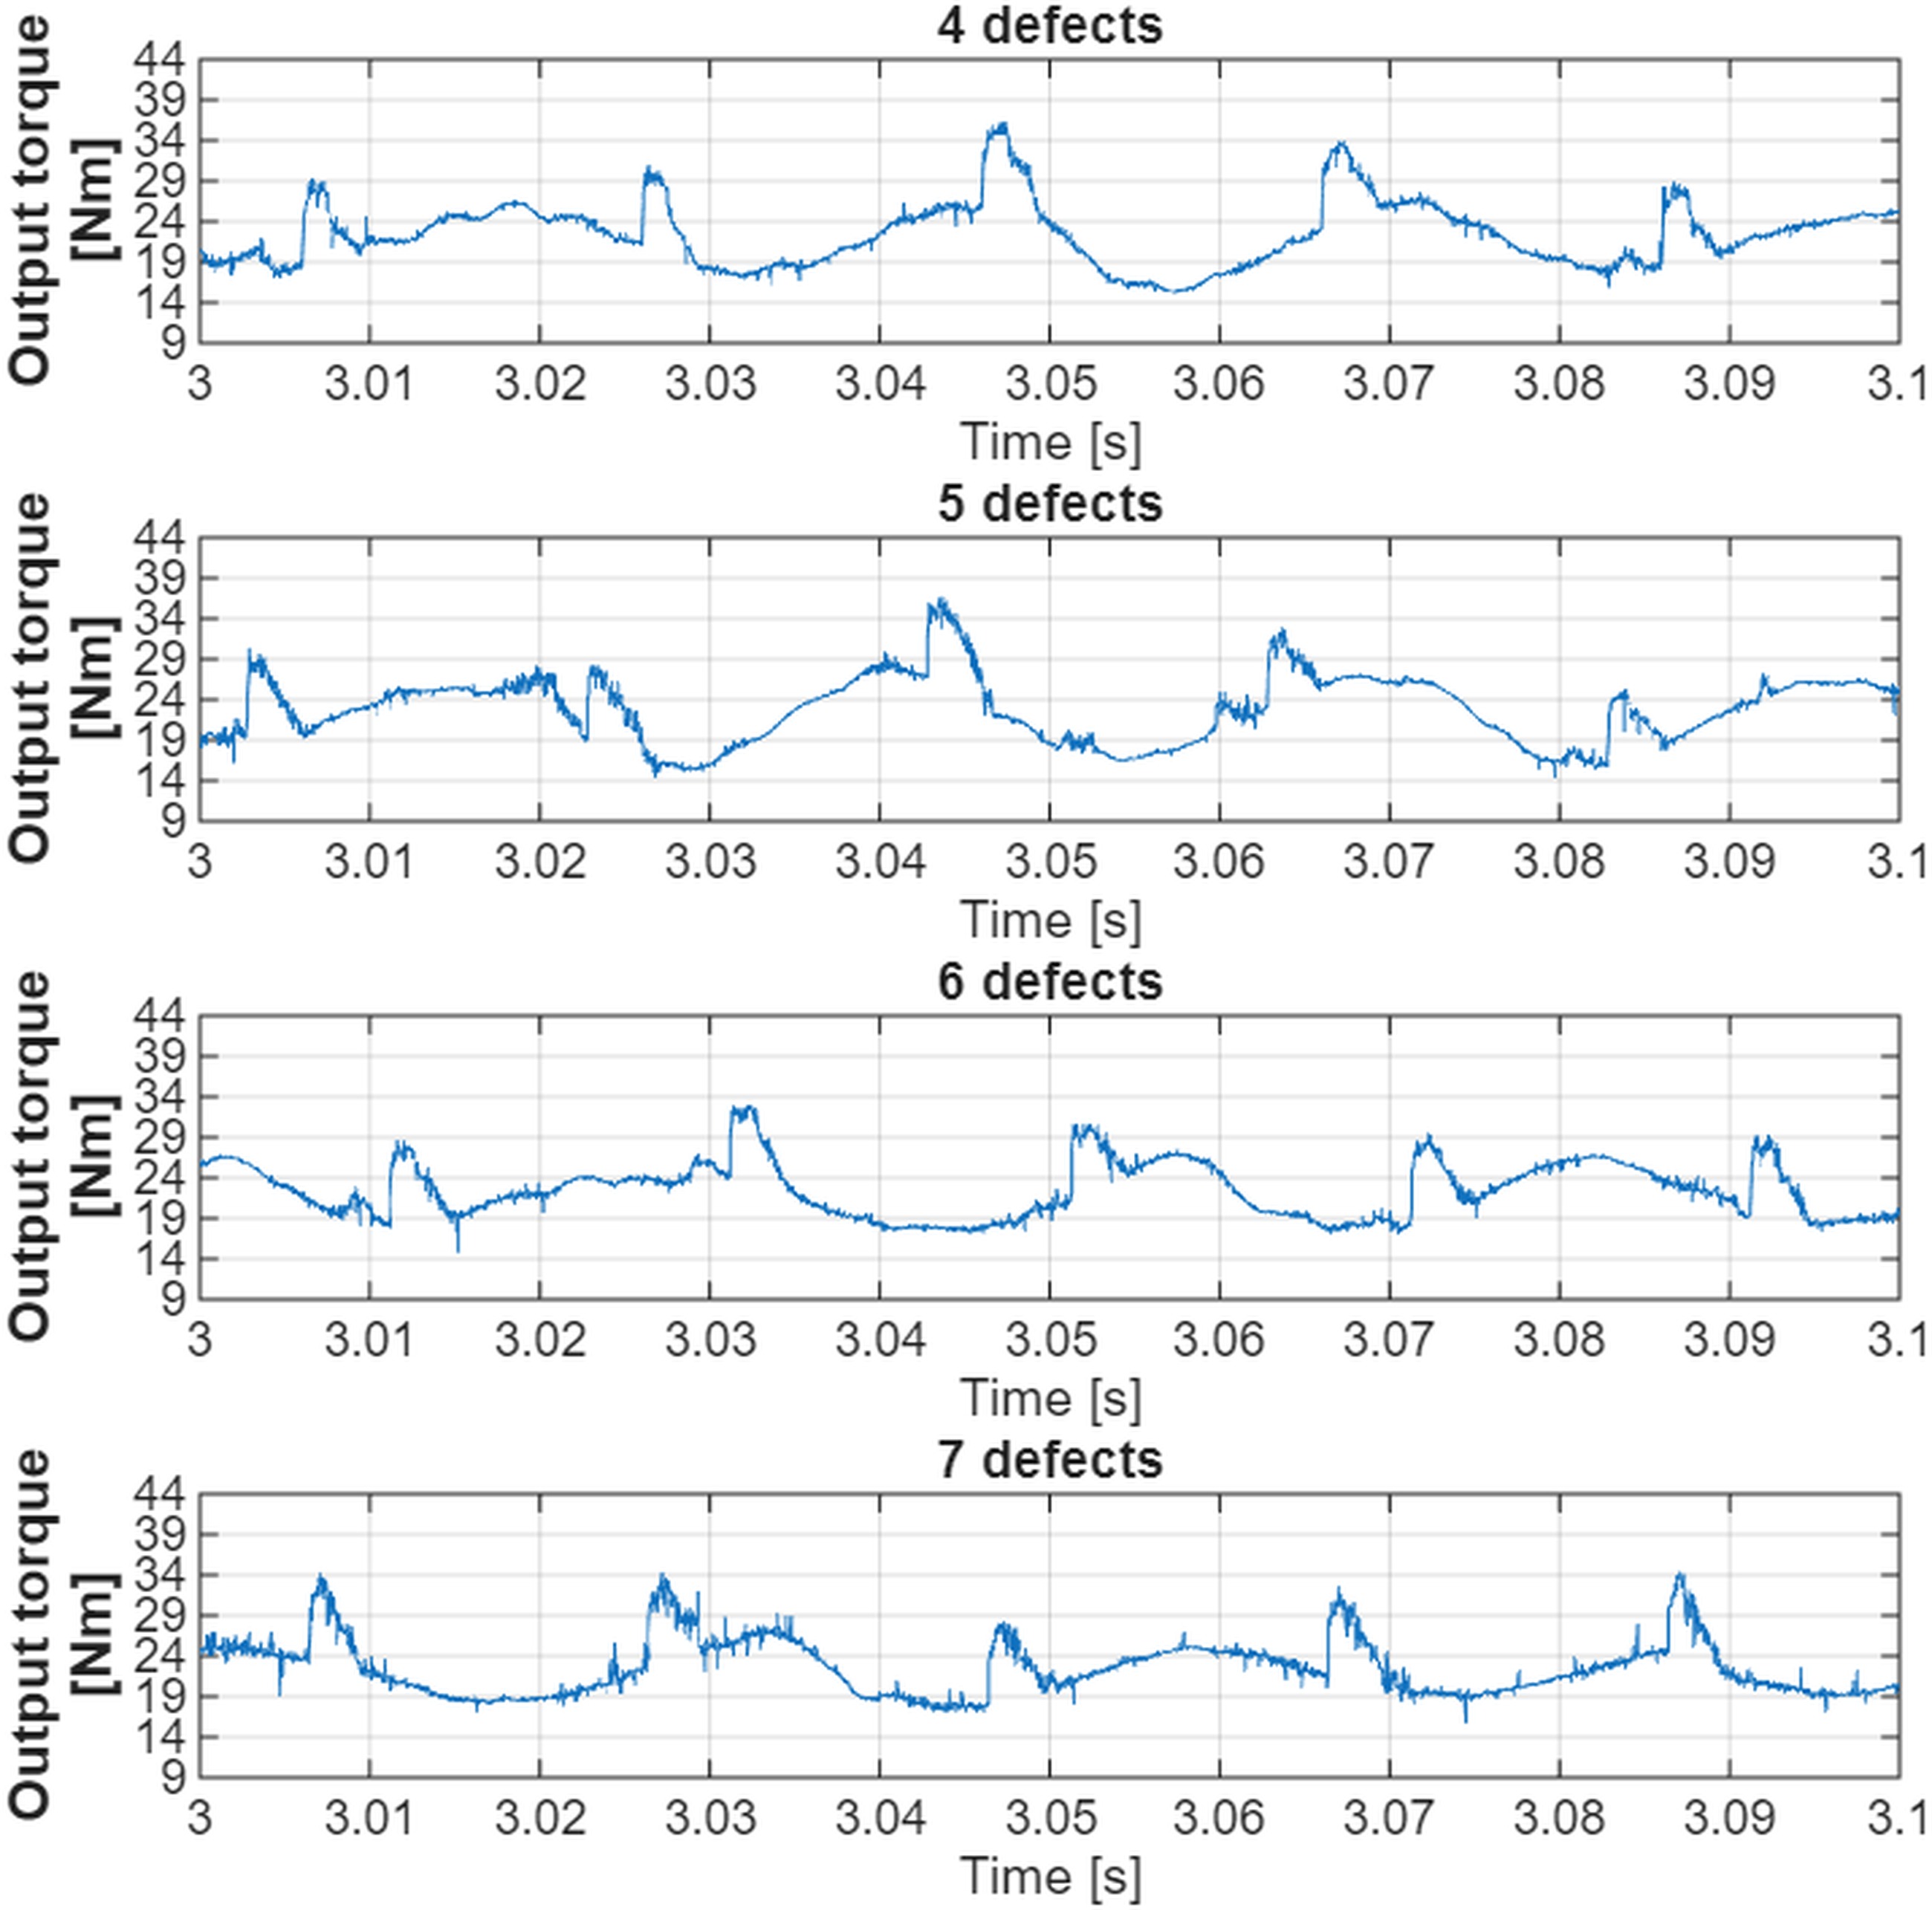
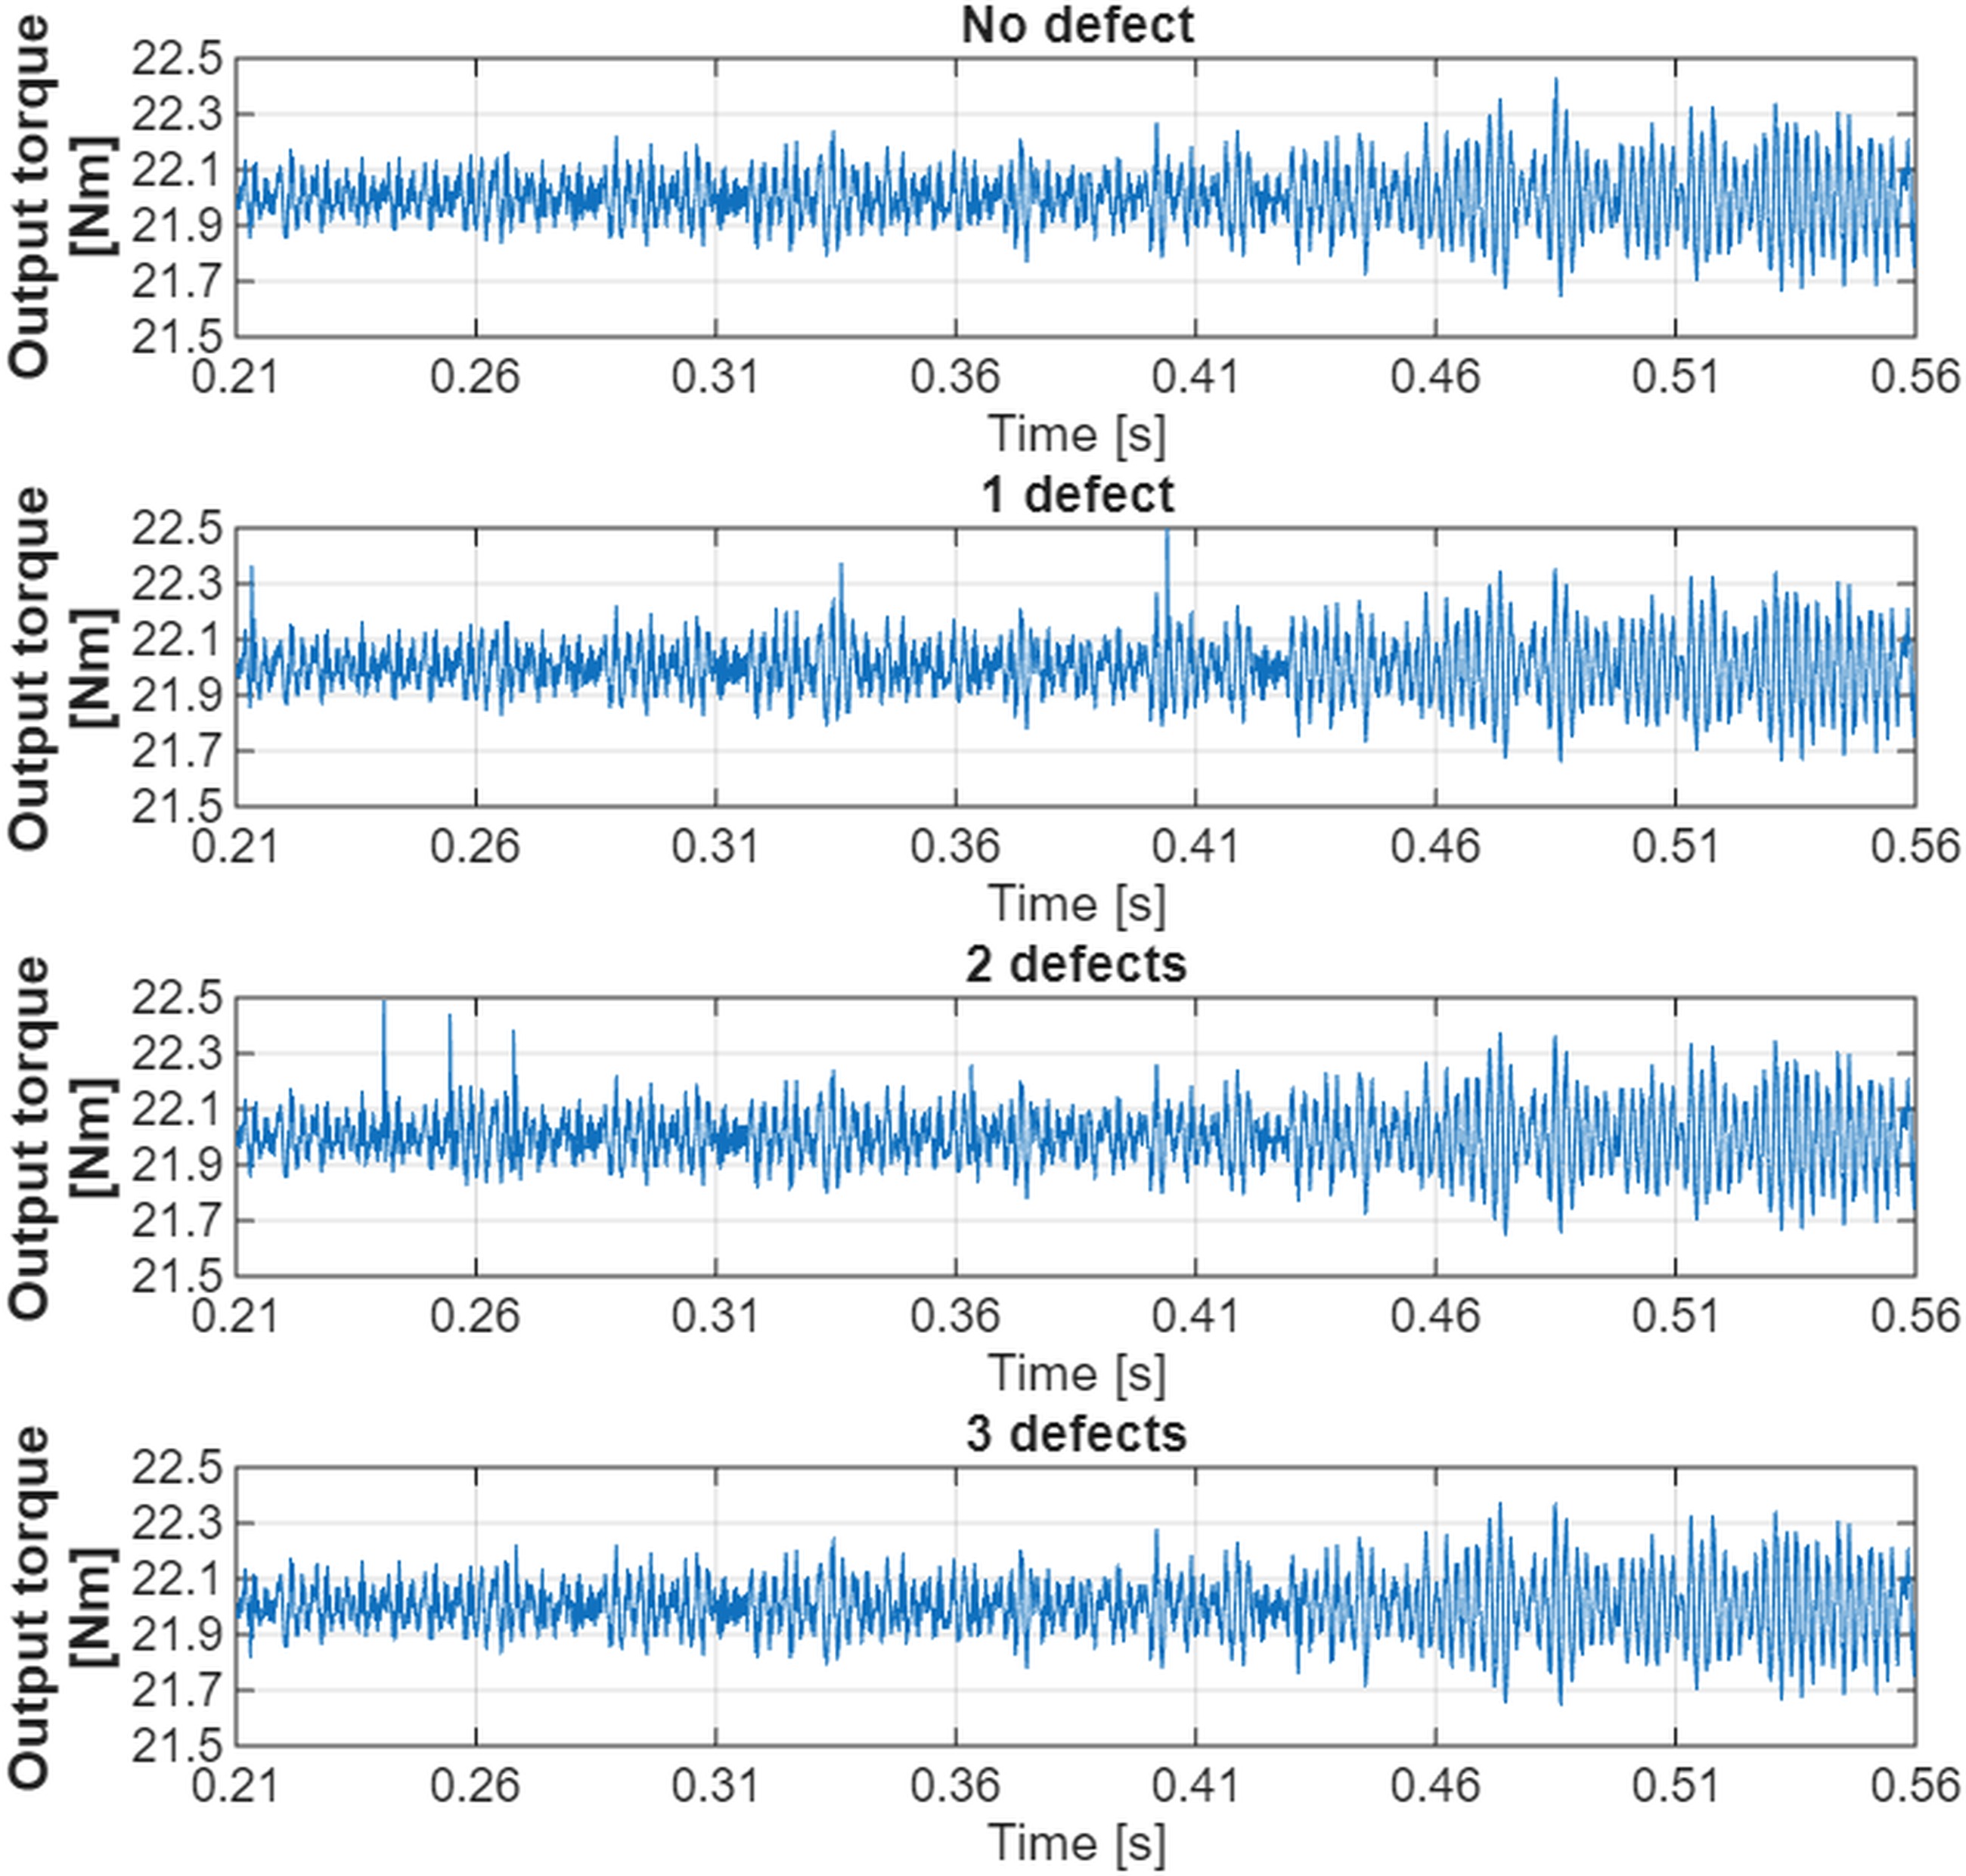
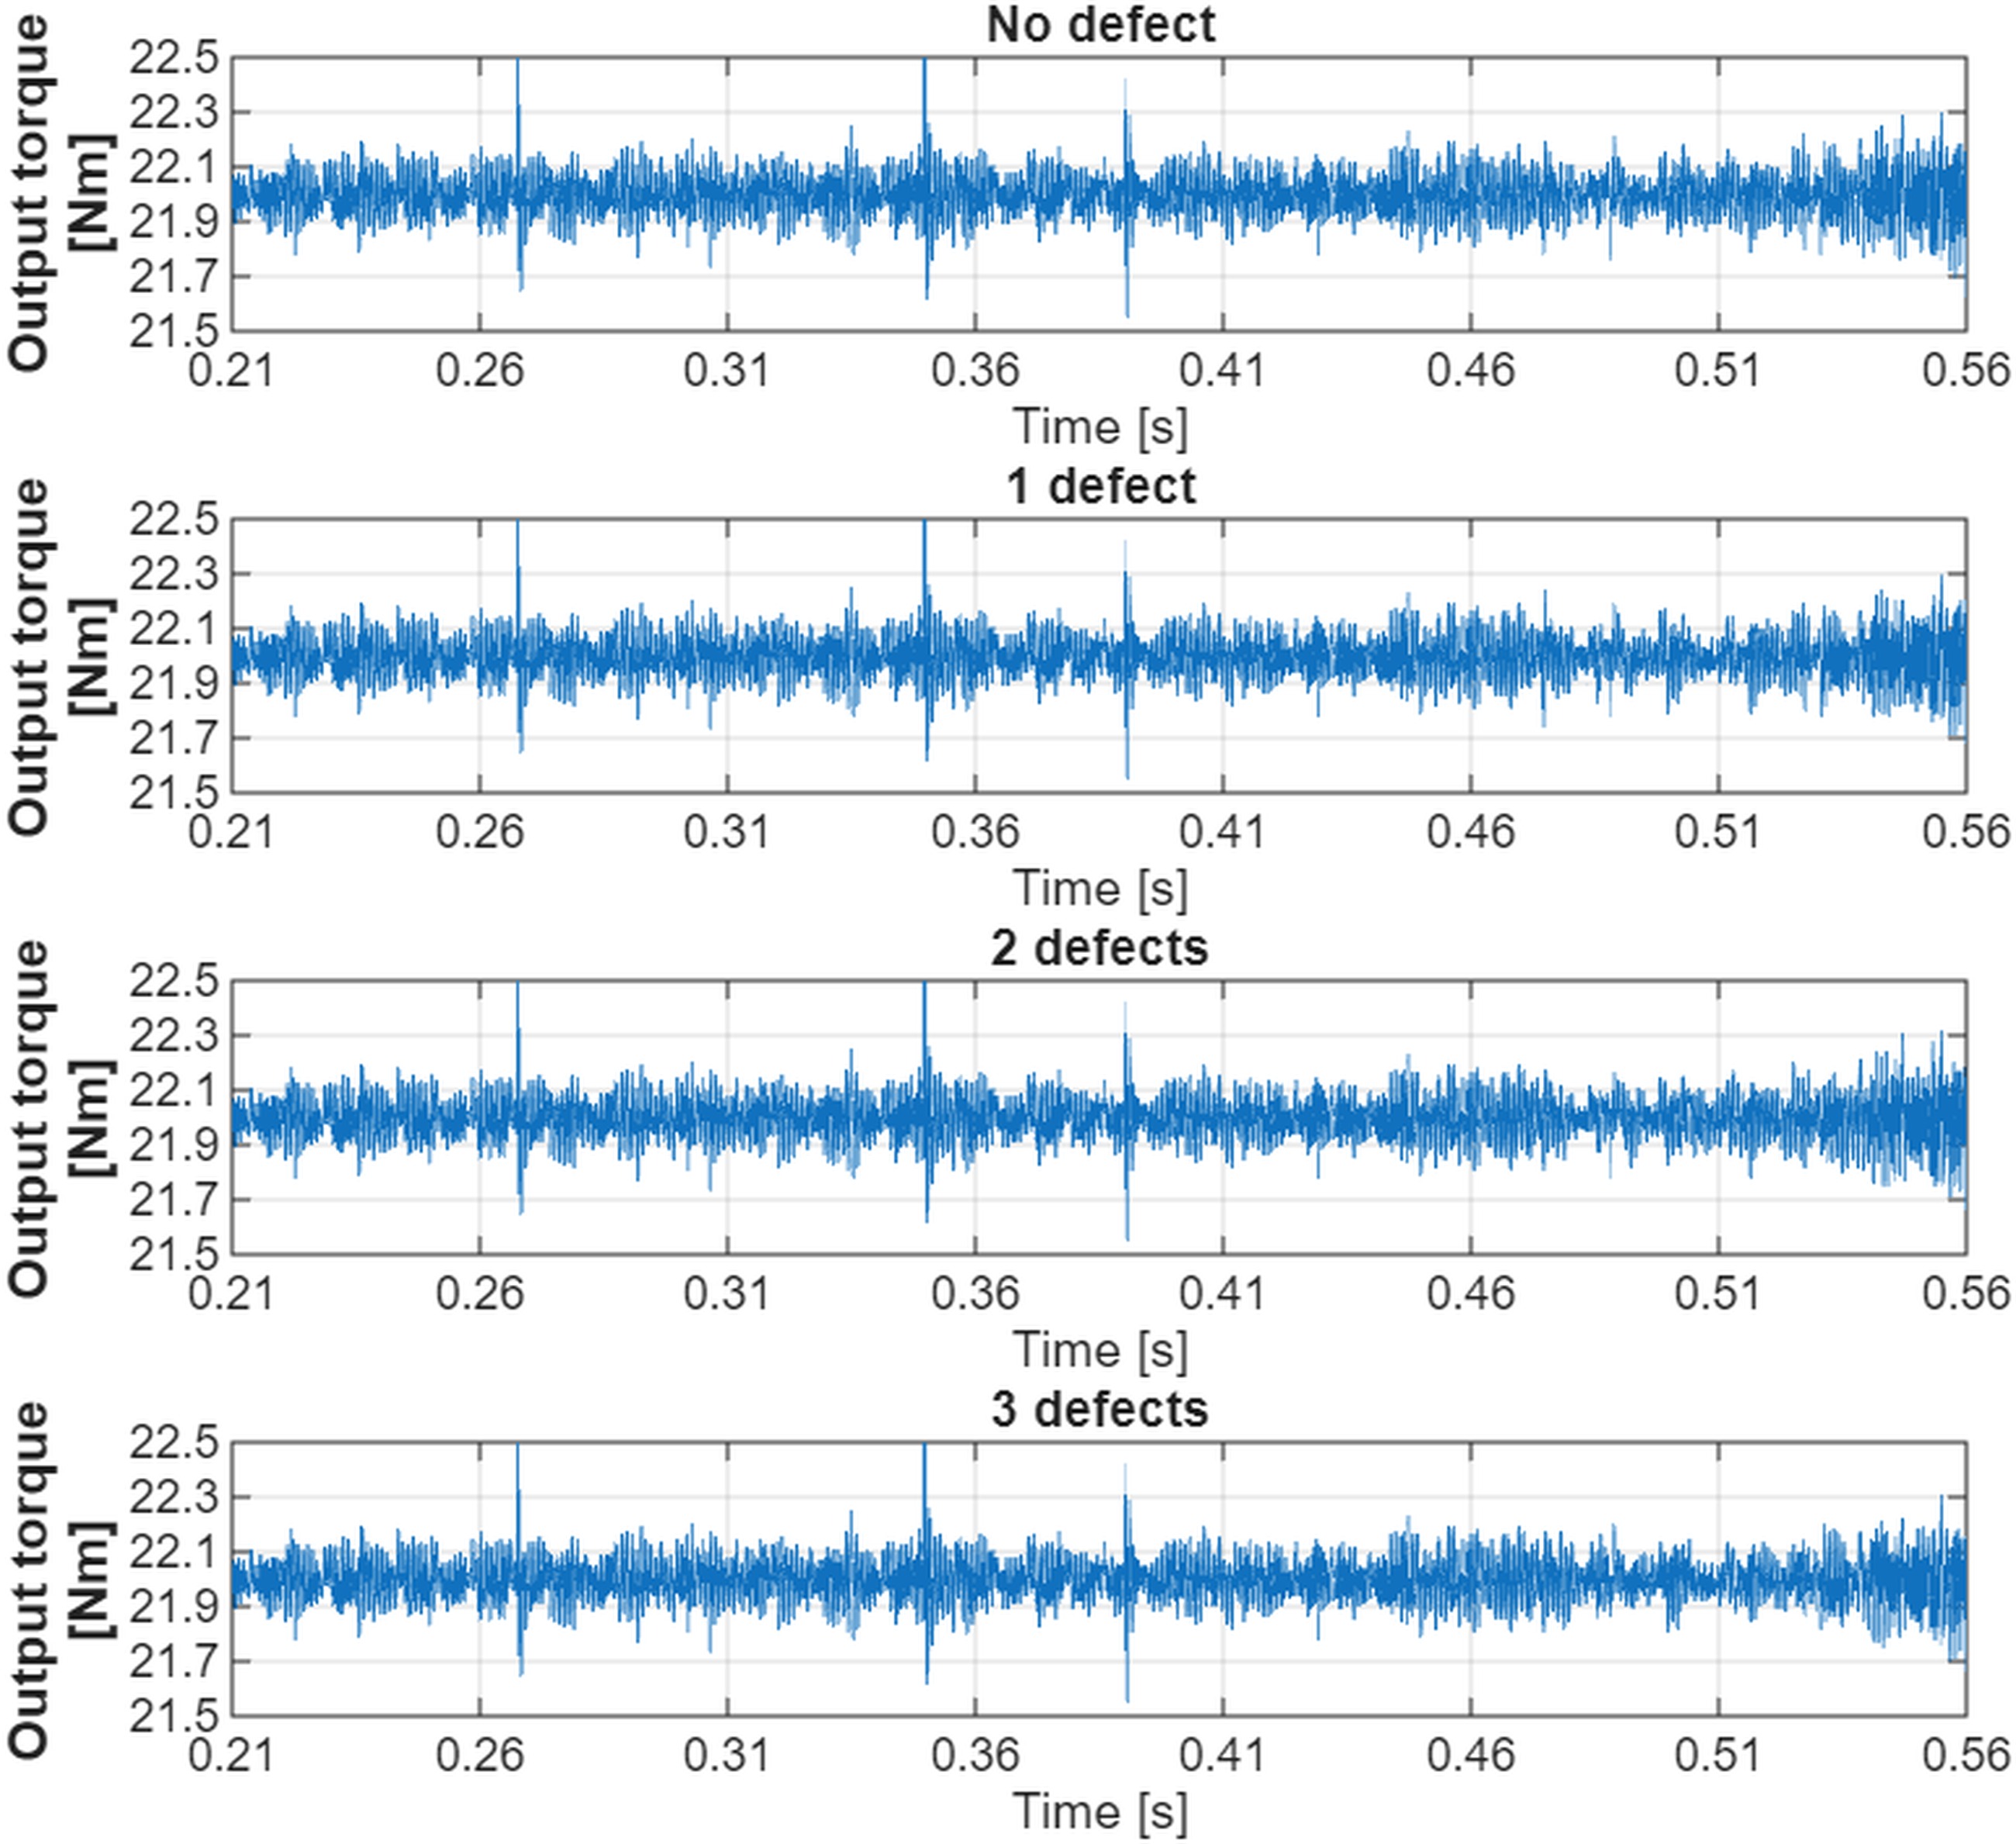
The measured signals are presented in Figures 5 and 6. The corresponding time-domain plots exhibit a drifting DC component of the output torque, which is caused by fluctuation in the braking motor. Figures 7 and 8 present the output torque obtained for the same gearbox configuration using the Fortran-based multibody dynamics model with ABS disc (Figure 7) and with steel disc (Figure 8). The simulated output torque signals are more symmetric and exhibit lower peak-to-peak amplitudes, however the influence of the defects is difficult to distinguish in the general observation.
In the Fortran model, the time increment was constant and equal to Δt=10-5 s, corresponding to a sampling rate of 100 kHz. However, in the presented data every 10-th iteration is shown. The output torque measured using National Instruments data acquisition cards was sampled at 25.6 kHz, as specified in Table 2.The higher temporal resolution of the Fortran simulation enables more accurate capture of output torque modulation resulting from rolling contact interactions. Nevertheless, testing Morris wavelets on the Fortran model, as reported in [4], did not lead to a clear formulation of a reliable fault diagnosis method.
Based on the measured data, new fault diagnosis approaches were investigated.
Testing New Fault Diagnosis Methods
Morris Minimum Bandwidth Wavelets are commonly used in the diagnosis of planetary gearboxes. In previous studies [4], certain features enabled discrimination between selected numbers of defects. In the present work, further analysis was conducted with attempts to adjust the frequency characteristics of the measured output torque to the computed scalograms. Unfortunately, this approach proved unsuccessful for the analyzed cycloidal gearbox geometry.
Adjustment of the Morris wavelets parameters
For the vibration signals measured for the healthy gearbox and for the gearbox equipped with defective cycloidal discs, the rotational frequency of the input shaft was determined as 8.33 Hz (500 RPM). Based on this value, the gear meshing frequency was calculated as 8.33 Hz multiplied by the number of pins. Next, using the maximum allowable Morris wavelet decomposition level, the frequency bandwidths of each detail level were determined as BLO=fs/2j+1 and BHI=fs/2j, where j denotes the wavelet decomposition level. The decomposition level j for which the meshing frequency fell within the corresponding bandwidth was selected. This level was assumed to contain components associated with potential defects. Subsequently, the signal envelope at the selected level was extracted using Hilbert transform, and the FFT of the envelope was computed. Finally, the envelope spectra of the healthy gearbox and the defective gearbox were compared in order to identify fault-related harmonic components. However, this method was unable to distinguish between different numbers of defects in the measured signals.
An additional approach using Morris wavelets was also investigated. For the healthy gearbox and for the seven cycloidal discs with defects, Morris Minimum-Bandwidth Wavelets scalograms were computed in MATLAB. According to [4], the minimum values of scalograms were compared with the minimum values obtained for the measurement corresponding to the highest number of defects (seven defects). The objective of this approach was to identify minima overlapping with the largest gap in the defect sequence.
The comparison of the minima for all scalograms is shown in Figure 9.
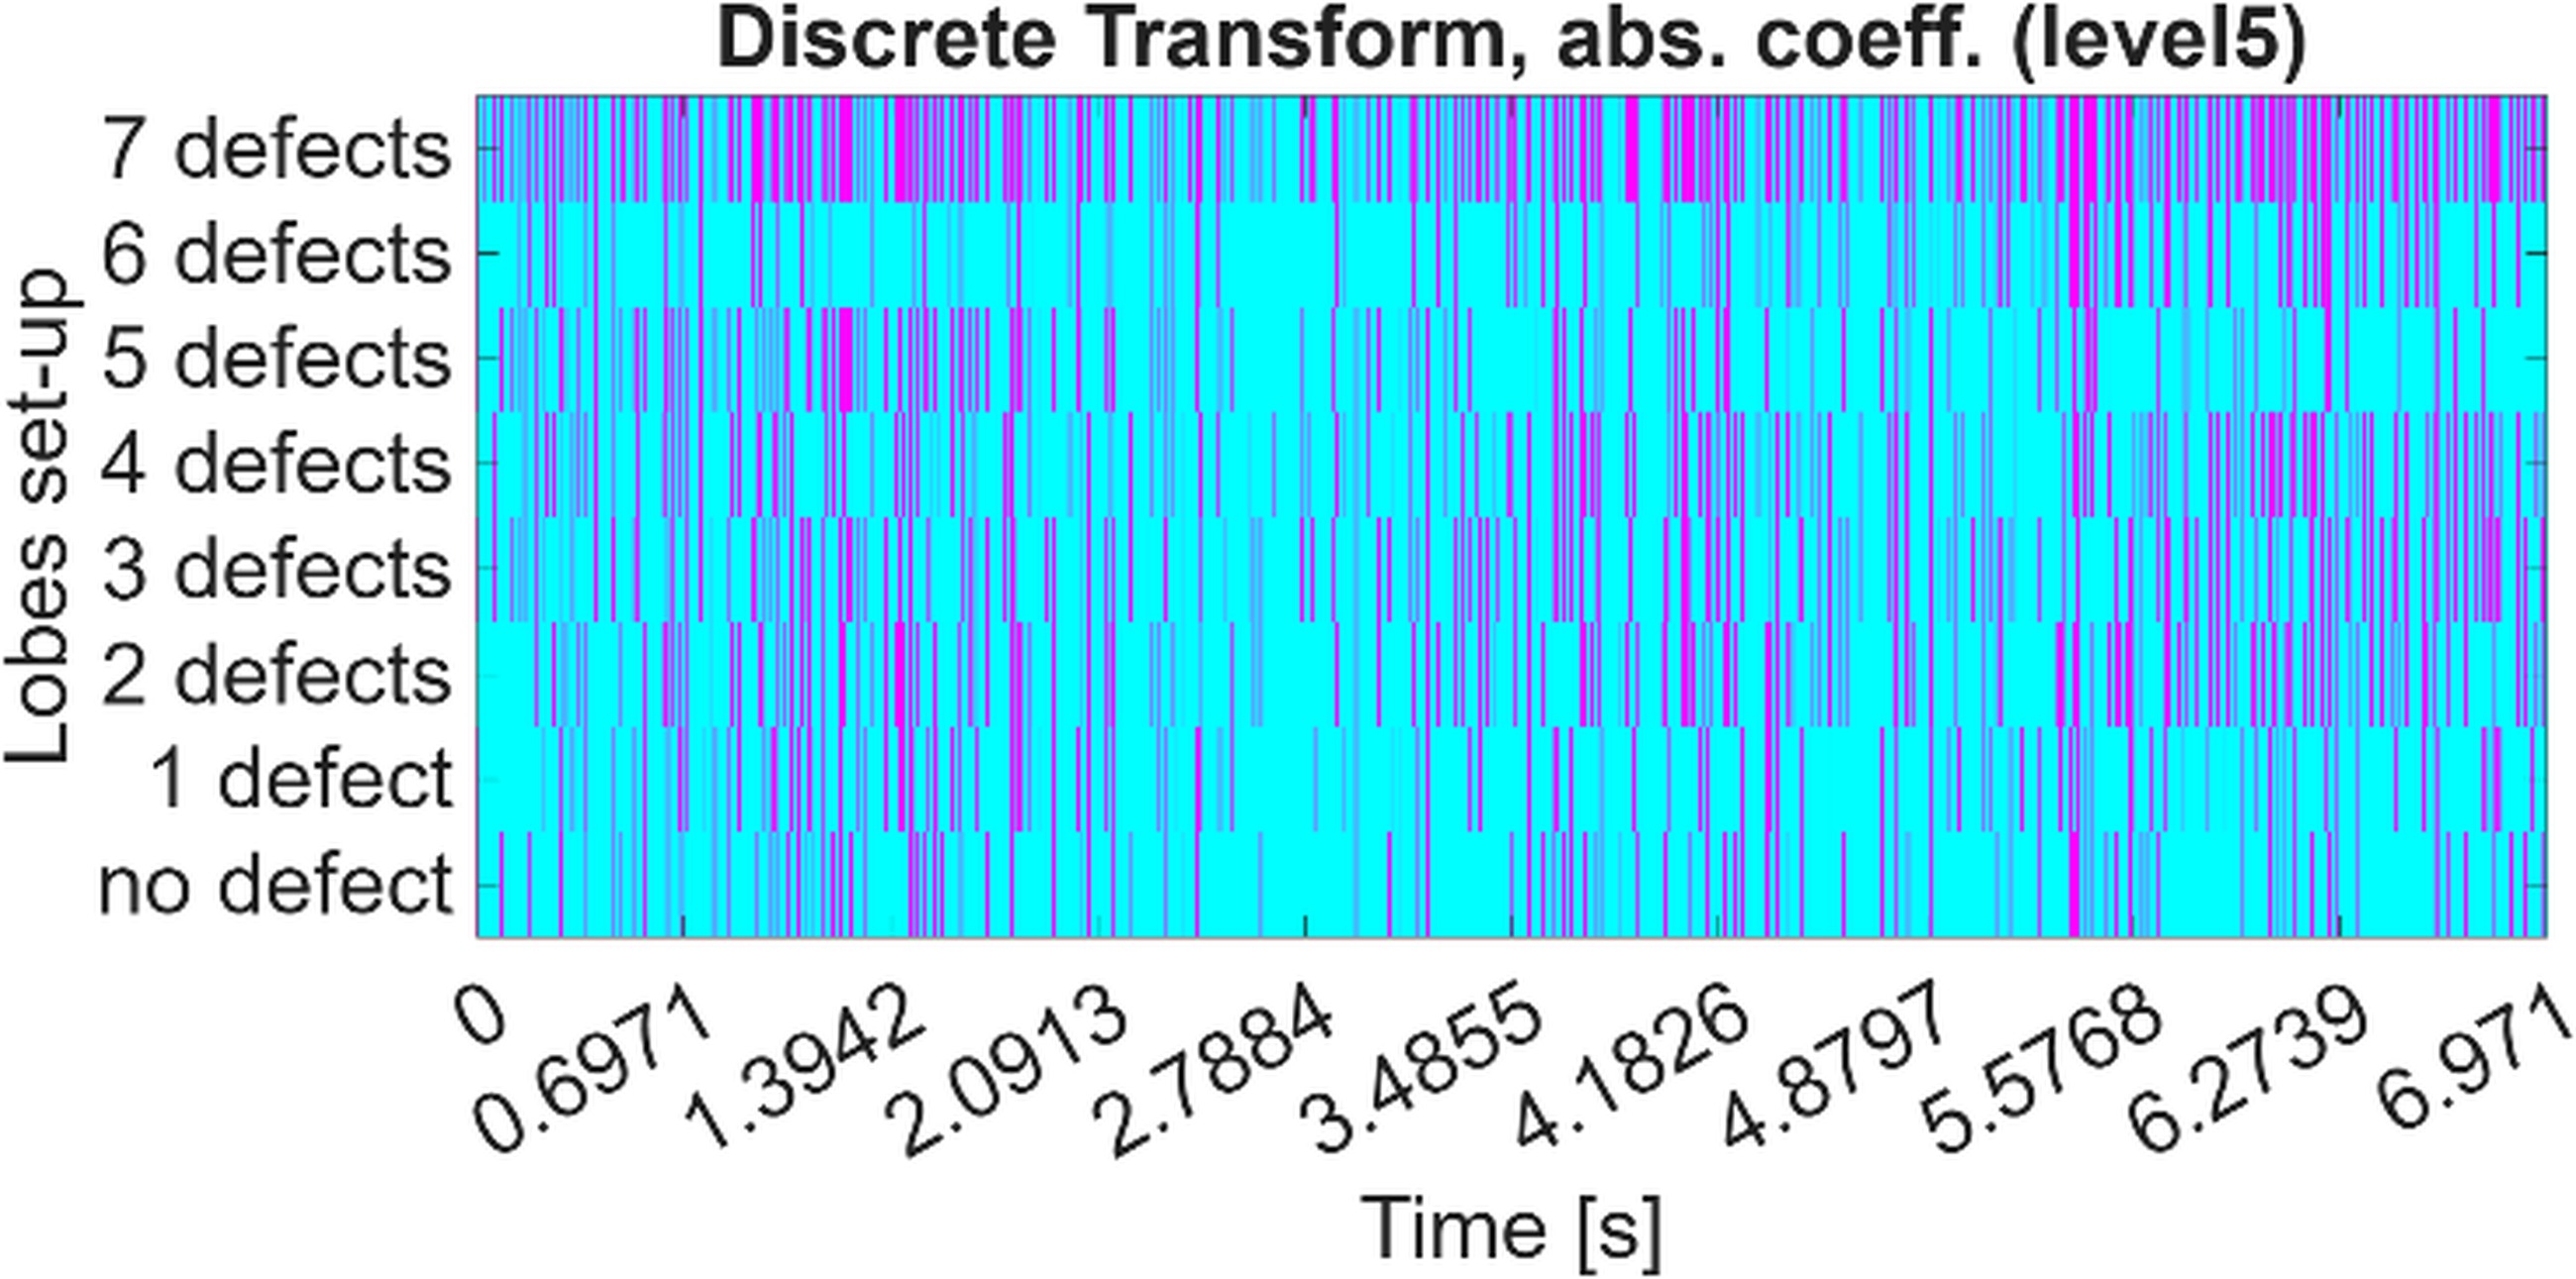
Fig. 9. Minima of scalograms (dark colour), which overlap with the minima of scalogram for the 7 defects
The scalograms shown in Figure 9 indicate that Morris Minimum-Bandwidth Wavelets do not exhibit a gradual relationship between the number of defects and the number of overlapping minima. Attempts to identify such a relationship at other decomposition levels also did not yield positive results.
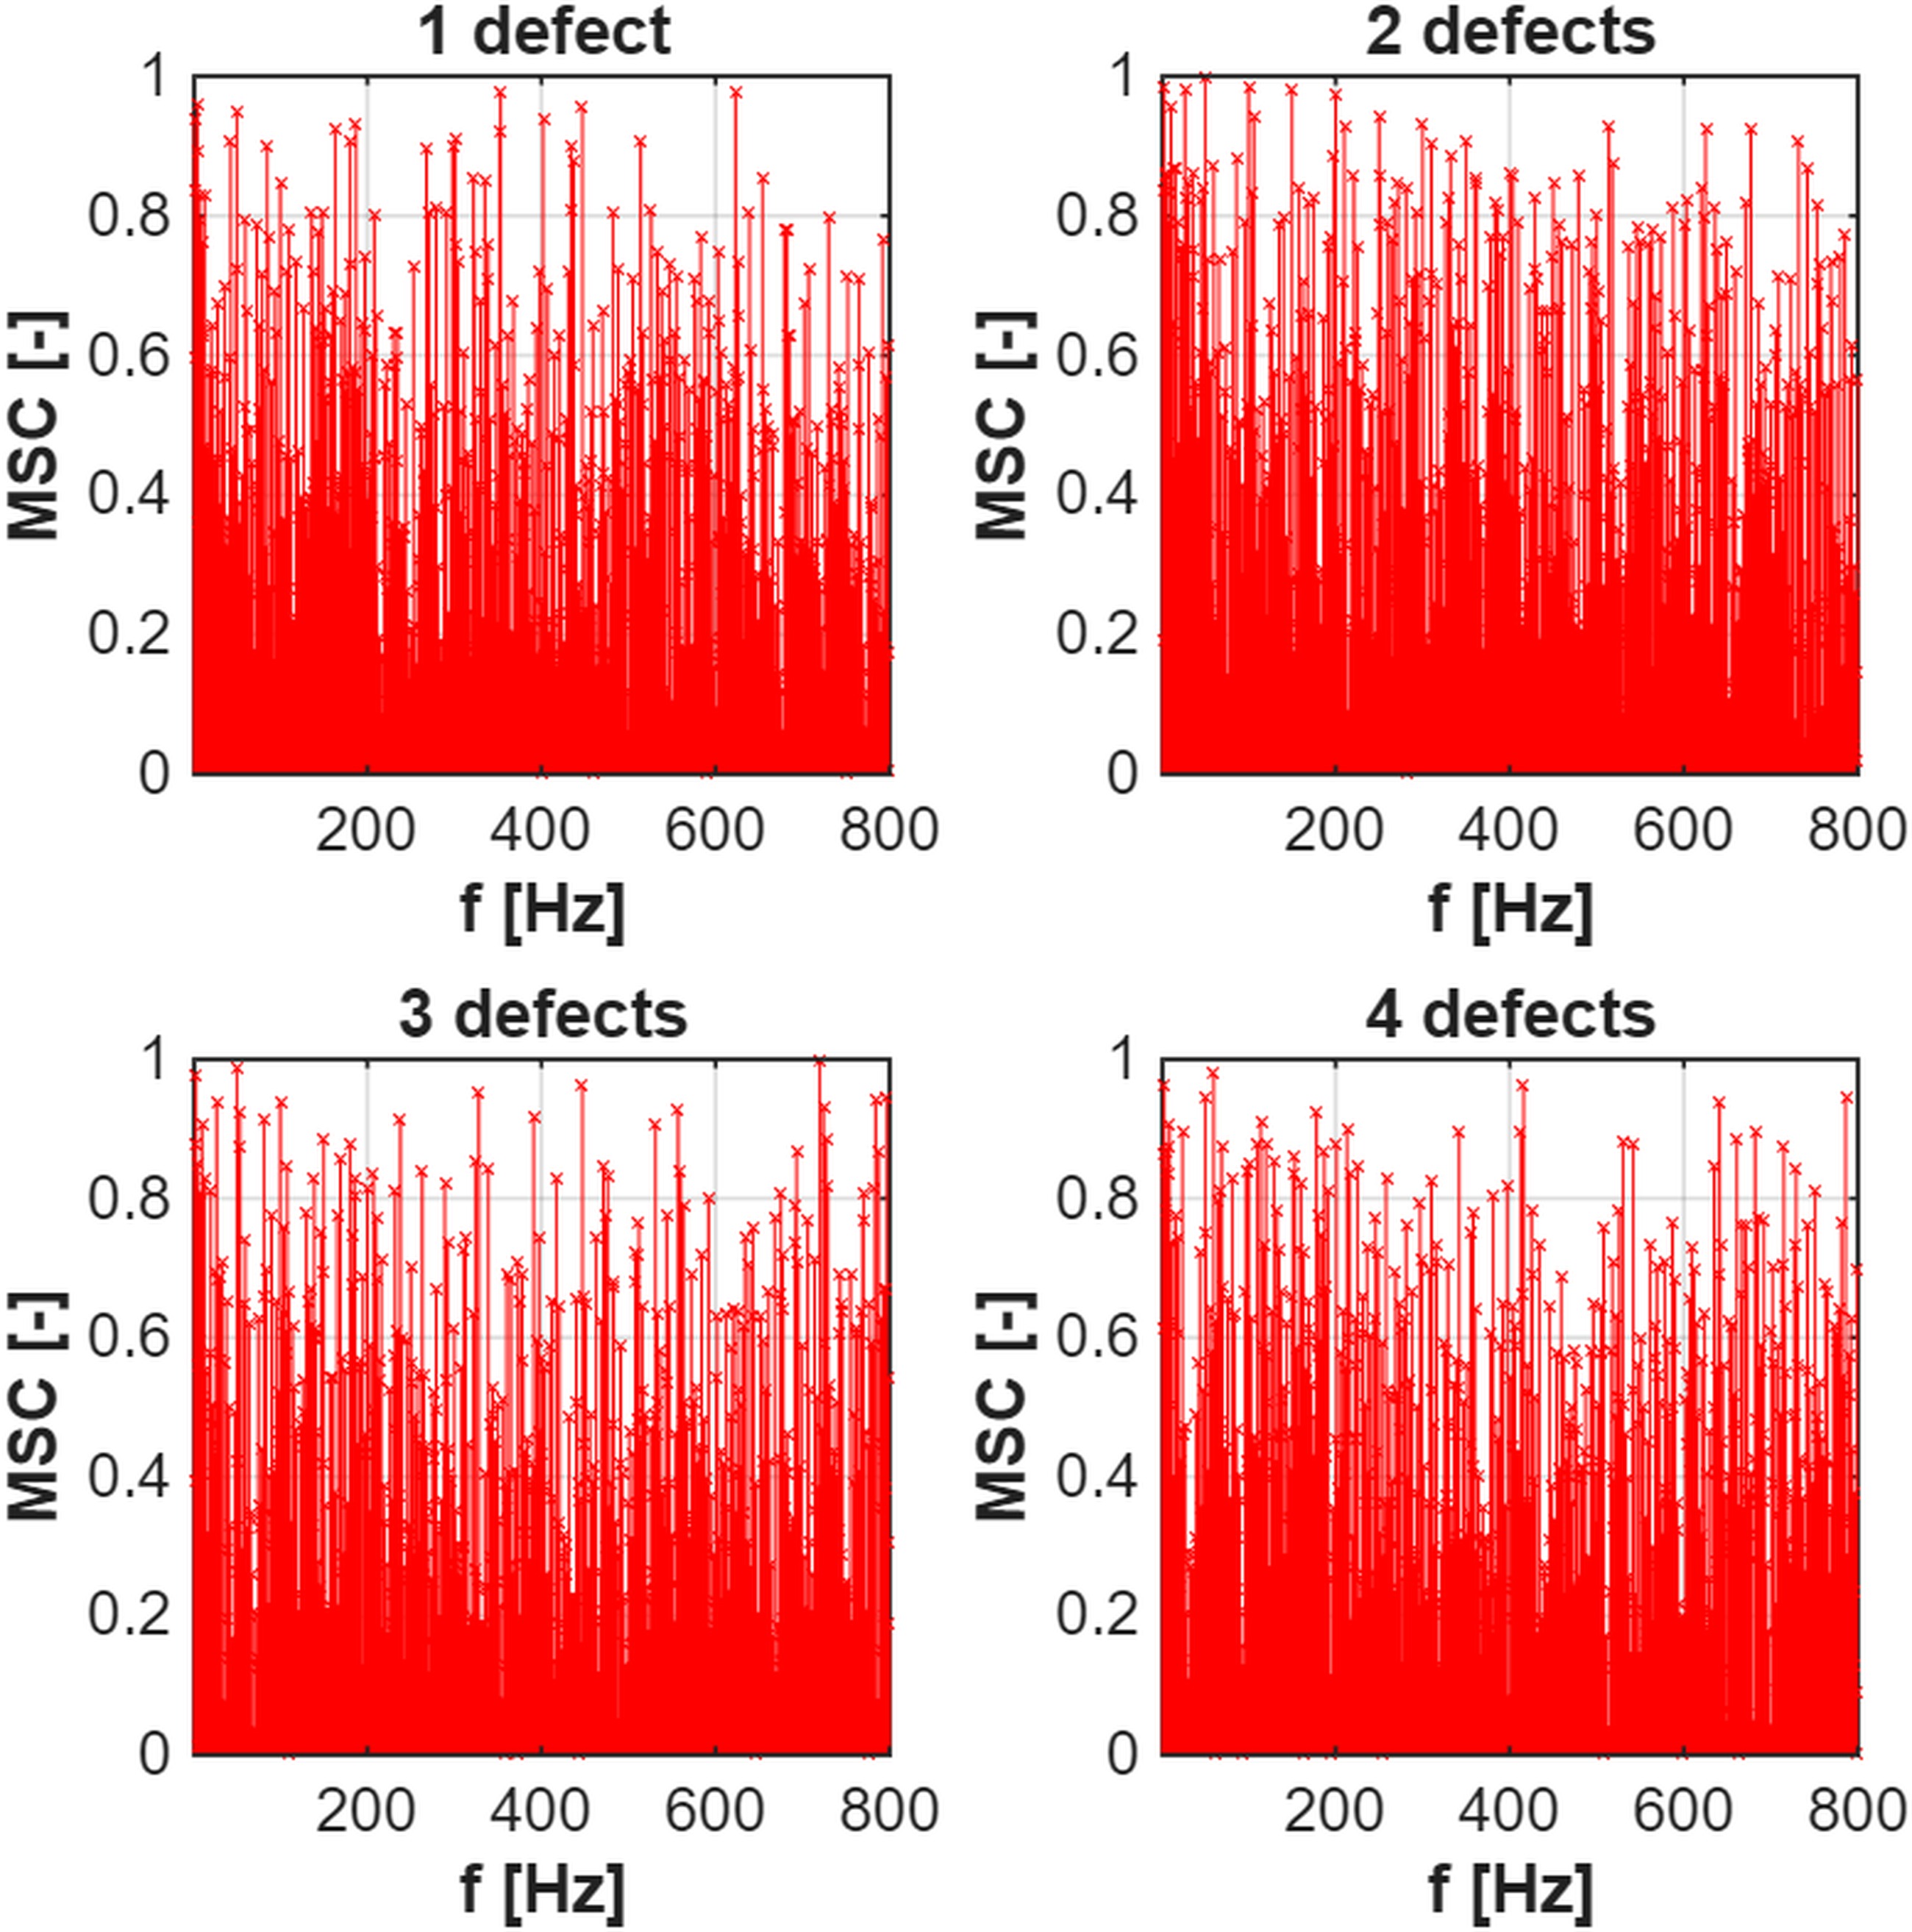
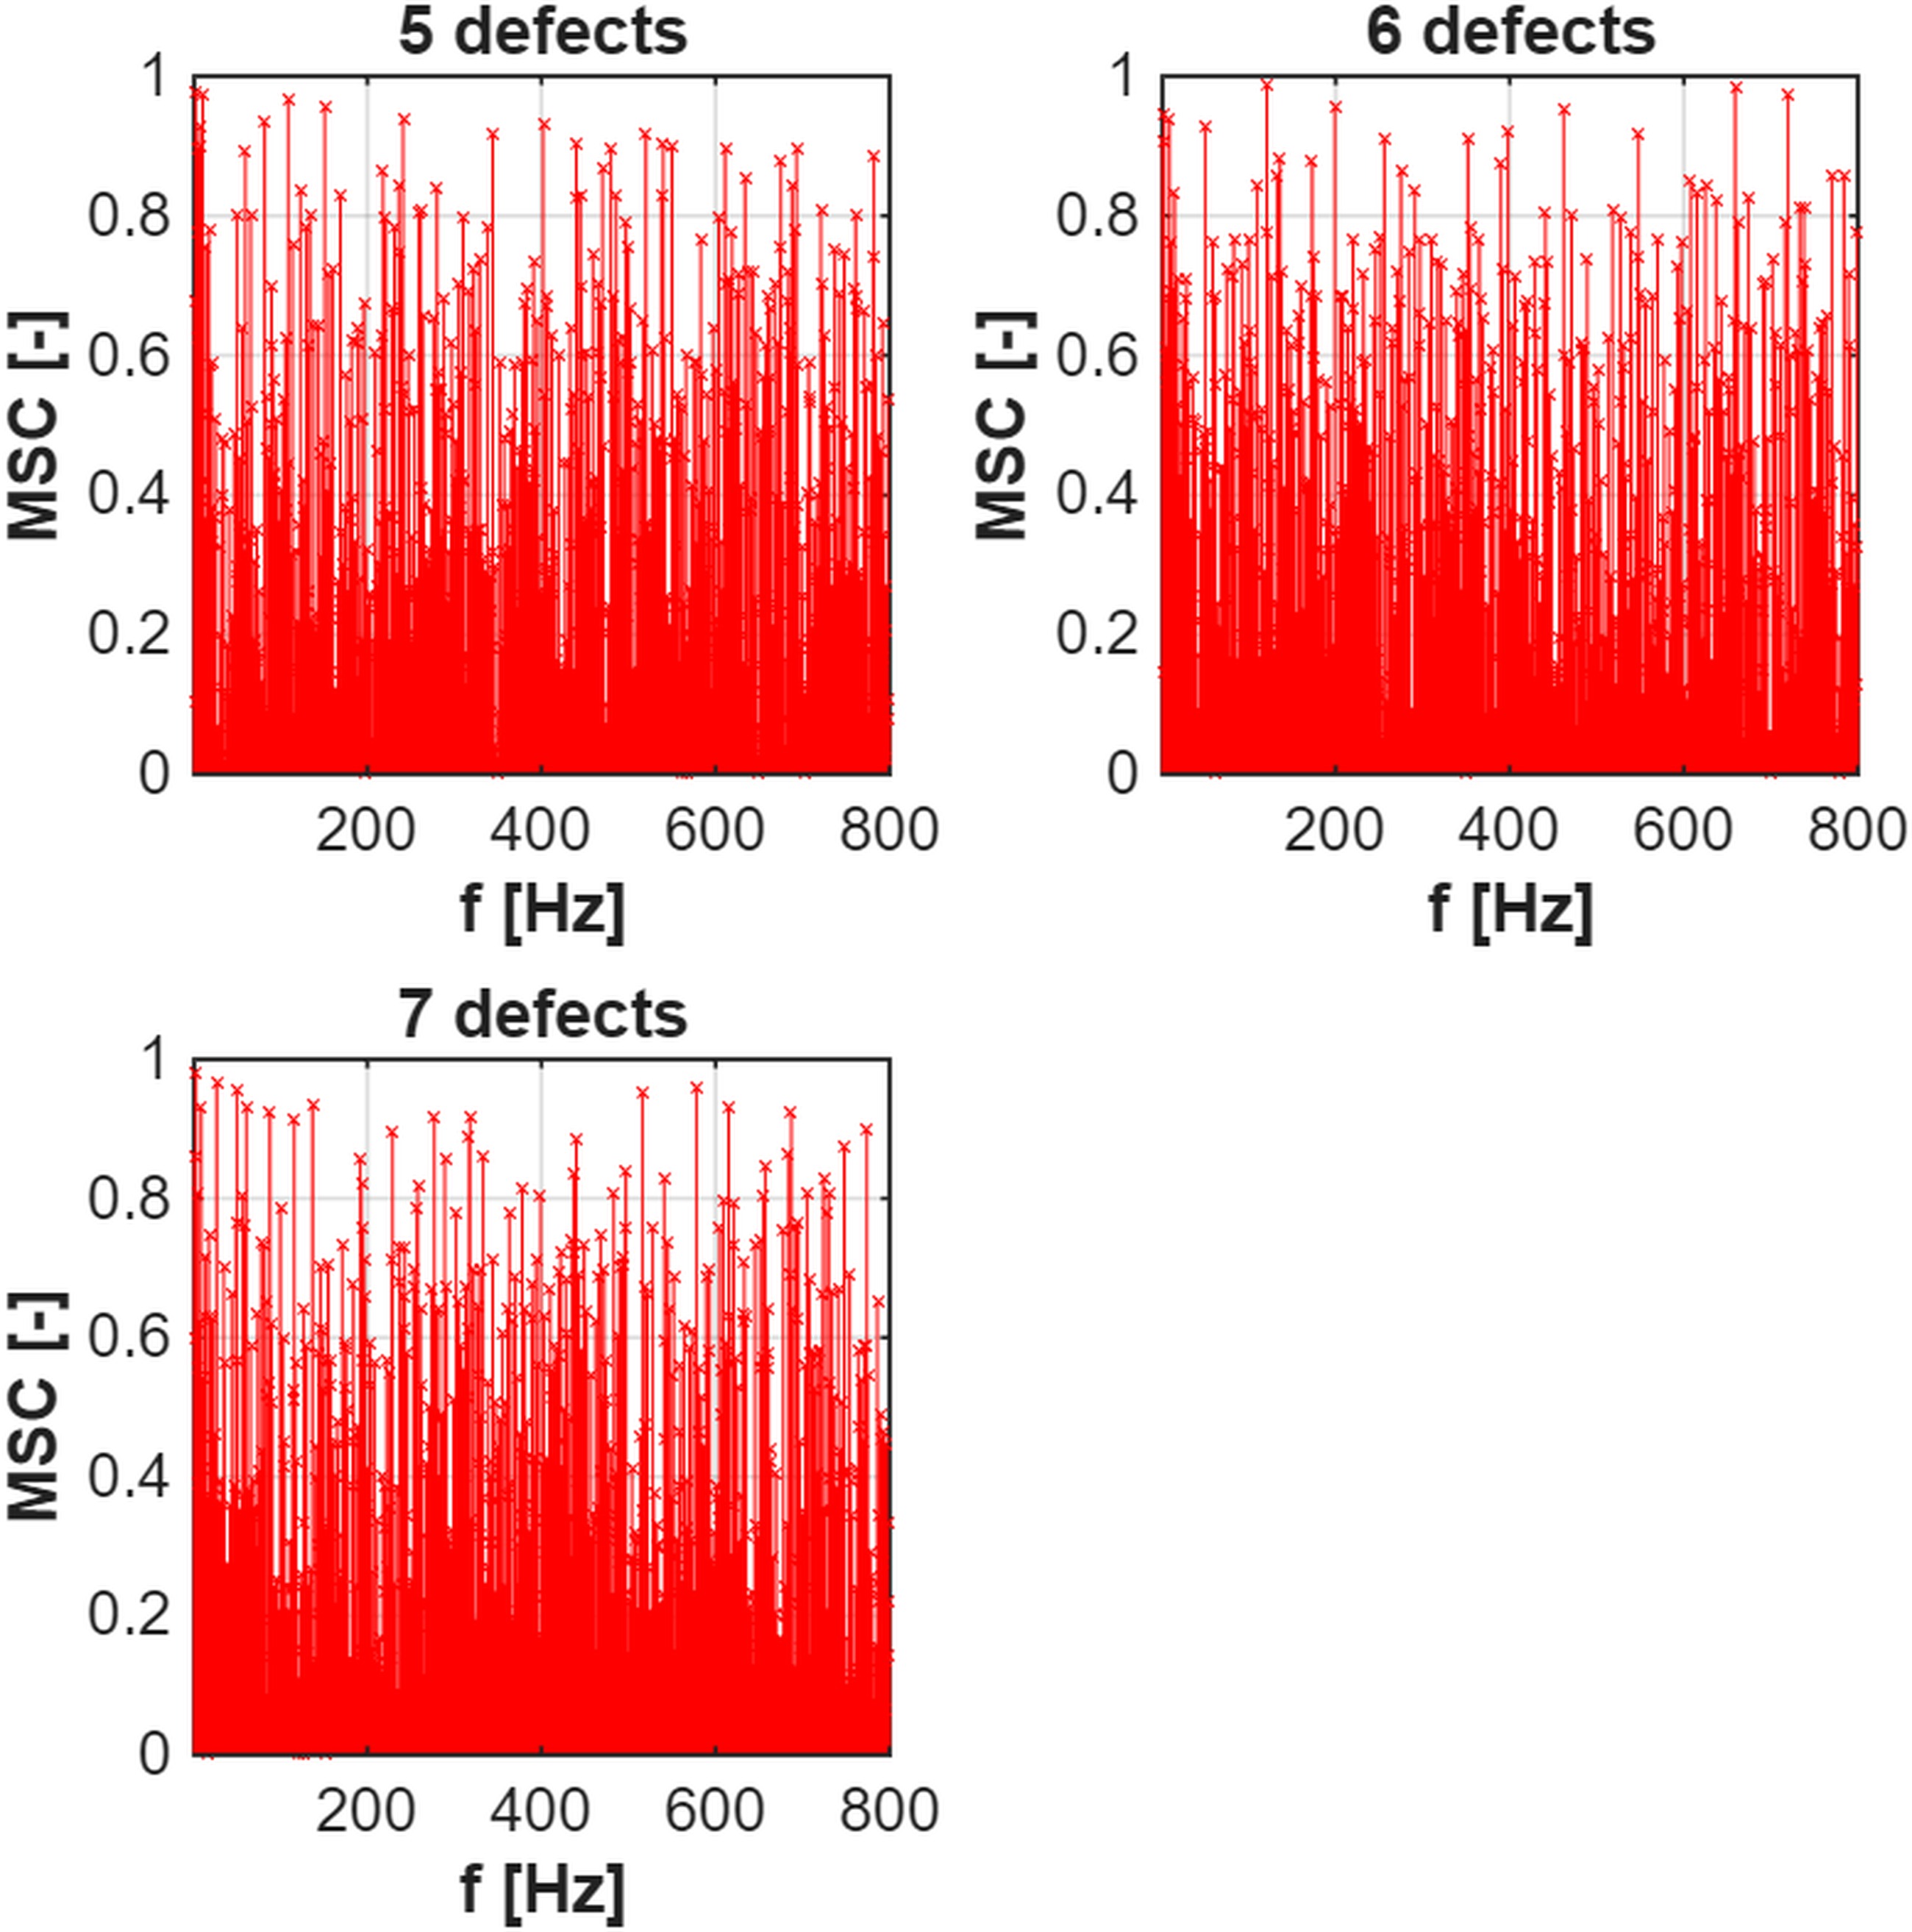
Application of the coherence function
The magnitude square coherence for the amplitude of the output torque [Nm] was calculated using MATLAB mscohere function. No gradual dependence was observed in the coherence functions presented in Figures 10 and 11. The coherence function yields values in the range from 0 to 1, which reflect the similarity between the harmonic components of the healthy gearbox signal and those of the defective gearbox signal.
Analysis of Power Spectral Density (PSD)
In the MATLAB environment, the PSD was computed for each measured signal using the pwelch function.
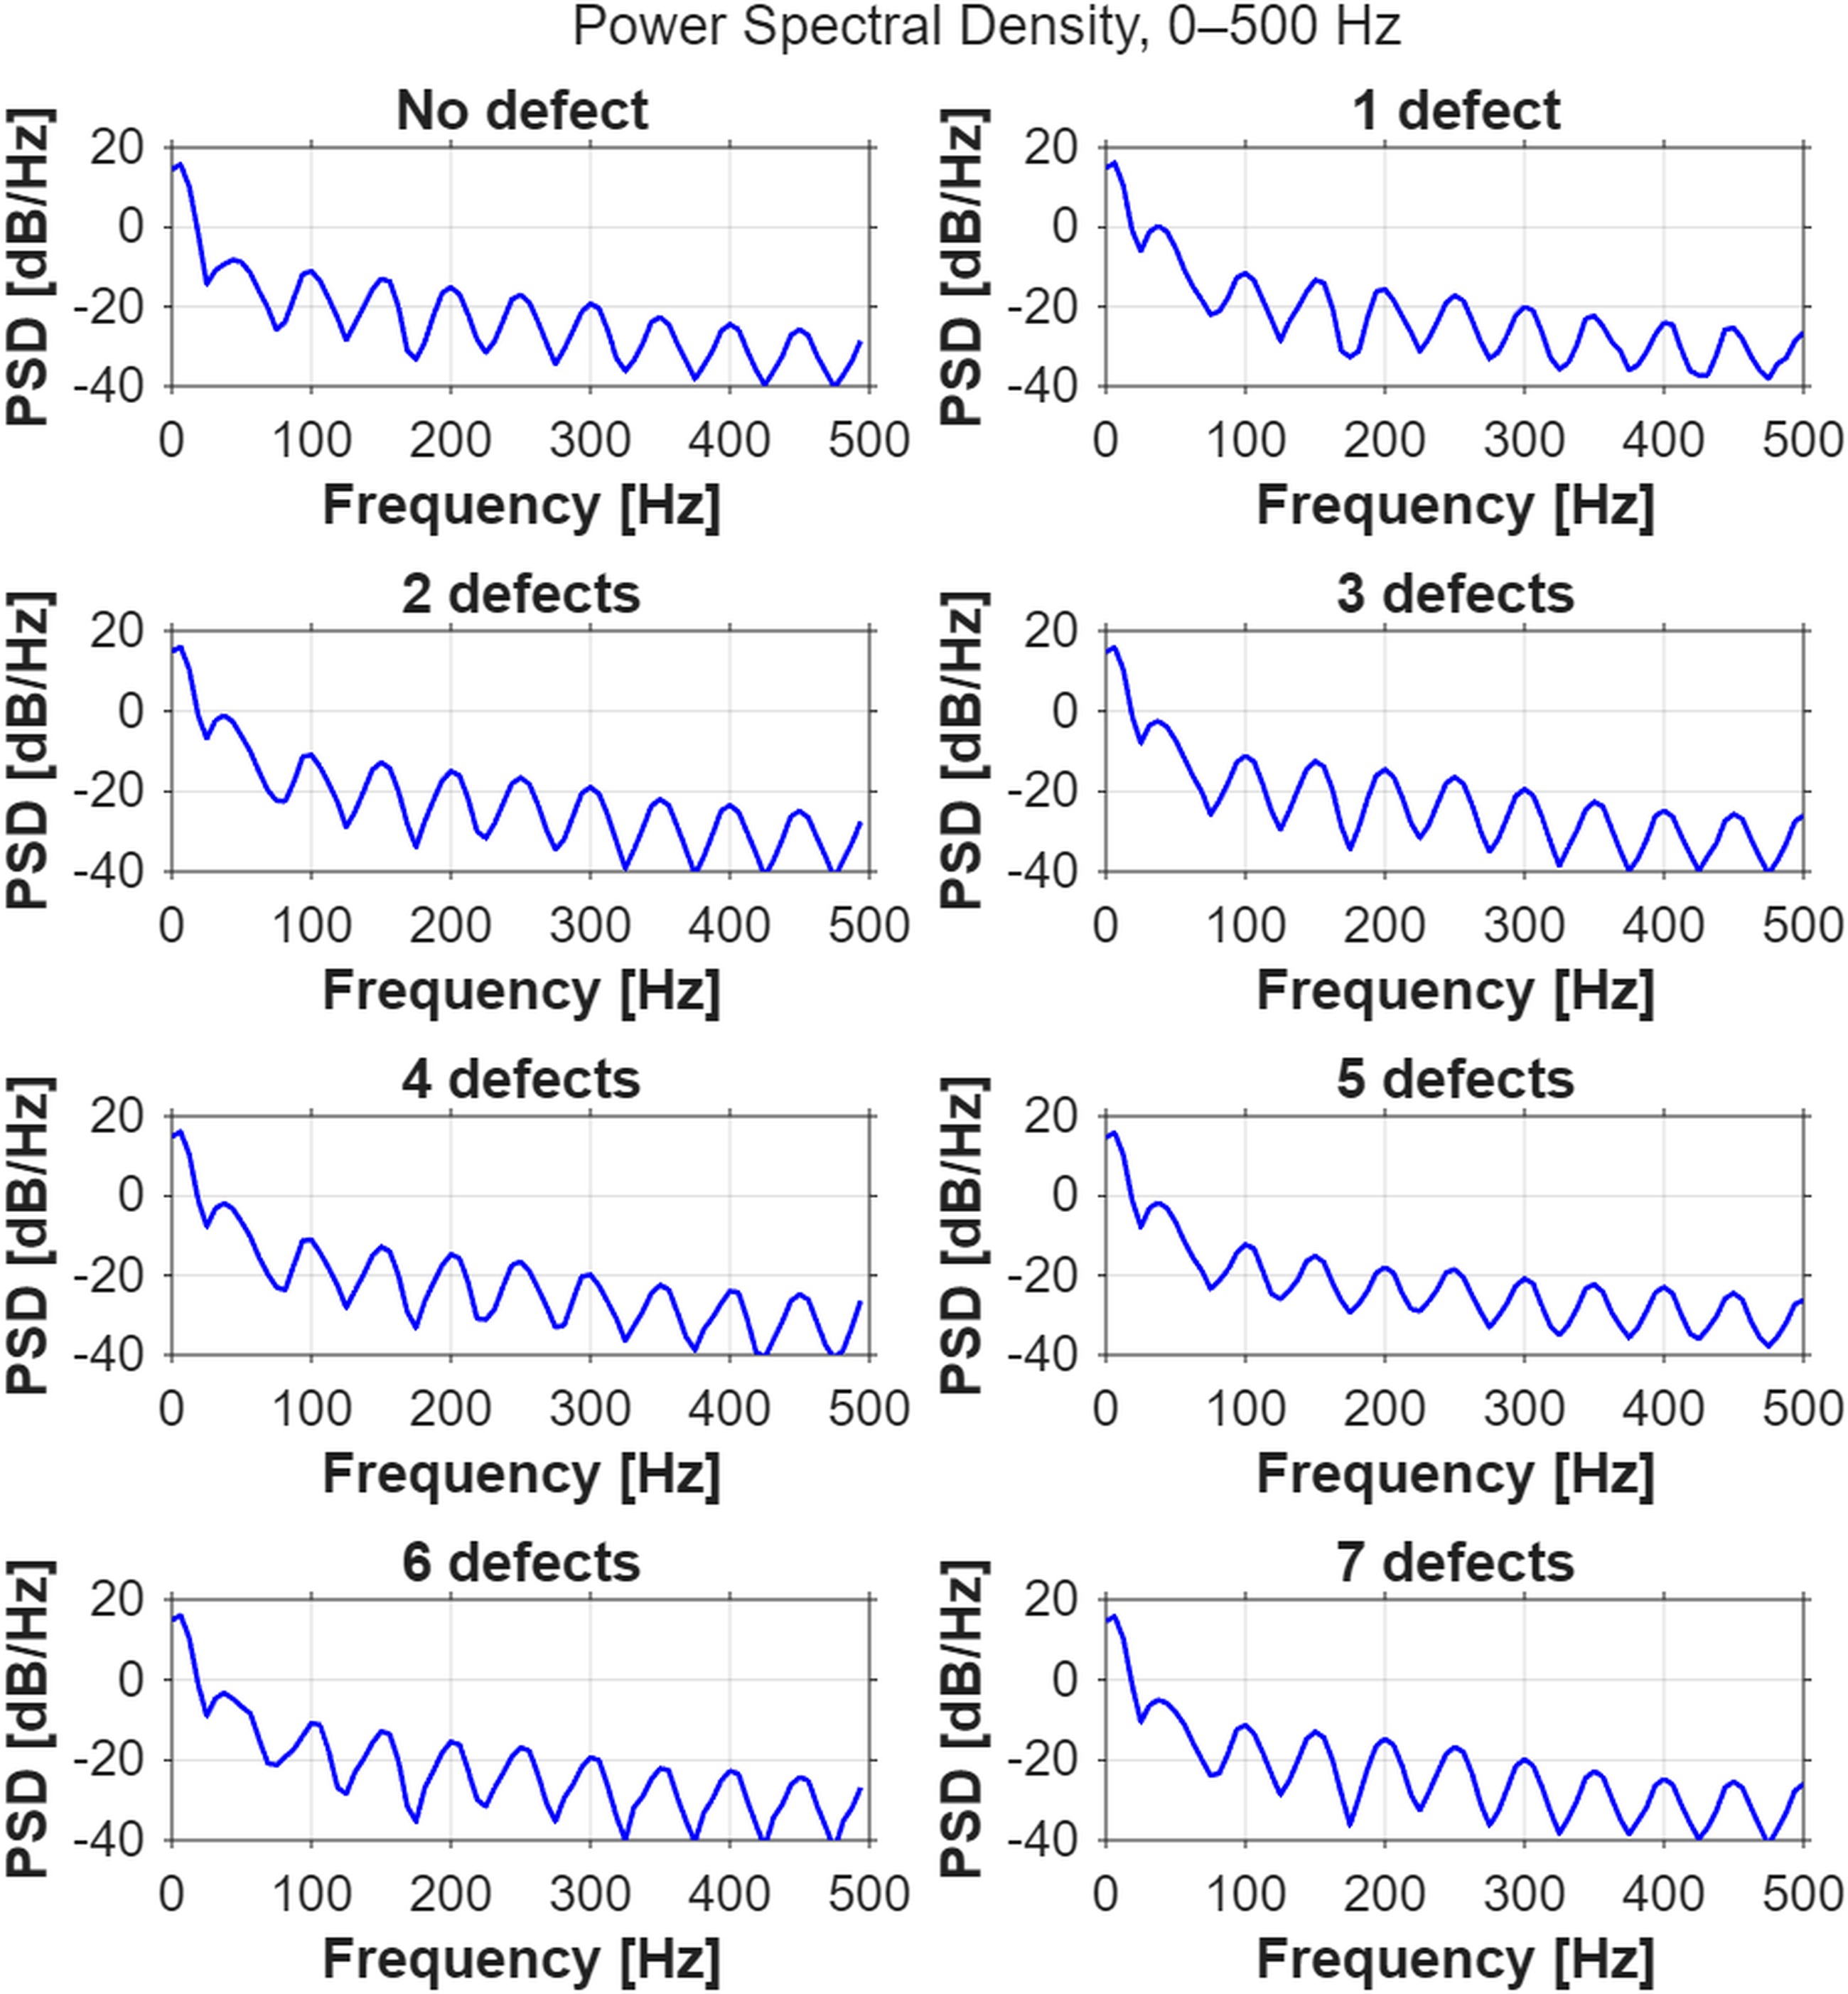
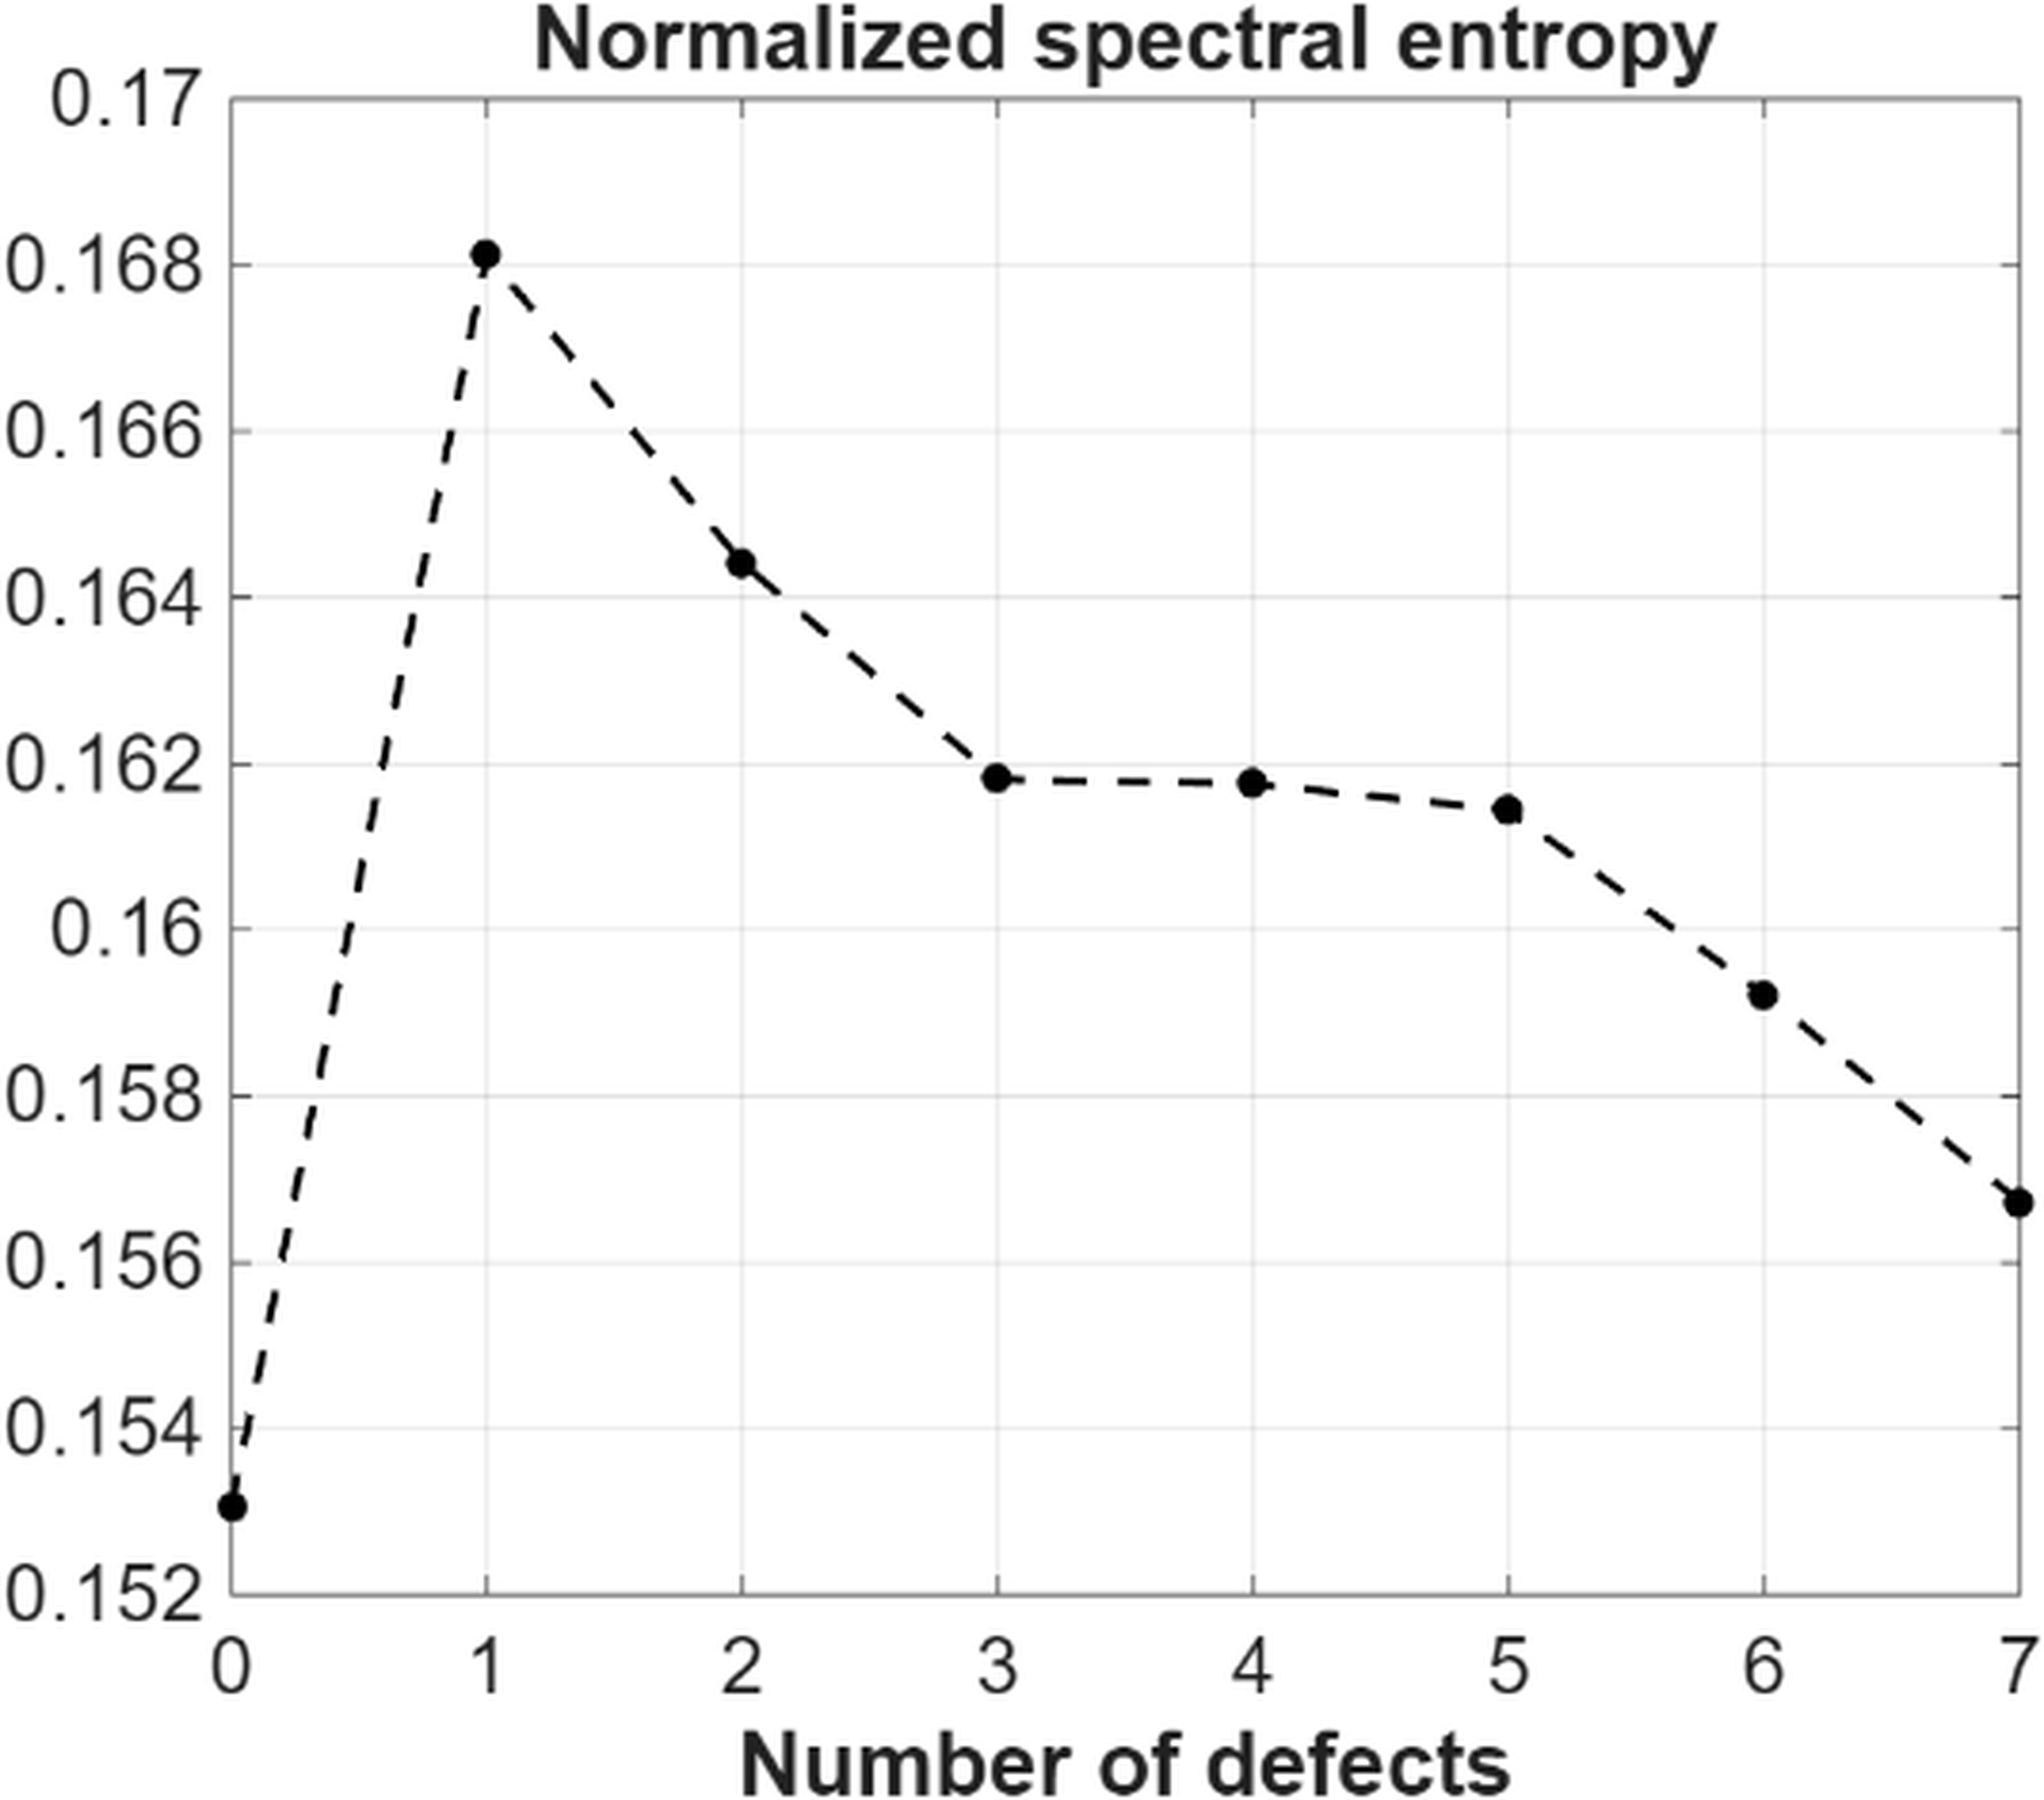
The PSD plots do not exhibit gradual features that could be used to determine the number of defects. However, the spectral entropy computed using Equations (4)-(7) proved to be effective in identifying the number of defects present in the measured signal.
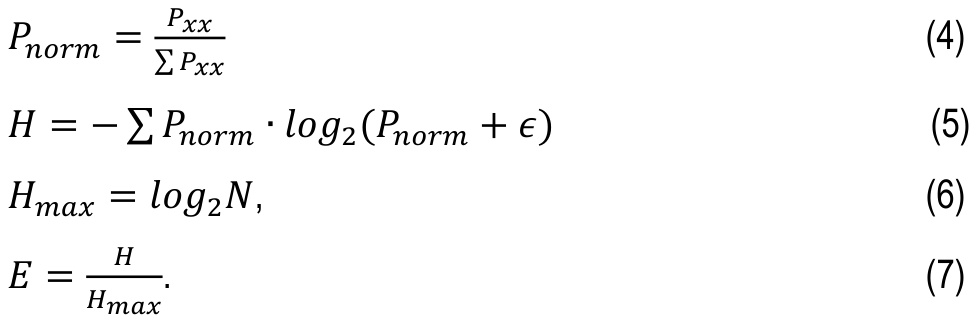
where: Pxx – denotes the PSD (Figure 12), Pnorm – is the normalized PSD, ϵ- is a small constant introduced to avoid taking the logarithm of zero, H – represents the spectral entropy, Hmax – is the maximum possible entropy, and E – is normalized entropy.
The calculated entropy values enable correct identification of the number of defects; however, for cases with three and four defects, the differences between the normalized entropy values are negligible.
Methods using roll-off and centroid of PSD
It was assumed that increase in medium frequency of each time window indicate appearance of the high frequencies, which indicate emergence of defects. The rise in centroid will indicate, that signal energy shifts towards the high frequencies. The second indicator, Roll-off 95% is the boundary frequency. Below this value 95% of the signal energy is concentrated. The red, dashed line in Figure 14 is the Roll-off 95% value versus time. The rise in roll-off 95% allow for detection of the high frequencies that emerge in the signal. This can be caused by the appearance of high frequencies due to defects.
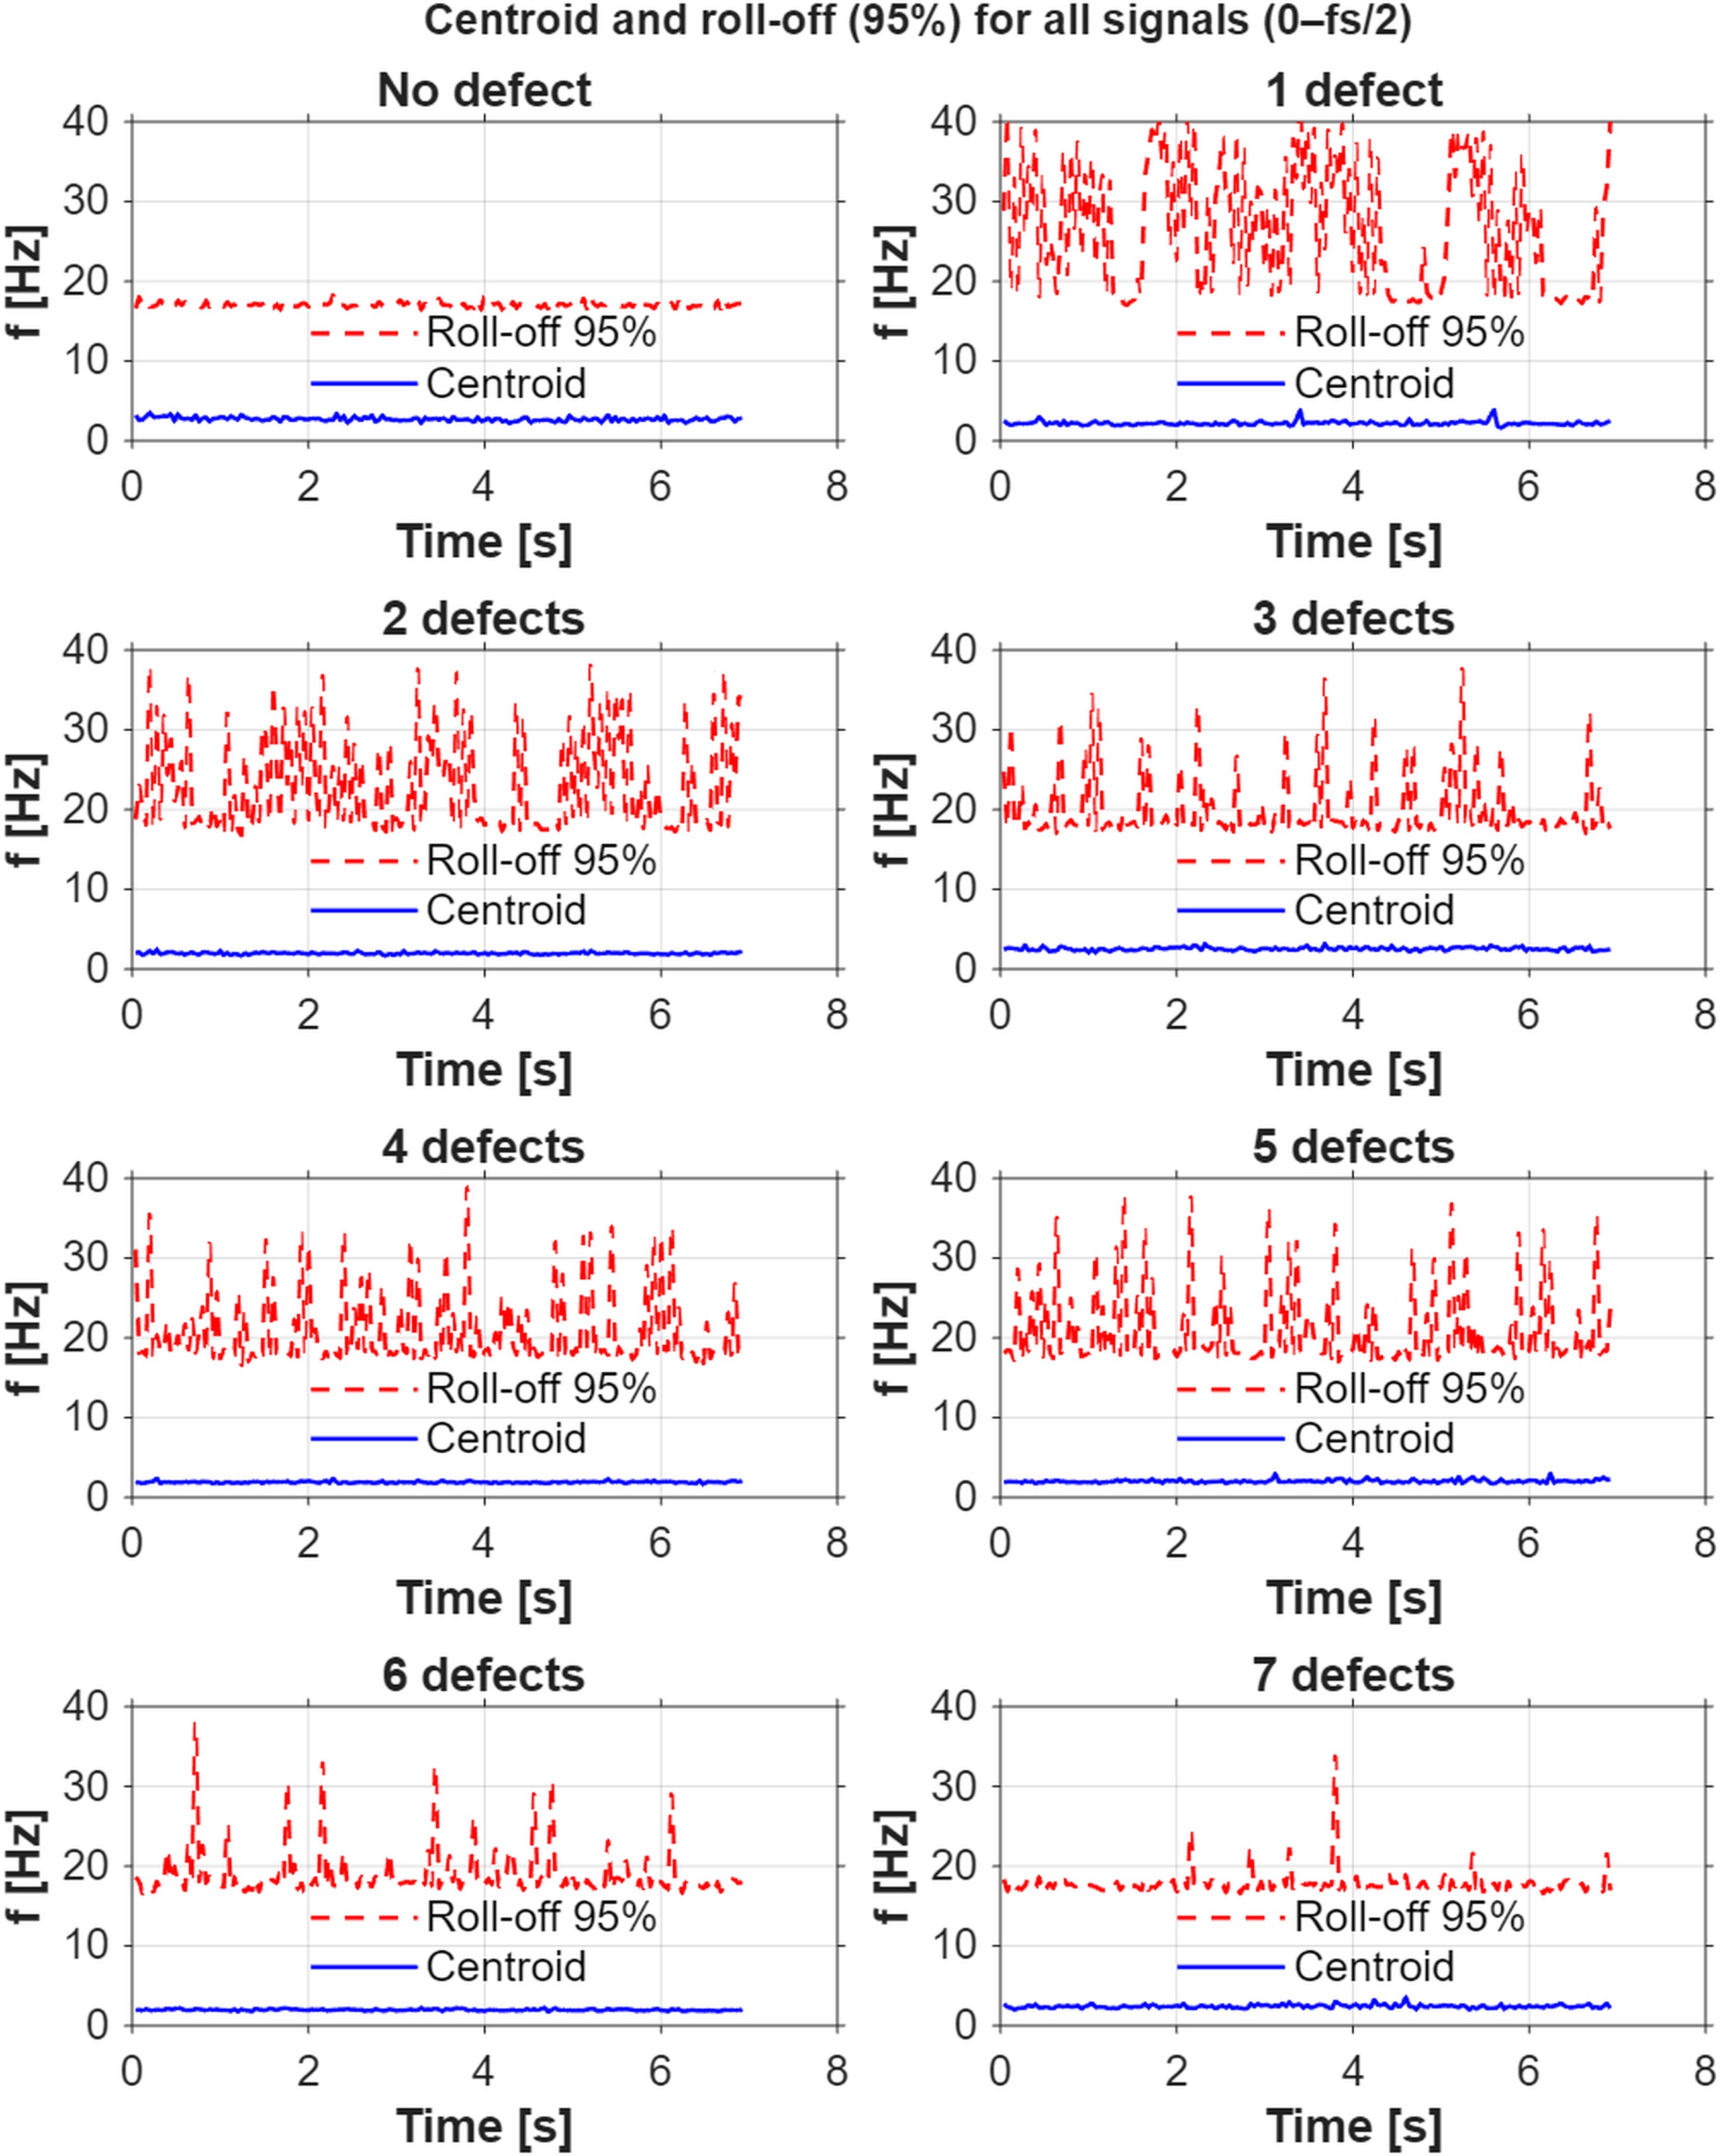
Representative centroid values for the healthy gearbox and for configurations with 1-7 defects are listed in Table 5.
Tab. 5
Exemplary centroid values from Figure 14.
Number of defects | Centroid value |
0 | 2.82 |
1 | 2.241 |
2 | 1.88 |
3 | 2.95 |
4 | 1.8 |
5 | 2.06 |
6 | 1.88 |
7 | 2.27 |
There is no clear or gradual dependence between the spectral centroid and the number of defects in the gearbox. Similarly, the roll-off frequency does not exhibit features that would allow determination of the number of defects based on the occupied frequency range.
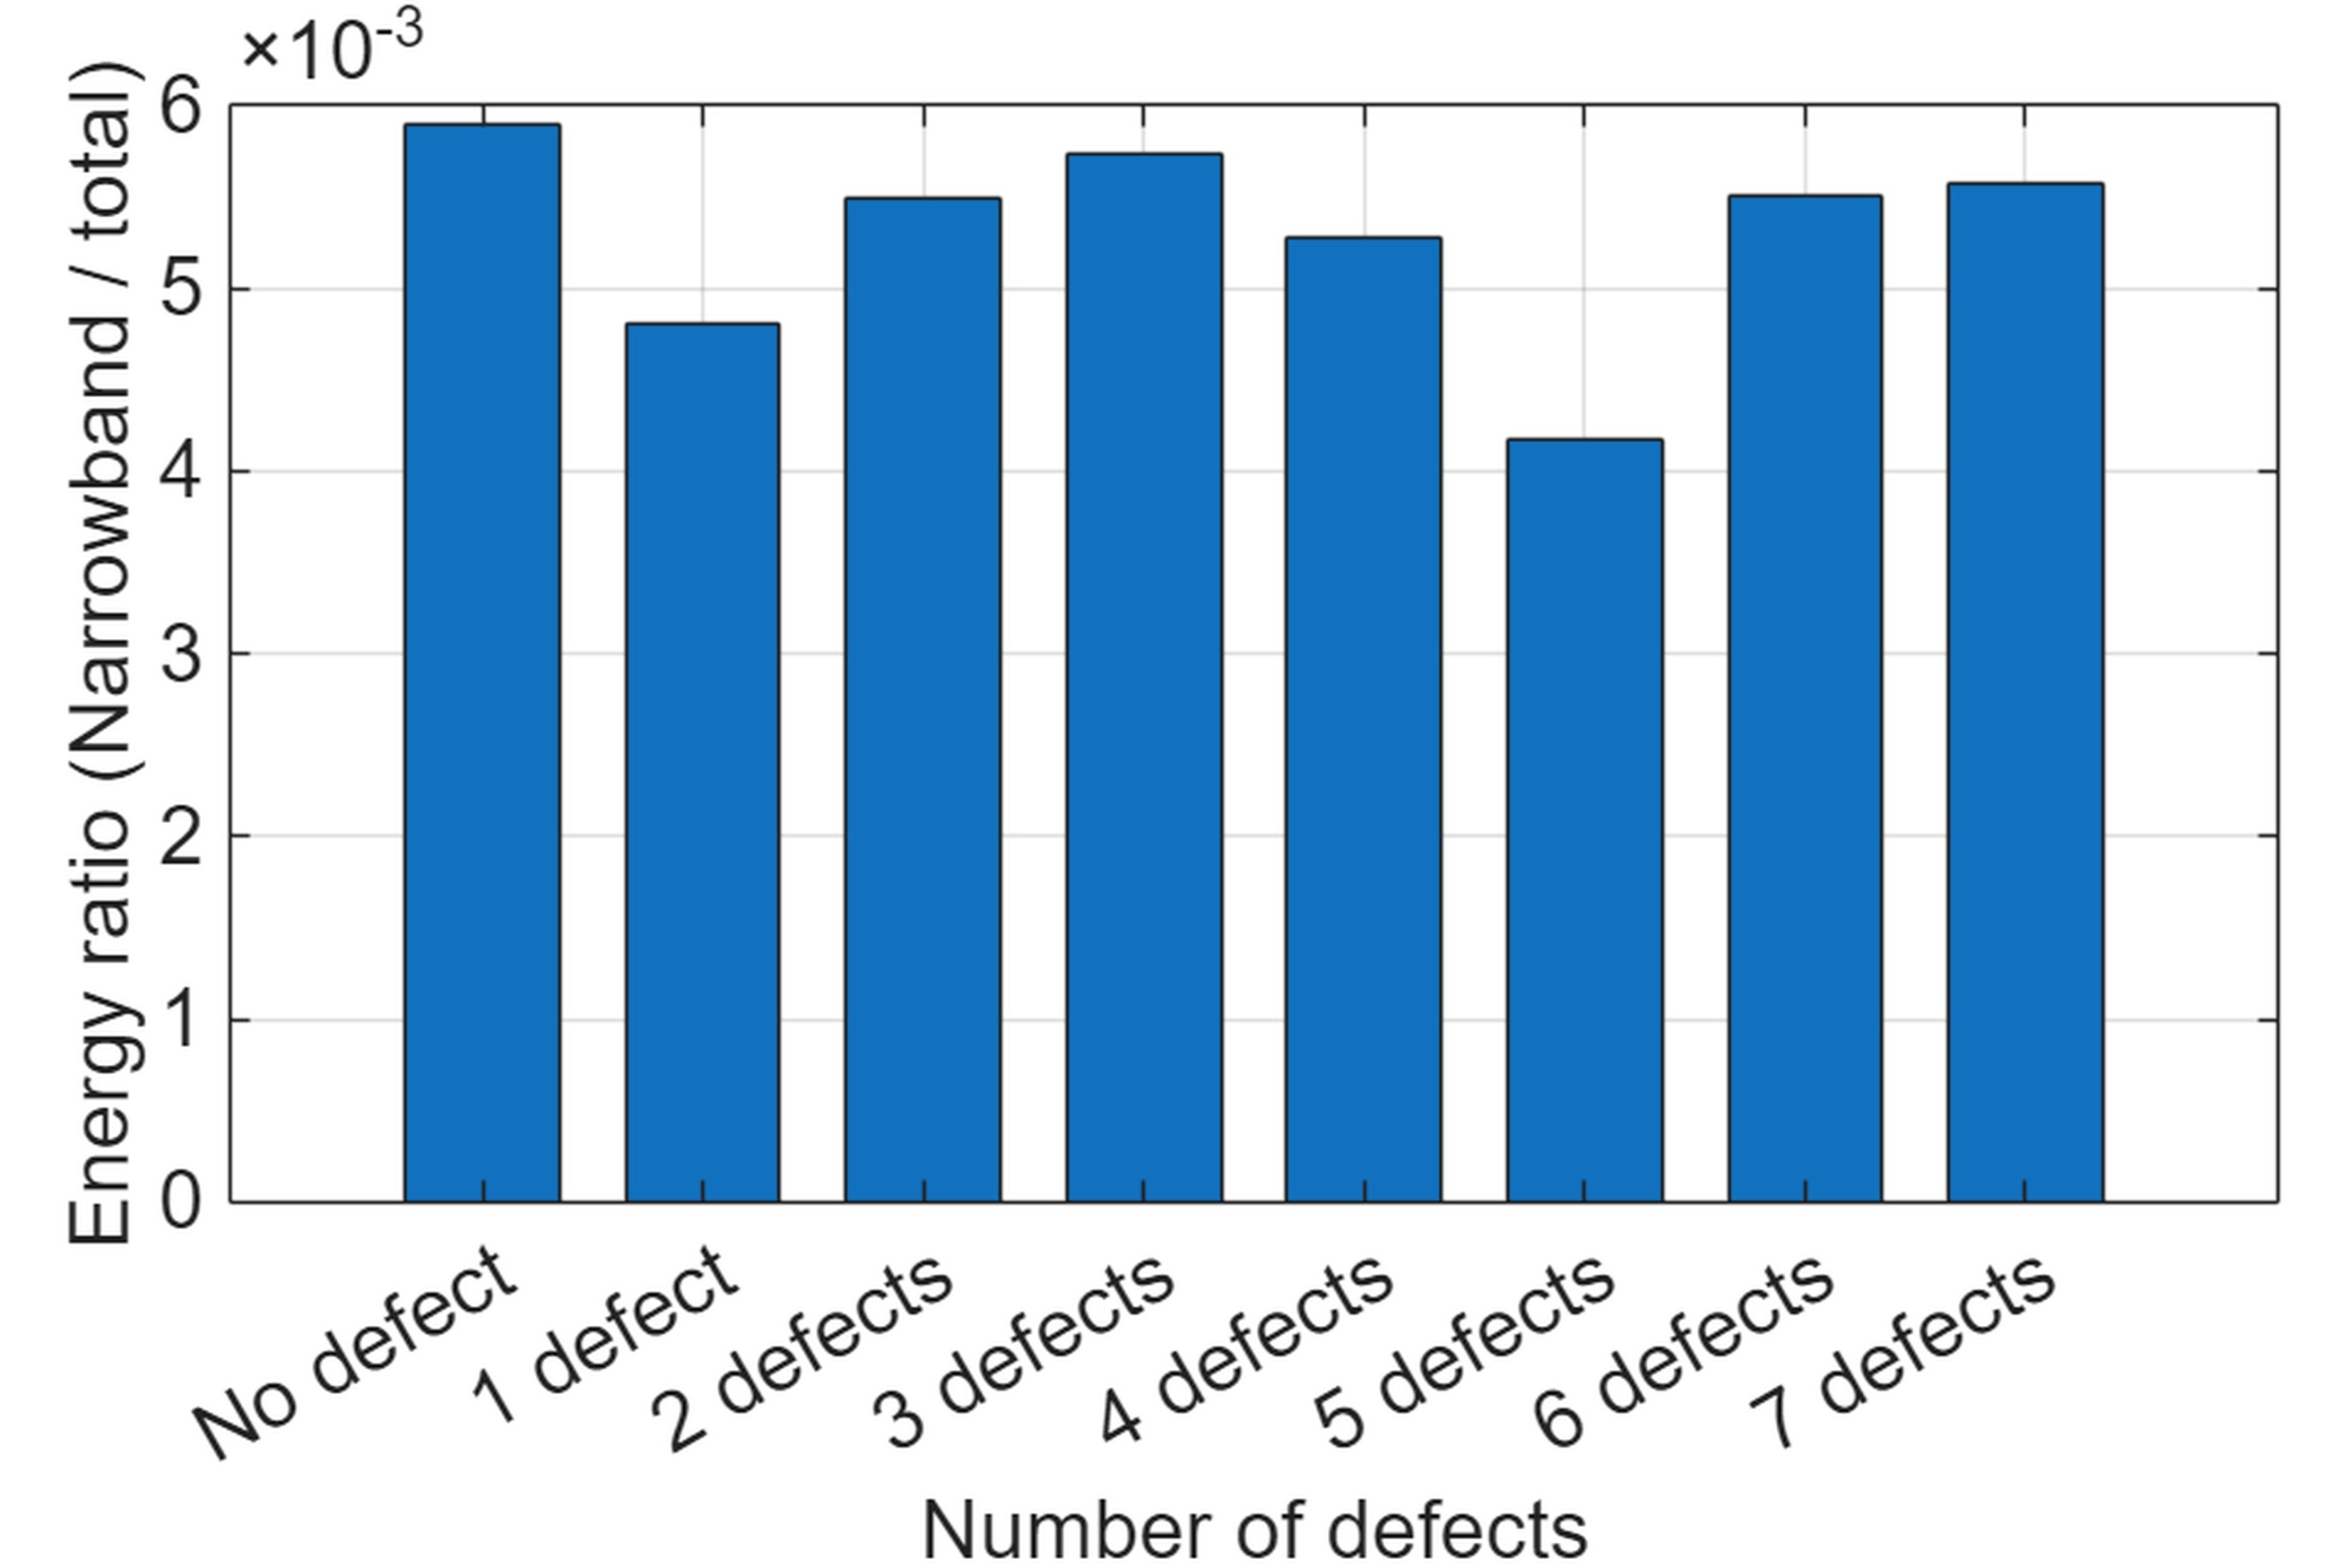
Searching for the narrowband-to-wideband energy ratios
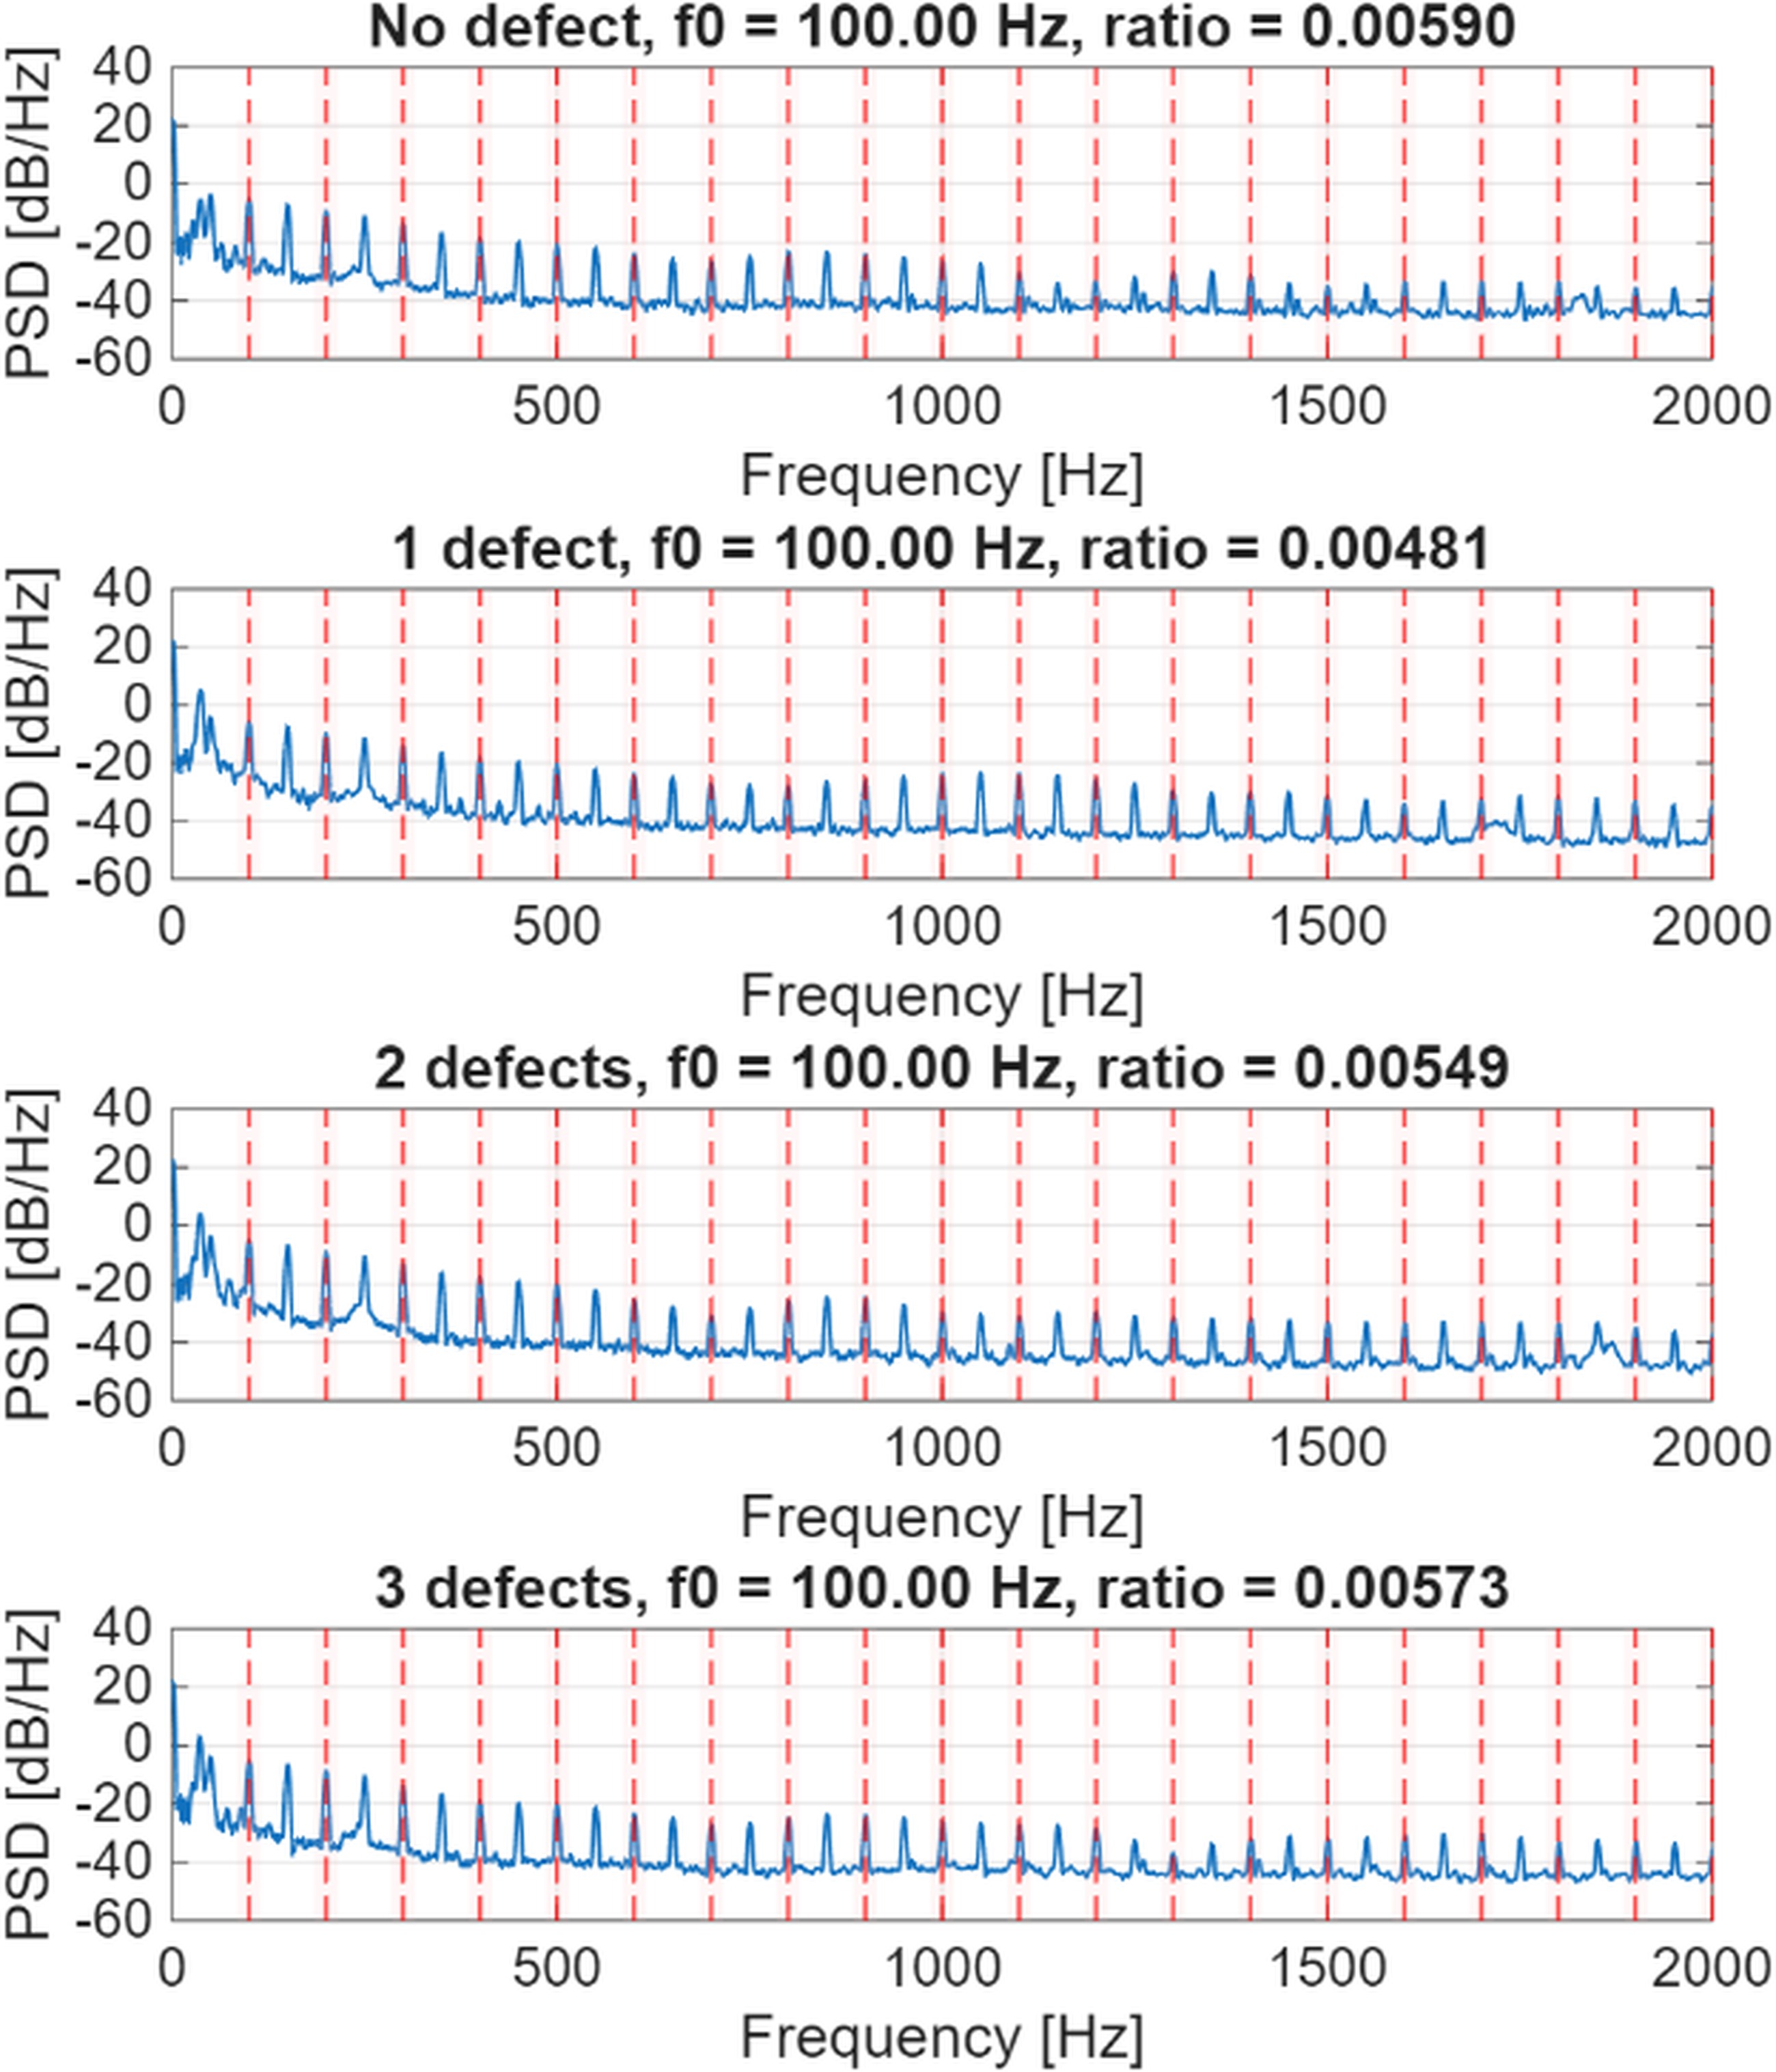
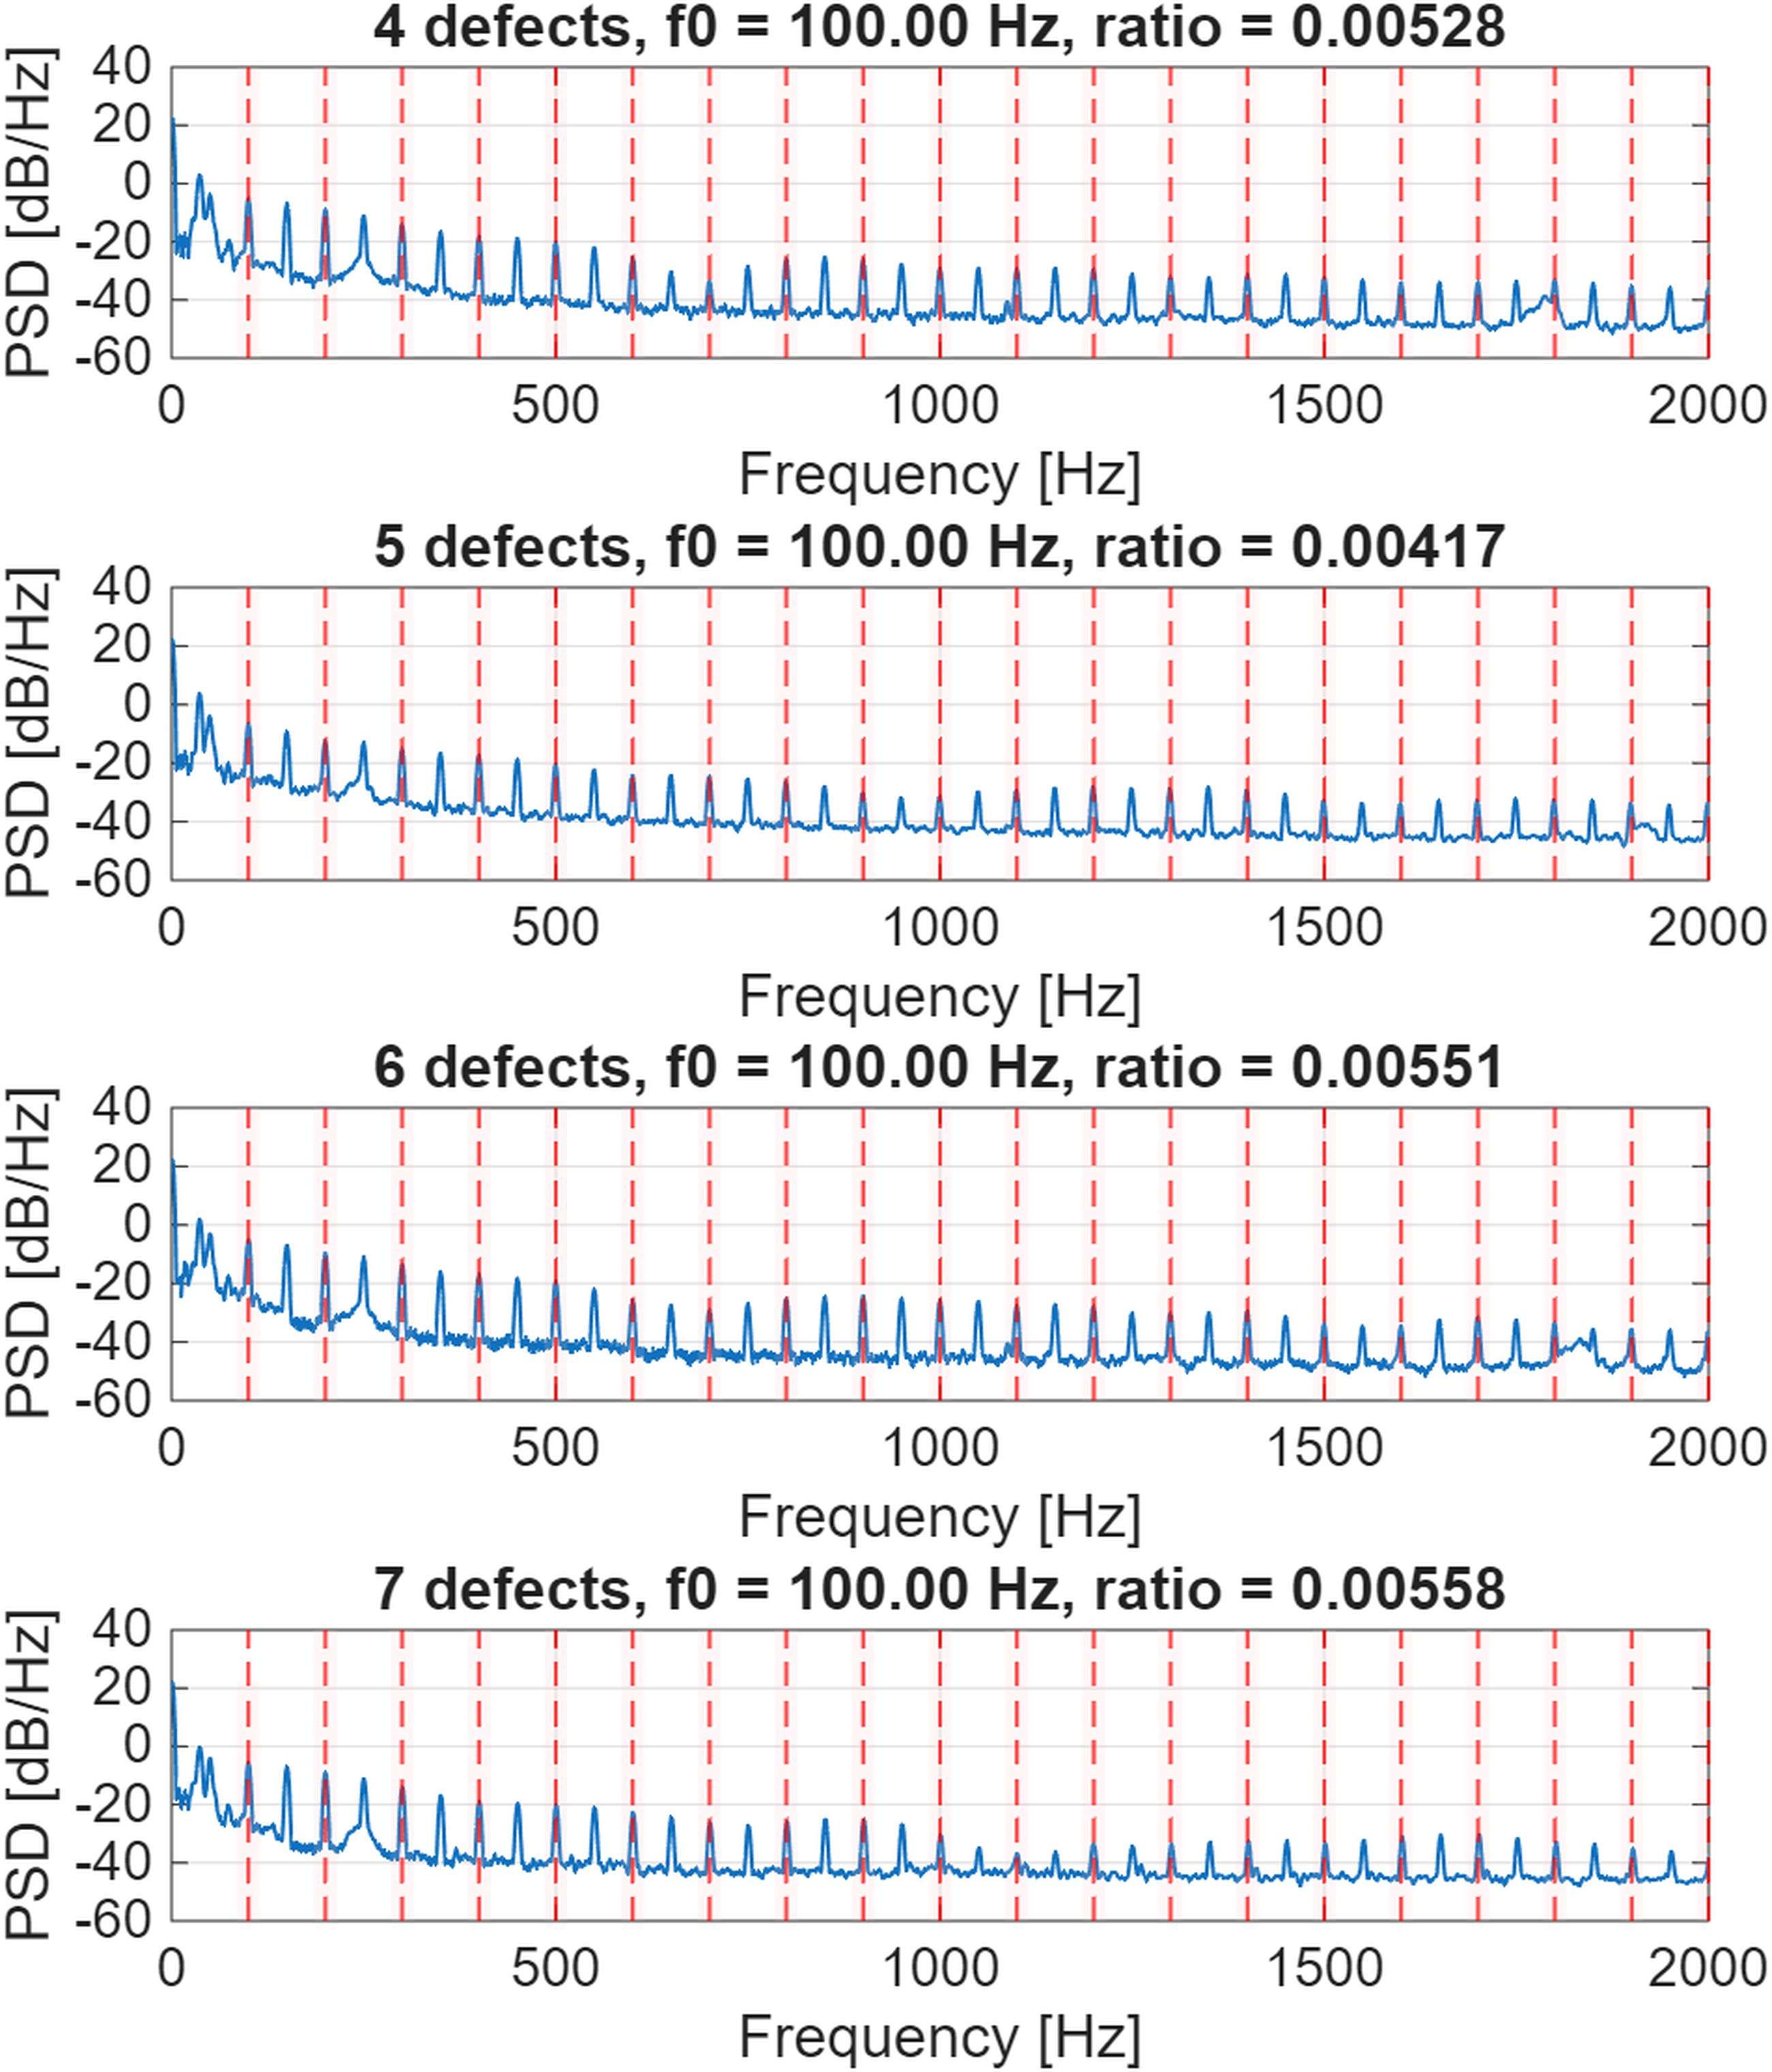
An important feature of the PSD in fault diagnosis is localization of spectral energy within harmonic components or narrow frequency bands. For periodic signals, energy is primarily concentrated in harmonic components; however, in gearboxes, defects may cause an increase in spectral energy within narrowbands, leading to a broader PSD. Therefore, it is useful to examine the ratio of narrowband energy to the total signal energy. The base frequency for the harmonics was set to f0=100 Hz, and the harmonic energy was computed for frequencies equal to n∙f0, where n is an integer. The calculated energy ratios are presented for each case in Figure 16, and their values are additionally summarized in the bar chart shown in Figure 17.
There is also no gradual dependence between the number of defects and the data presented in Figure 16. Consequently, it is not possible to determine the number of defects based on the energy ratio.
Analysis of spectral flatness and application of spectral entropy
Figure 13 presents the normalized entropy results. In this section, Shannon entropy (expressed in bits) and spectral flatness were investigated. Shannon entropy proved capable of classifying the number of defects present in the measured signal. However, in its normalized form, the entropy values for signals with three and four defects were nearly identical. As a result, the differences between these cases are small, and the method may fail under conditions of high noise levels in the measured signals.
Spectral flatness was computed as the ratio of geometric mean to the arithmetic mean of the PSD. Unfortunately, spectral flatness was not able to determine the number of defects in the measured signals.
The Shannon spectral entropy presented in Figure 18 was computed without normalization, according to Equation (8). Spectral flatness was calculated using Equation (9).
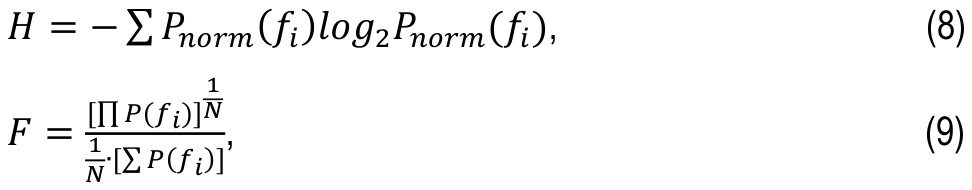
The calculated spectral entropy values are listed in Table 6.
Tab. 6
Spectral entropy values for the measured signals
Number of defects | Spectral Entropy |
0 | 1.6838 |
1 | 1.8495 |
2 | 1.8087 |
3 | 1.7801 |
4 | 1.7794 |
5 | 1.776 |
6 | 1.7516 |
7 | 1.7241 |
Among the investigated methods, Shannon spectral entropy proved to be only reliable approach for determining the number of defects in the measured signals (output torque).
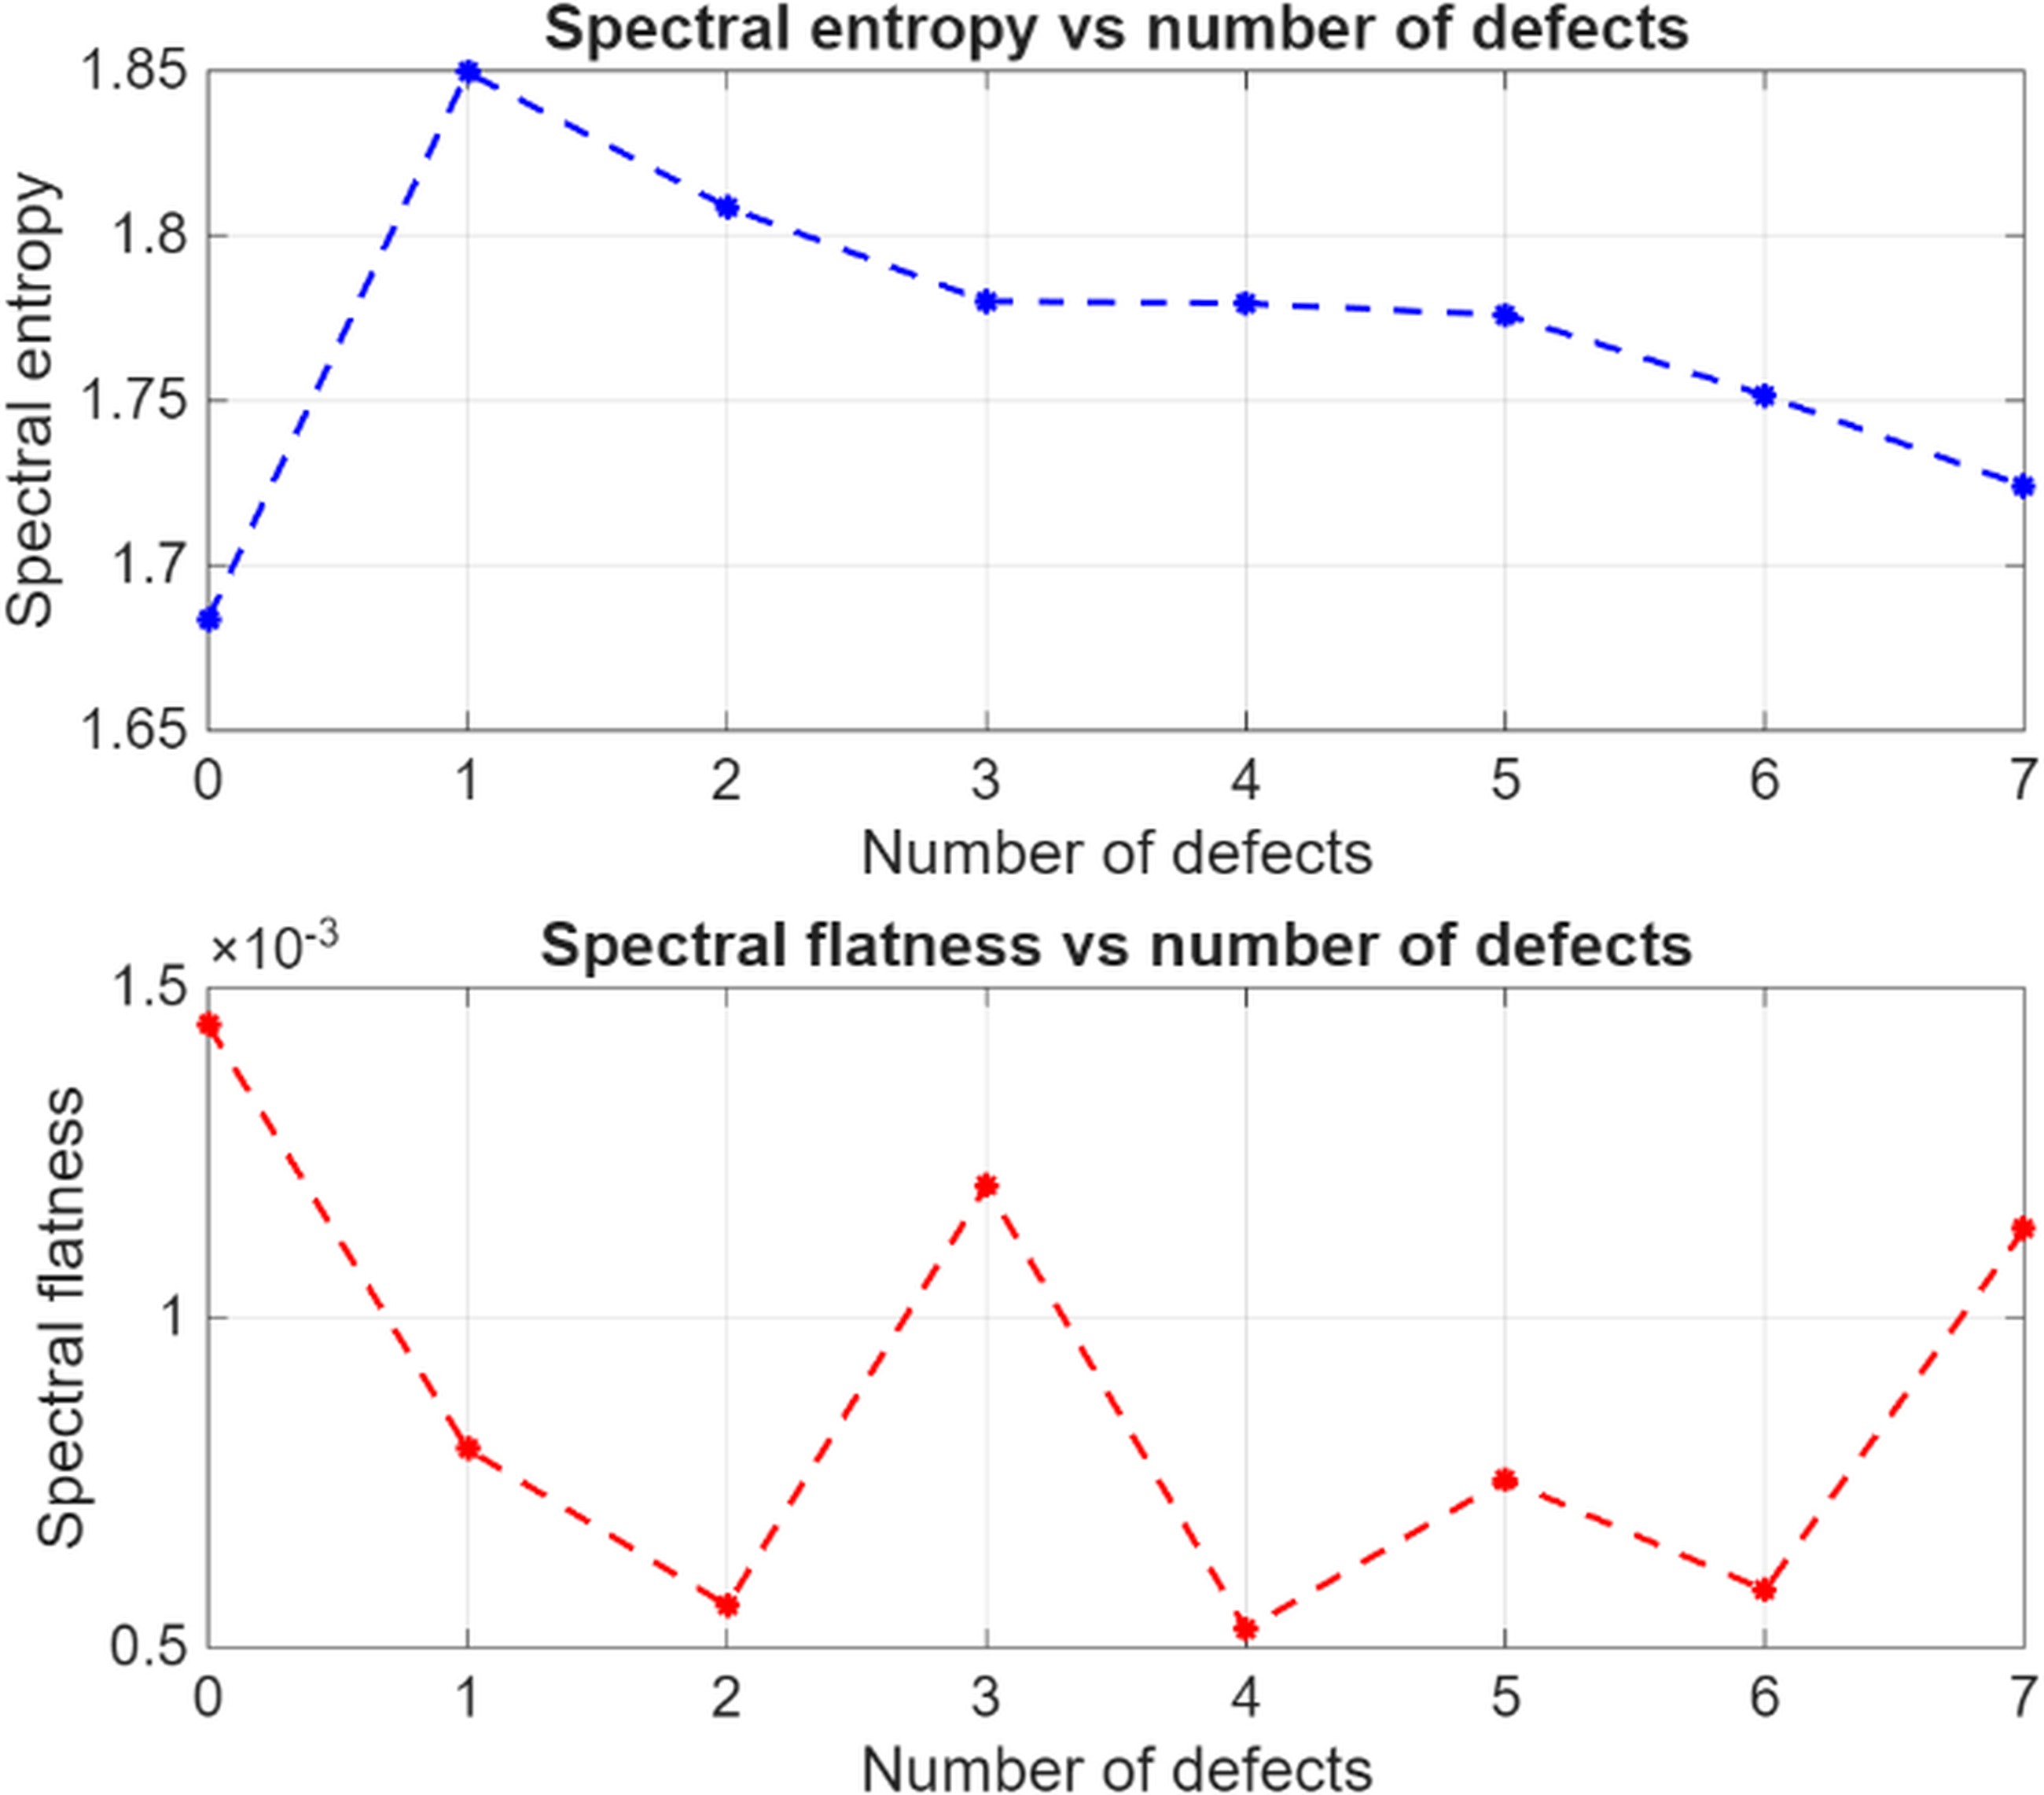
Comparison Of Simulations With Abs And Steel Discs
The simulation data were examined for the strictly monotonically decreasing Shannon spectral entropy. The frequency bands for which this condition was satisfied are presented in Figure 19. The lower limits of the bands are connected by a blue dashed line, while the upper limits are marked with a red dashed line.
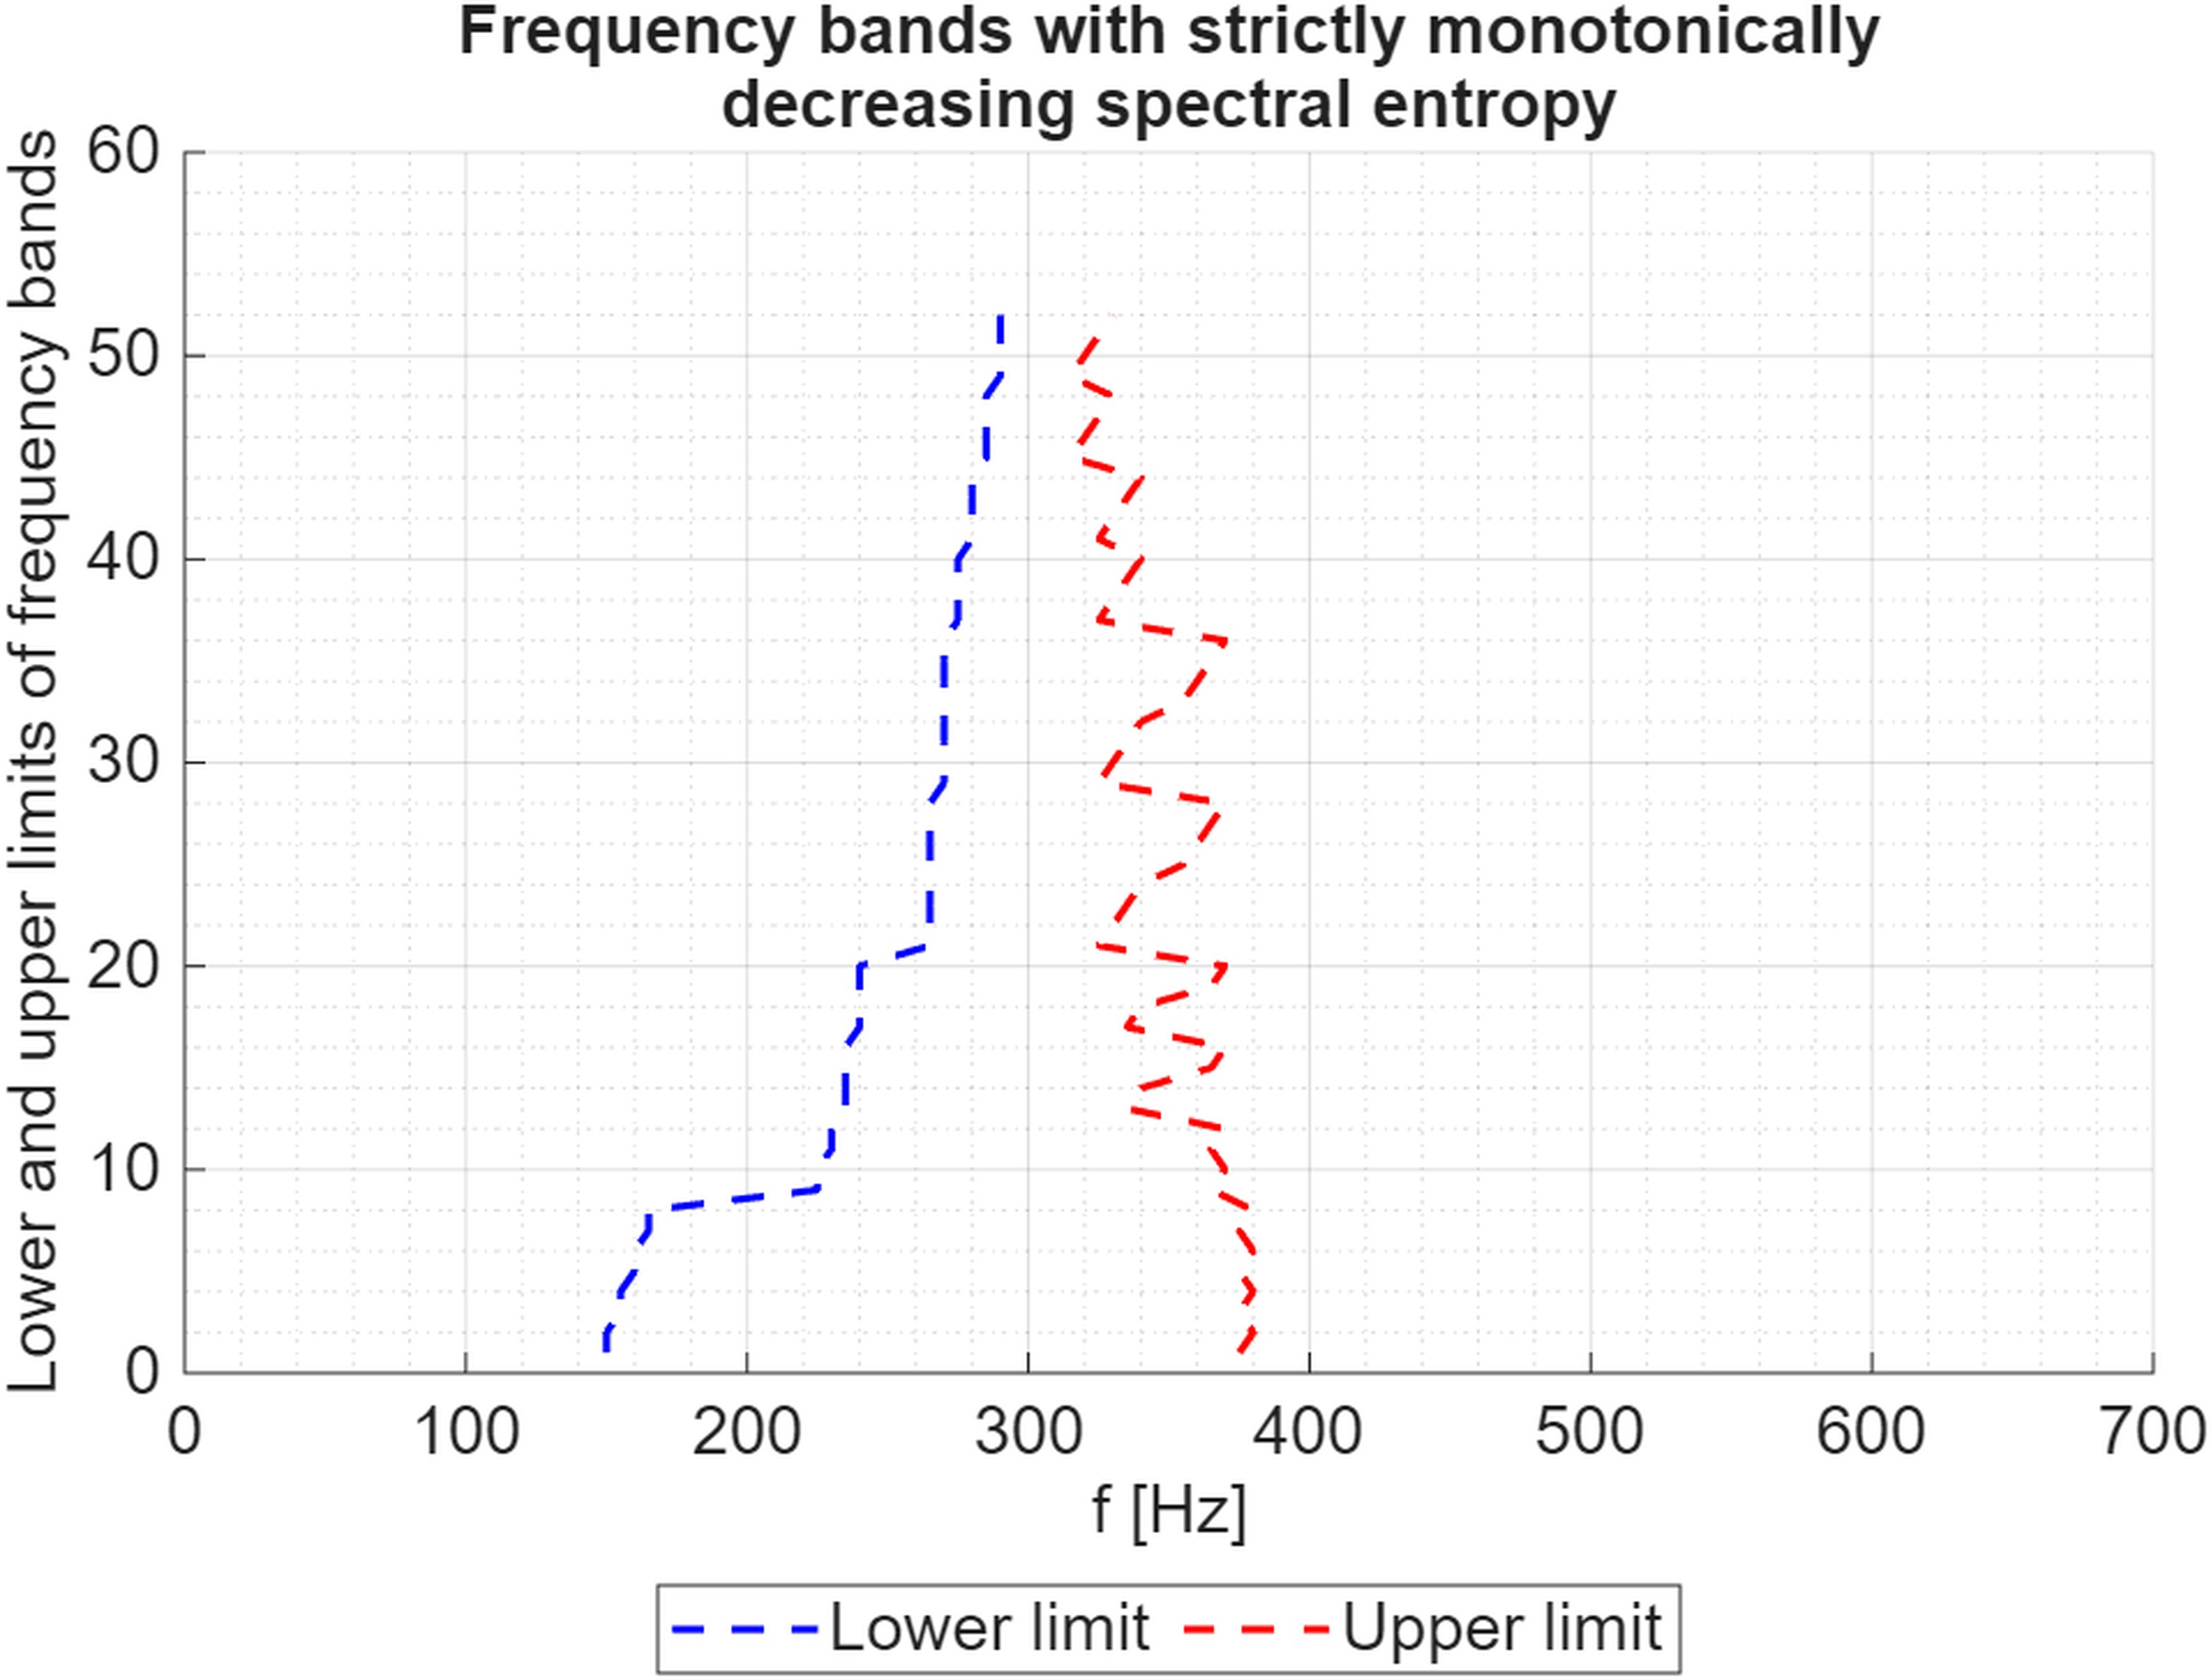
In contrast, no strictly monotonically decreasing entropy was observed in the data obtained from the simulation with the ABS disc. A possible hypothesis explaining this phenomenon is related to the Hunt and Crossley contact model, which incorporates both spring and a damper. In the FFT spectrum shown in Figure 20, increased amplitudes can be observed in the range of 400-500 Hz for the simulation with the ABS disc, which are not present in the spectrum obtained from the simulation with the steel disc. These increased peaks are also not observed in the FFT of the measured data, in which the high-frequency components exhibit significantly lower amplitudes than those obtained in both simulations.
Discussion Of Results
Cycloidal gearboxes are mechanisms whose dynamic characteristics differ significantly from those of conventional gearboxes. Their dynamic behavior is strongly influenced by backlash [13] and contact parameters. The output torque is modulated by rolling contact phenomena, which increases the complexity of the spectral characteristics of both the input and output torque signals. The defects introduced in this study, initially designed in numerical research, lead to increased contact forces. Consequently, disturbances in the output torque are expected to exhibit harmonic behavior. The defects were distributed across successive lobes, and it was initially assumed that such defects could be easy identified through feature extraction from the signal spectrum. However, spectral analysis did not reveal any promising relationship between spectral features and the number of defects. The application of Morris Minimum Bandwidth Wavelets, which are widely used in fault diagnostics of rotating machinery, also failed to provide useful features when analyzing the scalograms. Further analysis of the PSD indicated that spectral entropy is the most reliable classification method for this type of defect. Nevertheless, an initial inspection of the PSD plots did not reveal any clear features that could distinguish between different numbers of defects.
The hypothesis of spectral scattering was first investigated using PSD analysis. The ratio of narrowband energy to the total signal energy was examined under the assumption that the signal from a healthy gearbox should exhibit predominantly harmonic characteristics, whereas the emergence of defects would cause energy scattering around successive harmonics. However, the rolling contact in cycloidal gearboxes does not lead to the appearance of single, clearly distinguishable spectral peaks. Instead, the spectral characteristics of cycloidal gearboxes are highly complex. Analysis of the narrowband-to-total energy ratio did not reveal any useful diagnostic features, as the energy ratios appeared random with increasing numbers of defects.
Analysis of the spectral centroid and the 95% roll-off frequency did not lead to successful development of a method capable of distinguishing between different numbers of defects. In cycloidal gearboxes, the introduction of defects in the cycloidal discs alters the spectrum; however, no clear relationship was observed between the increasing number of defects and the amount of high-frequency content in the signal. Consequently, the spectral centroid values for signals with successive defects appear random. Similarly, the 95% roll-off frequency does not provide reliable features for classifying the number of defects.
The introduction of the defects into the cycloidal disc lead to emergence of short impulse disturbances, which cause changes in the measured output torque signal and result in a broader spectrum. The PSD becomes more evenly distributed. Spectral entropy is capable of capturing these disturbances by quantifying the degree of spectral disorder in the measured signal. A comparison of the analyzed diagnostic methods is presented in Table 7.
Conclusions
Cycloidal gearboxes exhibit complex spectral characteristics in the output torque signal. Defects in the cycloidal disc introduce disturbances with a broadband spectral content. Among the investigated approaches, Shannon spectral entropy proved to be the most effective method for defect classification. The measured signals confirm the validity of this approach. However, in the presence of high noise levels, the calculated spectral entropy values may be suppressed, which can reduce classification reliability.
Tab. 7. Comparison of the investigated fault diagnosis methods for the cycloidal gearbox