INTRODUCTION
High-pressure gaseous storage remains one of the most mature routes for on-board hydrogen applications, and Type IV composite overwrapped pressure vessels (COPVs) occupy a central place in that landscape because they combine high pressure capacity with favorable mass efficiency. Their structural architecture also creates a difficult monitoring problem. A polymer liner, a filament-wound composite overwrap, locally varying thickness, changing winding angles, and dome-driven geometric effects produce a response that cannot be represented adequately by a few isolated measurements unless the sensing strategy and the interpretation of the data are chosen carefully. Recent reviews therefore extend the discussion beyond burst strength to durability, inspection, sensor integration, and lifecycle-oriented structural health management [1-4].
Instrumented pressure-vessel studies have used conventional strain gauges, fiber Bragg gratings, digital image correlation, acoustic techniques, embedded optical fibers, and flexible sensing concepts to observe deformation and damage development under realistic loading conditions [5-7]. These approaches reveal local strain evolution, but they also expose the practical burden of dense instrumentation. Each additional channel increases wiring complexity, acquisition demand, integration effort, and the possibility of sensor loss or drift. COPV damage-detection studies have consequently begun to treat pressure and strain as coupled signals rather than unrelated measurements [8]. Reviews of AI-assisted hydrogen storage vessels likewise stress that useful progress depends on trustworthy data, transparent validation, and explicit attention to transfer beyond the available measurements [3,4].
Virtual sensing is relevant in this setting because it estimates an unmeasured structural response from a smaller set of physical sensors and, where appropriate, from loading variables. Model-based approaches use reduced-order or finite-element descriptions, whereas data-driven approaches use regression, missing-data reconstruction, or sequence models. Work on bridges, offshore structures, and laboratory structures shows that virtual sensors can be useful, while also demonstrating that sensor placement, data quality, and the validation design determine whether the reconstructed response can be trusted [9-14]. The wider structural health monitoring literature reaches a similar conclusion: deep learning can recover complex patterns, but data scarcity, sensor faults, and domain shift remain important limitations [15-20].
Comparative machine-learning studies are also becoming common in other mechanical and hydrogen-related applications. Recent examples have evaluated alternative learning models for engine noise and vibration under biodiesel–CNG operation and under hydrogen-assisted biodiesel–diesel operation [21,22]. These studies concern a different physical system, but they illustrate the broader need to compare models on clearly bounded mechanical-response problems rather than relying on a single high-performing algorithm.
For composite pressure vessels, much of the machine-learning literature remains simulation-centered. Finite-element-assisted learning and transfer learning are valuable for design optimization and behavior prediction, but they answer a different question from reconstructing a missing response from synchronized experimental sensors during a burst test [23,24]. The present study therefore adopts a deliberately limited case-study formulation using the open hydraulic burst dataset of Lüders et al. [25,26]. It asks how accurately one cylinder position can be reconstructed within the same synchronized test, how much performance remains when explicit time is removed, and how the learned relations behave when they are applied above the pressure range used for training. The work does not claim cross-vessel validation, cross-test reproducibility, or a universal reference standard. Its contribution is a transparent comparison of simple and learned reconstruction methods within one clearly defined experimental record, together with an explicit account of the limits of the resulting inference.
MATERIALS AND METHODS
To connect the experimental data structure with the prediction tasks, the analysis first defines the retained sensor subset and preprocessing procedure and then introduces three evaluation settings with progressively more restrictive information.
The synchronized pressure–strain file and the strain-gauge metadata file were taken from the open Type IV COPV burst dataset of Lüders et al. [25,26]. The source package contains 18 strain-gauge channels at nine spatial positions, with one axial and one hoop gauge at each position. The main analysis retains the six cylinder positions defined by x ∈ {0, 196} mm and φ ∈ {0°, 120°, 240°}, resulting in twelve cylinder channels. The three positions at x=330 mm are associated with the dome and are used only in a supplementary scope analysis. Figure 1 shows the measurement layout.
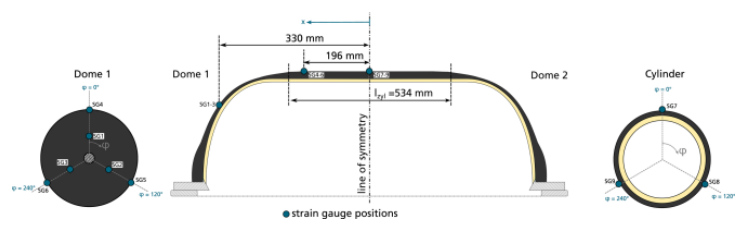
Fig. 1. Strain-gauge layout in the open burst-test dataset. The main analysis uses the six cylinder positions at x=0 and 196 mm. The three positions at x=330 mm are retained only for the supplementary cylinder–dome comparison. Each position contains one axial and one hoop gauge
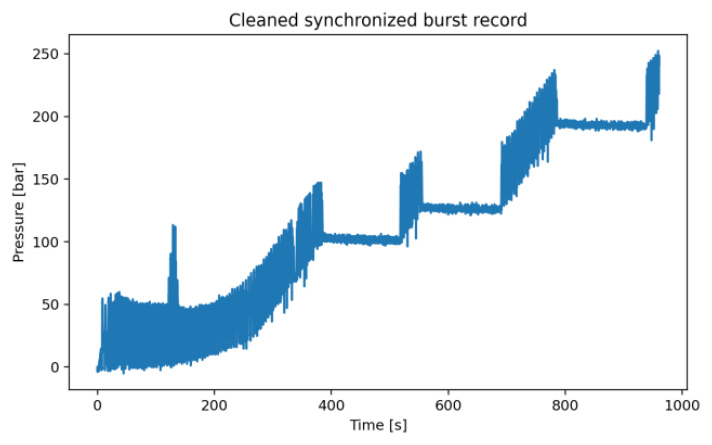
Fig. 2. Cleaned pressure history used in the study. All position-holdout training and testing data in the first two evaluation settings come from this same synchronized burst event; the corresponding results therefore describe within-test reconstruction rather than cross-test generalization
The semicolon-delimited synchronized file was read after skipping the units row. Time, pressure, and all strain-gauge channels were converted to numeric form. The invalid tail of the record was removed at the earliest row containing either a sentinel strain value below −10⁵ µε or a missing strain value, and rows with missing time or pressure were excluded. This procedure retained 9,609 synchronized time steps sampled at 10 Hz. The cleaned pressure record reached 252.4 bar (Figure 2). The numerical pressure derivative dP/dt was calculated from the cleaned pressure series. Sensor metadata were then joined to the synchronized channels and the retained cylinder data were reshaped to long format.
The long-format cylinder table contains 115,308 rows, but these rows are repeated and strongly correlated measurements from one specimen and one burst history. They are useful for fitting the time- and pressure-dependent response, but they do not constitute 115,308 statistically independent experimental replications. No inferential claim, significance test, or confidence interval across vessels is based on this row count. Table 1 summarizes the experimental scope.
Tab. 1. Experimental scope and data retained for the comparative analysis
Three evaluation settings were defined (Table 2). The first is a position-holdout analysis within the same burst history. One cylinder position is removed from model fitting, while the remaining five positions from the same synchronized record are retained. This design evaluates the reconstruction of a missing position within an instrumented test; it is not cross-validation across independent experiments. The second setting removes explicit time and uses pressure-driven features to provide a more deployment-oriented comparison. The third trains the time-free models only on P≤125 bar and evaluates them above that threshold. Because both pressure ranges still belong to the same physical test, this third setting is interpreted as a within-record out-of-range stress test rather than as independent validation of general extrapolation.
Three deliberately simple baselines were evaluated before the learned models. For the same-time direction-wise mean, the prediction for held-out position p, direction d, and synchronized instant tₖ is

where the sum uses the active cylinder gauges with the same direction. In practice, this baseline would be available only when the remaining reference gauges and synchronized acquisition remain operational. It can therefore represent temporary replacement of one failed gauge or an offline reconstruction reference, but it is not a stand-alone virtual sensor when all strain channels are unavailable. Its role in this study is to expose how much of the apparent reconstruction accuracy is already carried by the shared loading history.
Tab. 2. Evaluation settings and the scope of the conclusions that can be drawn from them
The pressure-bin baseline uses the mean strain of the training positions within 1 bar pressure bins, separately for axial and hoop directions. The isotonic baseline fits a monotonic direction-wise pressure–strain relation. These two baselines remove explicit access to the synchronized time index and provide simple pressure-conditioned comparators.
The learned-model family comprises ordinary least squares, ridge regression, random forest, and multilayer perceptron (MLP) models. Hyperparameters were fixed before evaluating the held-out positions and were not optimized on the test folds. The random forest used 250 trees, with the remaining settings retained from the accompanying workflow. The MLP settings were inherited from the supplied analysis code and kept unchanged across all position holdouts: two hidden layers of 128 units, ReLU activation, Adam optimization, α=10⁻⁴, an initial learning rate of 10⁻³, a maximum of 300 iterations, and early stopping with a 10% internal validation subset. Five random seeds were used for the MLP family to characterize optimization variability. The comparison also retained the original ablations using raw φ, excluding dP/dt, excluding time, and excluding coordinates. No claim is made that these configurations are globally optimal; the purpose is a controlled comparison under fixed settings rather than exhaustive model selection.
Input features were standardized for all learned models, and the target was also standardized for the MLP before transforming predictions back to physical units. Model quality was summarized by


For the high-pressure stress test, the median absolute error (MedAE) and the 95th-percentile absolute error (P95AE) were also reported in µε. MLP values are presented as the mean and standard deviation over five seeds. All metrics are interpreted descriptively within this one burst test.
RESULTS AND DISCUSSION
Response structure in the cylinder region
Figure 3 shows the pressure-conditioned axial and hoop strain envelopes for the retained cylinder gauges. Hoop strain remains above axial strain, while both directions follow the same global loading path. Figure 4 shows that cross-position variability rises with pressure but remains modest relative to the total temporal growth of strain.
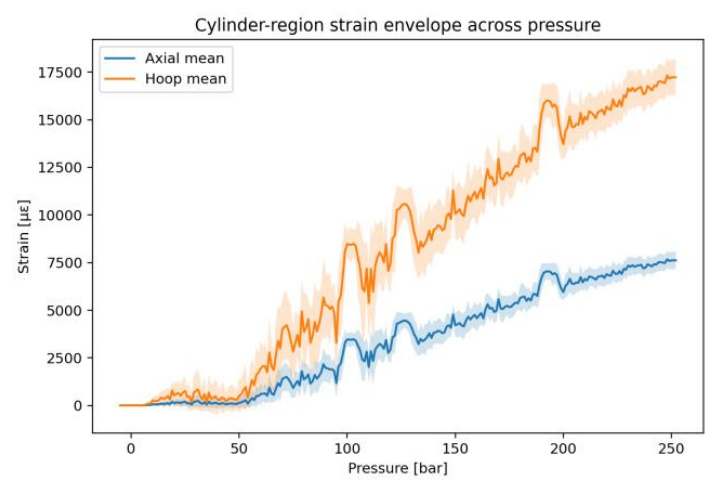
Fig. 3. Direction-wise mean cylinder strain as a function of pressure. The shaded bands represent one standard deviation across the six cylinder gauges of the same direction and show that the dominant response is shared across positions
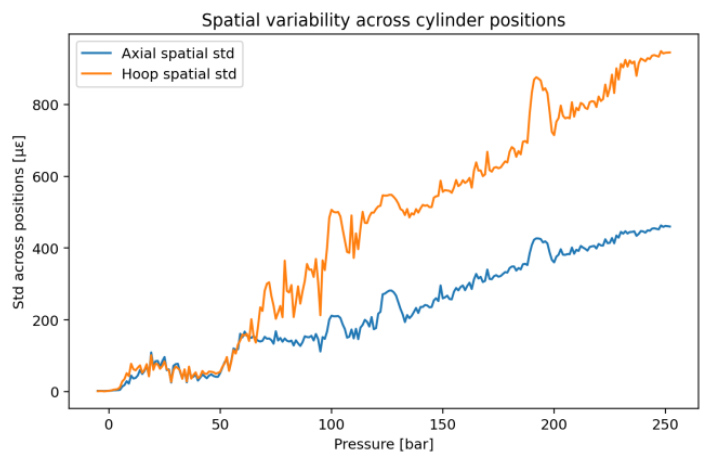
Fig. 4. Cross-position standard deviation of the cylinder strain signals as a function of pressure. The increase at higher pressure indicates growing spatial differentiation, although it remains small compared with the overall strain evolution during the burst test
The average cross-position standard deviation at a fixed time and direction is approximately 8.1% of the average temporal standard deviation of an individual cylinder channel. The corresponding ratios are 8.7% for axial gauges and 7.8% for hoop gauges. The mean absolute pressure–strain correlation across the cylinder channels is approximately 0.960. These descriptive quantities explain why methods that primarily track the common loading history can reconstruct the cylinder response accurately within this test.
Position-holdout reconstruction within the same test
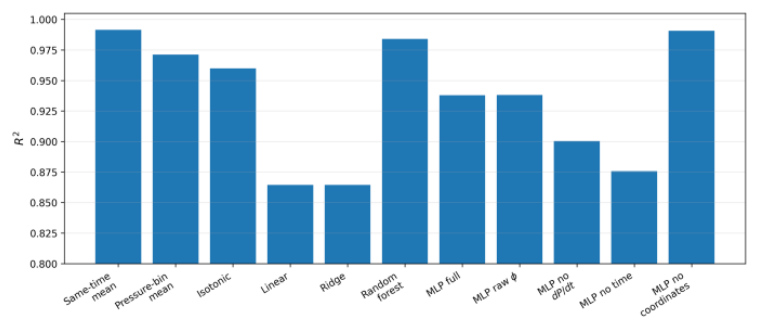
Table 3 presents the position-holdout results. The same-time direction-wise mean reaches R²=0.9915 and NRMSE =0.0257, while the MLP without coordinates reaches R²=0.9906 ±0.0002. The random forest also performs strongly with R²=0.9839. By contrast, the coordinate-aware MLP reaches R²=0.9378±0.0213. The result does not show that spatial coordinates are generally unimportant. It shows that, for this relatively uniform cylinder subset and this one synchronized loading history, the shared response carries more predictive information than the available spatial encoding.
Tab. 3. Position-holdout reconstruction results within the single synchronized burst test. MLP values are mean ± standard deviation over five seeds; the other entries are single deterministic or fixed-seed comparisons
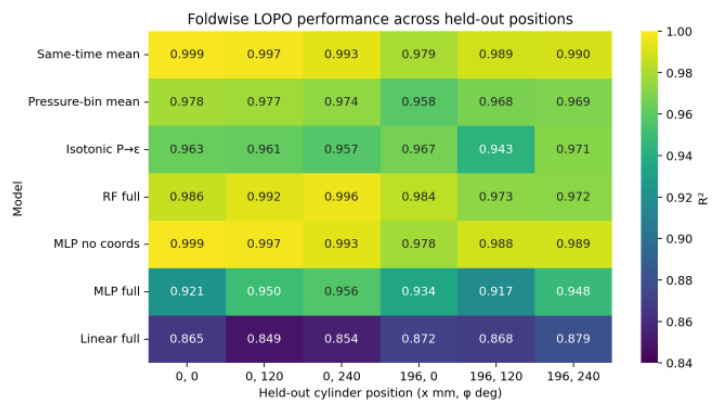
The seed-wise results reinforce this interpretation. Across five seeds, the full MLP spans R²=0.903–0.958, whereas the no-coordinate MLP remains within R²=0.9903–0.9909. Figure 5 presents the comparison using a common font scale, and Figure 6 shows that the ordering is not produced by one favorable held-out position. These fold values remain dependent because they share the same vessel and burst history, so they are used to describe position sensitivity rather than statistical replication.
Pressure-conditioned reconstruction
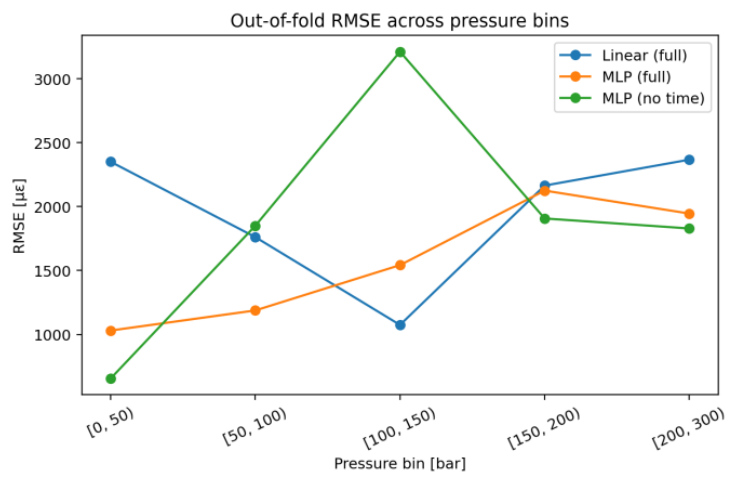
Removing explicit time changes the interpretation from a same-time upper bound to a pressure-conditioned virtual-sensing problem. The pressure-bin mean reaches R²=0.9712, and the isotonic baseline reaches R²=0.9599, both above the time-free MLP at R²=0.8757±0.0412. The pressure-bin RMSE curves in Figure 7 show that model ranking changes along the loading path. The linear model is competitive at intermediate pressure, the full MLP improves at higher pressure, and the time-free MLP is especially fragile in the central pressure range. At very low pressure, local R² values can become negative because the target variance within a narrow bin is small; RMSE is therefore the more informative local measure.
Within-record high-pressure stress test
All models deteriorate when fitted only at P≤125 bar and evaluated at higher pressure (Table 4). Linear regression gives the least poor aggregate result with R²=0.5336, random forest falls to R²=0.3812, and the time-free MLP reaches R²=-1.8043. The negative value means that the MLP performs worse than a constant-mean predictor over the high-pressure portion of this record. This experiment therefore provides evidence of model fragility under an out-of-range shift within the same burst history, but it should not be described as independent validation of extrapolation to a new test or a new vessel.
Tab. 4. Within-record high-pressure stress-test results. Models are fitted using P≤125 bar and evaluated using P>125 bar from the same burst test
| Model | R² | NRMSE |
|---|---|---|
| Linear regression, no time | 0.5336 | 0.1861 |
| Random forest, no time | 0.3812 | 0.2143 |
| MLP, no time | -1.8043 | 0.4562 |
Direction-wise residuals reveal that the aggregate score can conceal substantial failure (Table 5). Linear regression falls to R²=-4.81 for axial channels and reaches only R²=0.19 for hoop channels. Random forest is negative in both directions, and the time-free MLP fails severely for both. The combined R² in Table 4 is partly increased by the difference between axial and hoop strain levels and should not be read as uniform channel-level performance.
Tab. 5. Direction-wise residual dispersion for the high-pressure part of the same burst record. MedAE and P95AE are reported in µε
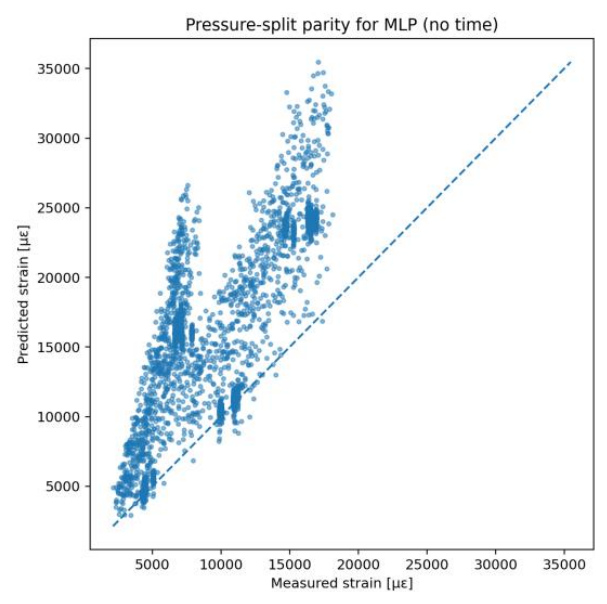
Fig. 8. Measured and predicted strain in the within-record high-pressure stress test. Deviation from the one-to-one line increases as the models are applied beyond the pressure range used for fitting
The upper tail of the absolute error also grows with pressure. Between the 125–150 bar and 225–260 bar bins, P95AE rises from approximately 3,241 to 6,725 µε for linear regression, from 2,408 to 9,611 µε for random forest, and from 4,707 to 17,905 µε for the time-free MLP (Figure 9). These values describe residual dispersion in the available record and are not calibrated predictive intervals.
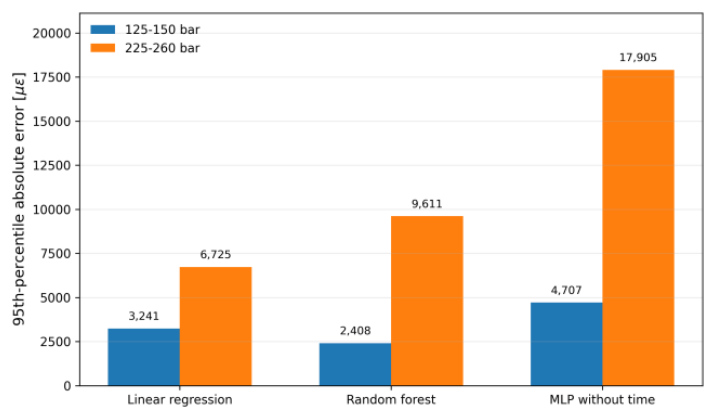
Fig. 9. Growth of the 95th-percentile absolute error between the first and last high-pressure bins of the within-record stress test. The increase is strongest for the MLP without time
The result is consistent with the broader SHM literature, where interpolation within familiar data is generally easier than transfer across new conditions or domains [18-20]. Here, the lower-pressure data do not contain the higher-strain response encountered later in the burst record, so purely data-driven mappings become unreliable when applied beyond the observed range.
Sensitivity to dome inclusion
Restricting the main analysis to the cylinder region materially simplifies the reconstruction problem. Table 6 compares descriptive response characteristics with the region-level results of the original nine-position MLP run. Cylinder axial and hoop gauges show strong pressure–strain correlation, and their cross-position variability remains below 9% of the average temporal variation. Dome axial gauges are similar in these descriptive measures, but dome hoop gauges have a mean absolute pressure–strain correlation of only 0.297 and a spatial-to-temporal standard-deviation ratio of 0.314. The corresponding region-level MLP result is strongly negative.
The poorer dome-hoop behavior is mechanically plausible. In the dome, curvature, local thickness, winding angle, and load-transfer direction vary with position, while a gauge labelled as “hoop” is not necessarily aligned with a single global principal direction over the full geometry. Local bending, end effects, and nonuniform strain redistribution can therefore weaken a simple monotonic pressure–strain relation [2-4,6]. These mechanisms are not represented explicitly by the present time, pressure, and coordinate features. The dome result remains supplementary because it is based on the original single-run MLP outputs rather than a complete multi-model comparison, but it is sufficient to show that the strong cylinder results should not be generalized to the full vessel surface.
Tab. 6. Supplementary comparison of cylinder and dome responses. Descriptive quantities are calculated from the cleaned measured signals, while the final column comes from the original single-run nine-position MLP analysis
| Region | Direction | Mean |r(P, ε)| | Spatial/temporal std ratio | MLP R² |
|---|---|---|---|---|
| Cylinder | Axial | 0.961 | 0.087 | 0.842 |
| Cylinder | Hoop | 0.960 | 0.078 | 0.836 |
| Dome | Axial | 0.960 | 0.088 | 0.802 |
| Dome | Hoop | 0.297 | 0.314 | -2.736 |
LIMITATIONS AND SCOPE OF INFERENCE
The principal limitation is the experimental unit itself: the study contains one vessel and one hydraulic burst test. The 115,308 long-format rows are dependent observations along that single history and do not provide cross-vessel replication, cross-test reproducibility, or a basis for statistical significance claims between model families. The six position holdouts are also not independent experimental folds because they share the same pressure history and the same specimen. For this reason, the revised manuscript presents the results as a comparative single-test case study and uses descriptive performance language throughout.
The high-pressure split has a similarly bounded interpretation. It tests whether a model fitted to the lower-pressure part of this one record remains stable later in the same record. It is useful as a stress test because it exposes the inability of several models to operate outside their fitted pressure range, but it cannot establish general extrapolation to another burst test. Demonstrating such transfer would require repeated tests, multiple vessels, and preferably variations in manufacturing condition, loading rate, temperature, and sensor configuration.
The same-time mean is an intentionally strong upper-bound comparator. It may be useful for temporary replacement of one failed sensor when other synchronized gauges remain operational, or for offline data-quality assessment, but it cannot replace the full physical array when no same-direction reference signals are available. Finally, the analysis is purely data-driven and does not include a constitutive prior, a shell or finite-element model, or formal uncertainty quantification. Mechanics-aware learning, repeated-test validation, dome-inclusive studies, and calibrated intervals are therefore more important next steps than further tuning of a neural-network architecture alone [7,27].
CONCLUSIONS
This single-test case study compared simple baselines and learned models for virtual strain sensing in the cylinder region of a Type IV COPV during one hydraulic burst test. Accurate position-holdout reconstruction was possible within the synchronized record. The same-time direction-wise mean and the MLP without coordinates both reached approximately R²=0.99, showing that the common loading history and the coherent cylinder response explain much of the apparent predictive performance. A more elaborate coordinate-aware network did not define the performance ceiling.
The conclusions change when the task becomes more demanding. Pressure-conditioned baselines remained competitive after explicit time was removed, while all learned models deteriorated in the within-record high-pressure stress test. The time-free MLP produced a negative R², residual dispersion grew sharply with pressure, and the supplementary dome analysis showed that hoop reconstruction in the dome is substantially harder than cylinder reconstruction. These findings support virtual sensing as a possible tool for missing-gauge replacement or offline reconstruction within an instrumented test, but not yet as a transfer-ready monitoring model. Future work should prioritize repeated burst or proof tests, multiple vessels, full-surface sensing, mechanics-aware constraints, and calibrated uncertainty before virtual sensors are used for engineering decisions.
DATA AND CODE AVAILABILITY
The underlying burst-test dataset is publicly available through Lüders et al. [25,26], including the Zenodo record with DOI: 10.5281/zenodo.10983652. The Python preprocessing, baseline, learned-model, and figure-generation scripts, together with the fixed random seeds and summary outputs used in this study, are provided as Supplementary Material. Additional intermediate files are available from the corresponding author upon reasonable request.