
. BACKGROUND
Respiratory disease significantly impacts horses' training and performance results, both in racing and sport. It is thus commonly referred to as the second most common cause of poor or loss performance after musculoskeletal injury [1]
In human medicine, the concept of "unified airways", referred to the “One Airway, One Disease”, has been established, recognizing that the inflammation in upper and lower airways typically shares the same underlying characteristics [2, 3]. Airway segments are anatomically continuous, histologically similar, and functionally integrated [3]. Therefore, diseases of the upper airway – such as rhinitis, rhinosinusitis, obstructive sleep apnea, and nasal polyps – have been associated with diseases of the lower airway – such as chronic obstructive disease, cystic fibrosis, and asthma [4-6]. An analogous association has been proposed in equine veterinary medicine, particularly between pharyngitis and conditions such as nasopharyngeal collapse [7], dorsal displacement of the soft palate [7-9], aryepiglottic fold collapse [7], guttural pouch infection [10] , influenza [11], and equine asthma [12].
In equine veterinary medicine, pharyngitis refers to the pharyngeal lymphoid hyperplasia (PLH), which is characterized by the proliferation and growth of the lymphoid tissue in the pharyngeal mucosa and serves as an indicator of upper airway inflammation or antigen irritation [13]. The local lymphoid tissue forms aggregated nodular lymphoid follicles [14], assessed using resting endoscopy and graded on a scale from 0 to 4 of PLH [15, 16]. Grade 0 indicates a healthy mucosa, while grades 1 to 4 are often associated with active respiratory tract inflammation.
Both in human and equine clinical practice, endoscopy – e.g. gastroscopy [17, 18], colonoscopy [19, 20], capsule endoscope [21, 22], cystoscopy [23, 24], ureteroscopy [25, 26], nasopharyngoscopy [27, 28], and bronchoscopy [28, 29] – is used to image the consecutive segments of the gastrointestinal tract, urinary tract, and respiratory tract, respectively. Based on the visual inspection of these images, clinicians can assess visible changes and diagnose the underlying disease. In human medicine, many computer–aided diagnosis (CAD) methods have been proposed to classify endoscopic images automatically [30-32]. CAD methods are applied to screening, identifying, and monitoring early endoscopic signs of given diseases, leading to earlier detection of the disease and earlier implementation of treatment. Most CAD methods have been applied to the gastrointestinal tract endoscopic images, providing early detection of polyps, ulcers, and perforations, thus reducing the incidence and mortality of gastrointestinal cancers [32–36]. An analogous application of a deep learning architecture was proposed for tissue classification for the gastrointestinal tract in veterinary medicine [37]; however, equine respiratory tract diseases have not been diagnosed using CAD methods.
To fill the gap in the existing state of quantitative assessment of equine nasopharyngoscopy images, the objective of this study was to implement the two–dimensional entropy measures to quantify the endoscopic signs of PLH as the step forward in incorporating CAD of active respiratory tract inflammation in horses. Additionally, this study aimed to demonstrate whether incorporating multi–scale entropy measures and specific image filtering method into the PLH classification protocol provides higher classification metrics than using single scale entropy measures.
. METHODS
The study was conducted on endoscopic images of pharyngeal mucosa collected from 70 horses (warmblood horses; 29 mares, 36 geldings, 5 stallions; median age: 12 years old, range from 6 to 24 years old) clinically assessed as having PLH grade 0 (n=6), grade 1 (n=16), grade 2 (n=26), grade 3 (n=16), and grade 4 (n=6). Endoscopic images were collected from privately owned horses – patients of the Equine Clinic of the Warsaw University of Life Sciences – which were examined at the request of their owners due to clinical symptoms of the respiratory tract diseases (abnormal respiratory noise, nasal discharge, coughing, and poor performance) or for pre–purchase evaluation. The research using the results of veterinary clinical examination does not fall under the legislation for the protection of animals used for scientific purposes (national decree–law Dz. U. 2015 poz. 266 and 2010–63–EU directive), therefore no ethical approval was needed.
The resting endoscopic examination of the respiratory tract was performed using a flexible video bronchoscope (8 × 2000 mm; Karl Storz, Berlin, Germany) after sedation. When the endoscope was positioned in the pharyngeal region opposite the larynx, the endoscopic images were frozen and saved as BMP files. From at least five endoscopic images captured for each horse, one endoscopic image per horse was selected based on the image quality/similarity inclusion criteria (no motion blur, field of view captured the pharyngeal vault, larynx, and fully abducted epiglottis).
The endoscopic signs of the PLH were determined using a previously proposed PLH scoring system [12]. In this system, the absence of visible lymphoid tissue was scored as 0 and represented a healthy mucosa (Grade 0; Fig. 1A). The presence of visible lymphoid follicles, representing PLH, was gradually scored from 1 to 4. The presence of a few small lymphoid follicles on the dorsal wall of the pharynx represented minor PLH and was scored as 1 (grade 1, Fig. 1B). The presence of numerous small lymphoid follicles on the dorsal and lateral walls of the pharynx represented mild PLH and was scored as 2 (grade 2, Fig. 1C). The presence of numerous large lymphoid follicles on the dorsal and lateral walls of the pharynx represented moderate PLH and was scored as 3 (grade 3, Fig. 1D). The presence of numerous large, edematous lymphoid follicles on the dorsal and lateral walls of the pharynx represented severe PLH and was scored as 4 (grade 4, Fig. 1E). The pharyngeal mucosa was scored by an experienced veterinarian, a certified specialist of equine disease.
The endoscopic images saved as BMP files where then adjusted to the uniform size and presentation, and segmented using regions of interest (ROIs) with 120 pixels in height and 120 pixels in width each (Fig. 1F–J). ROIs were annotated on the dorsal wall of the pharynx, as this area exhibits a high follicle density across all PLH grades. Notably, in grade 1, lymphoid follicles appear only on the dorsal wall and not on the lateral wall of the pharynx, making the selected ROI location the most appropriate for quantification across all PLH grades. ROIs were saved as BMP files. Segmented ROIs were converted to grayscale and filtered using Normalize, Mean, Median, and Laplacian filters in Python. Each used filter increases image contrast, however, in different ways: Normalize filter by reducing Gaussian noise in the image, Mean filter by assigning the mean value of a neighborhood of pixels to each pixel, Median filter increases contrast with edge–preserving quality by reducing salt and pepper noise, and Laplacian filter by enhancing rapid intensity changes on the edges [38].
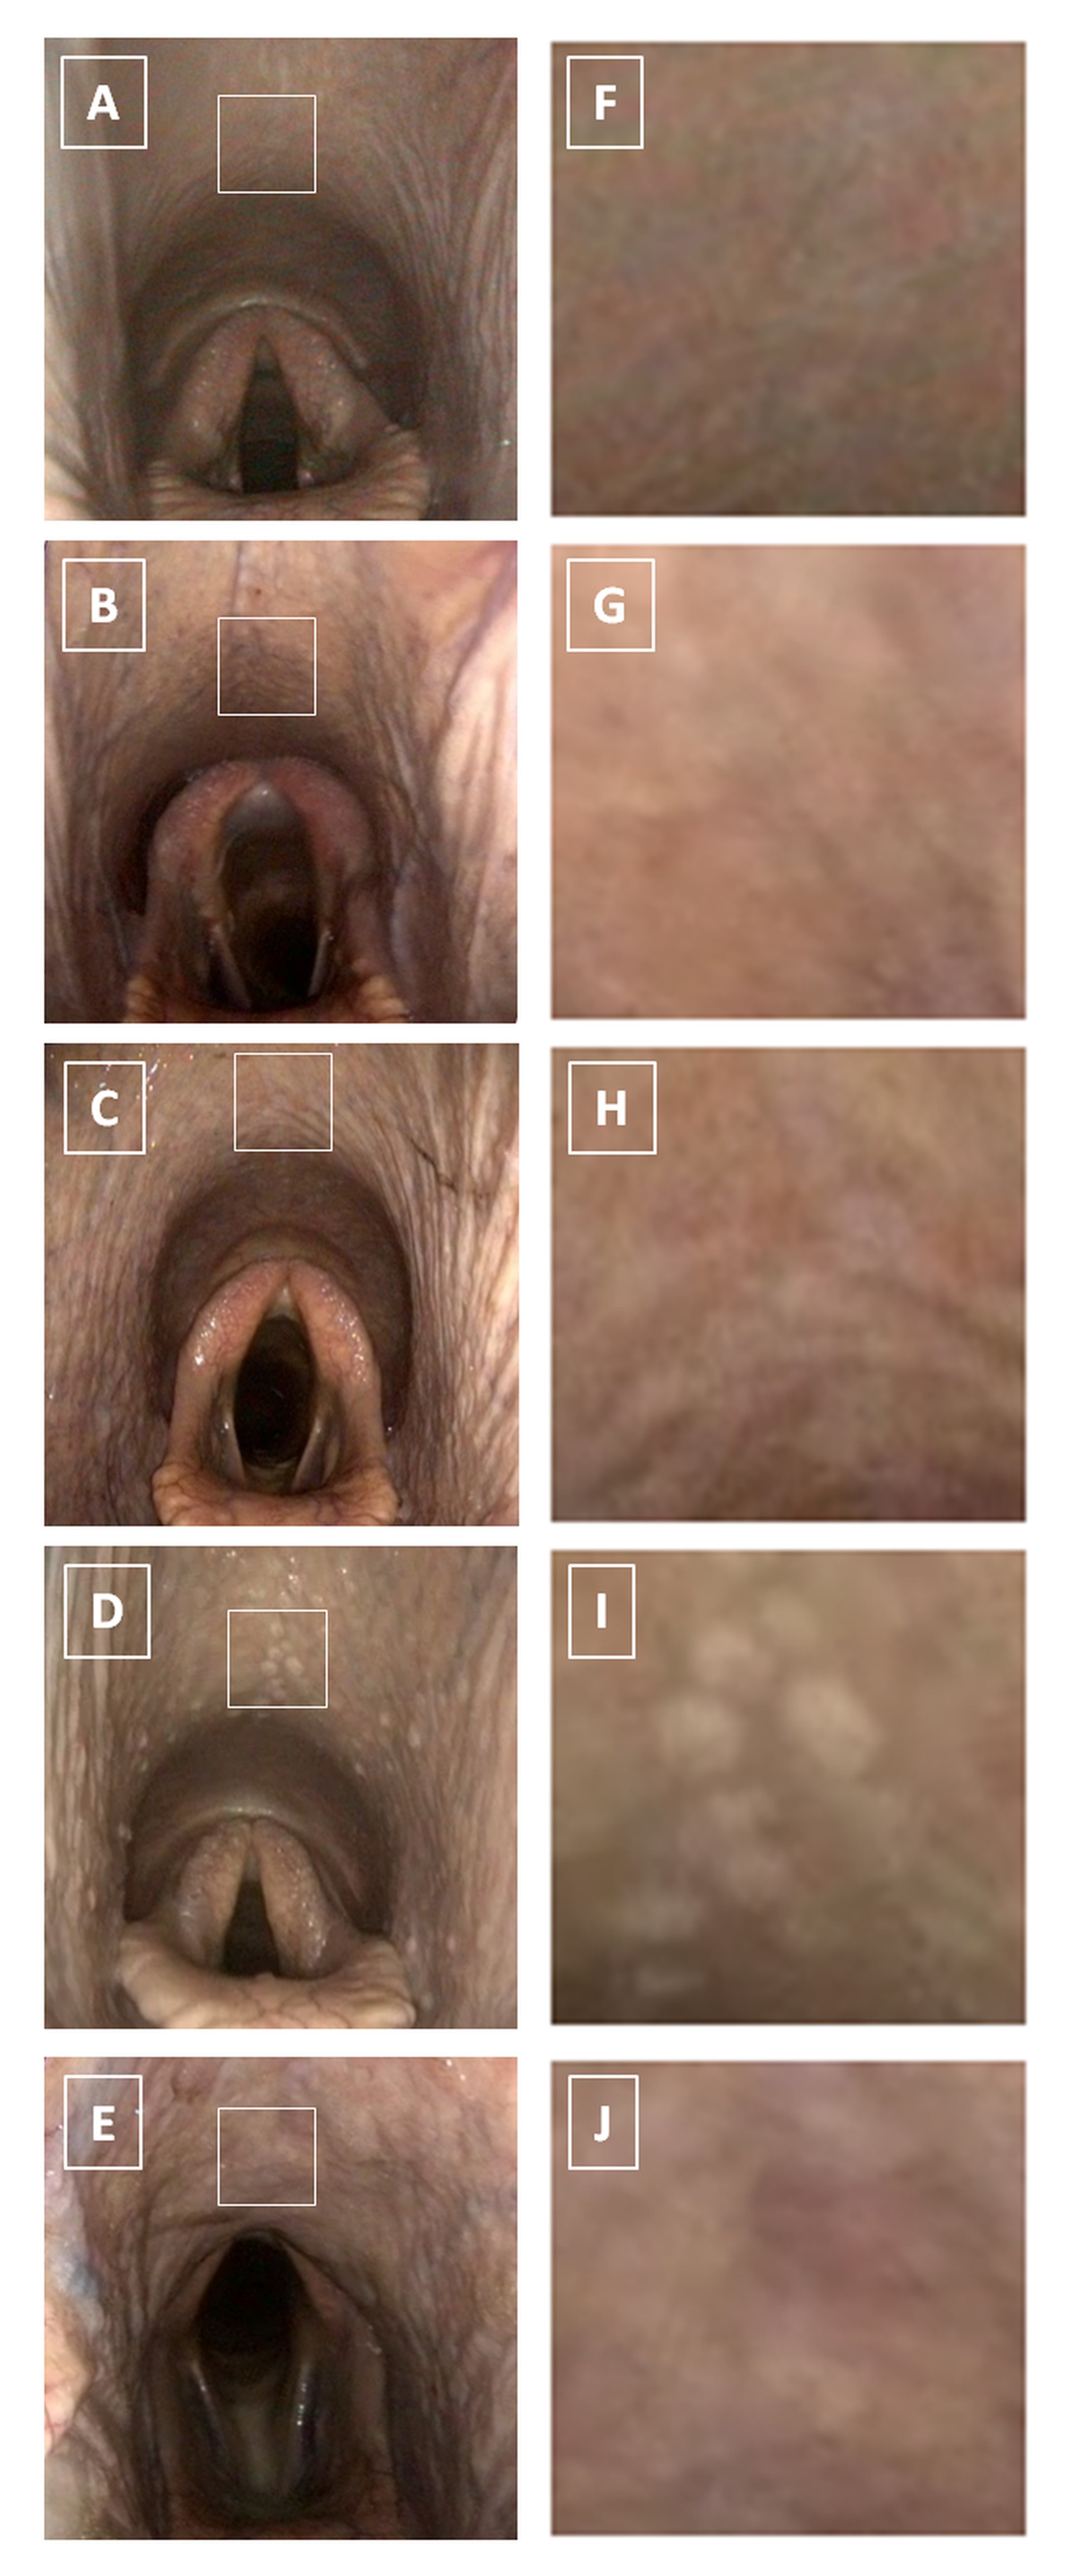
Fig. 1. The endoscopic images (A – E) and corresponding segmented regions of interest (ROIs) (F – J) of the equine pharyngeal mucosa representing healthy mucosa (g rade 0) (A,F) as well as the pharyngeal lymphoid hyperplasia (PLH) – minor (g rade 1)(B,G), mild (g rade 2)(C,H), moderate (g rade 3)(D,I), and severe (g rade 4)(E,J), respectively. ROIs segmented on endoscopic images are represented by white square
For each ROI, the texture features were calculated using six two–dimensional entropy measures across five scales (scales 1–5). The five scale model was selected as well-documented in the existing and successfully applied in animal research [39].
The algorithm for multi-scale two-dimensional entropy is as follows:
1. given an image U of size N x M, the coarse images U(s) were constructed as follows:
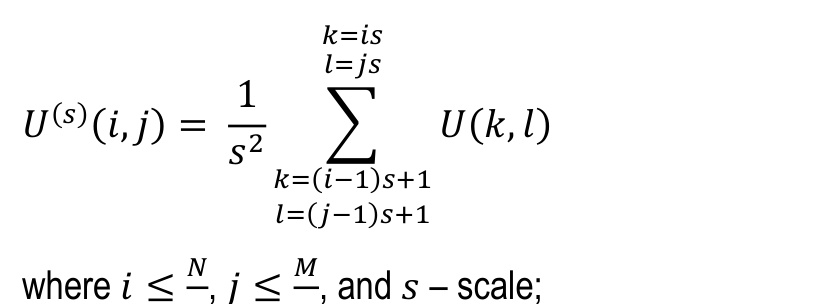
2. for each constructed image, the following entropy measures were calculated: sample entropy (SampEn2D) [40, 41], fuzzy entropy (FuzzEn2D) [42, 43], dispersion entropy (DispEn2D) [43, 44], distribution entropy (DistEn2D) [39, 45], Espinosa entropy (EspEn2D) [39, 46], and permutation entropy (PermEn2D) [47, 48].
These six entropy measures were selected because they are the most well-documented in the existing literature [39-48] and have been successfully applied in animal research [39]. Given that entropy measures are the negative natural logarithm of the probability of a pattern occurring within an image, image entropy values decrease as image regularity and predictability increase.
SampEn2D defines two–dimensional windows of length m, where each window of length m is compared with all other windows of length m in the image [40]. A match of patterns occurs when each pixel in one window differs by no more than r from the corresponding pixel in the window with which it is being compared. The average probability of the number of pattern matches is calculated for all windows of length m and m + 1 [40, 41].
FuzzEn2D defines the conditional probability, such that the pattern for image points m×m is similar to the next image points (m + 1)×(m + 1), and a fuzzy function is used to calculate the degree of similarity [42, 43].
DispEn2D encodes image patterns and the probability of patterns occurring by taking into account differences between values by using a linear mapping algorithm to c classes [44]. Each designated time series is then mapped to a dispersion pattern. If all possible two–dimensional dispersion patterns of the image have the same probability value, DispEn2D reaches its maximum value. If there is one probability value other than zero, DispEn2D reaches its minimum value, and the image has a regular shape [43, 44].
DistEn2D is a quantitative analysis of image irregularities that considers small image sizes [45]. DistEn2D algorithm calculates the distance matrix between windows as the maximum absolute difference between corresponding pixel pairs. The distance matrix is used to estimate an empirical probability density function based on a histogram approach, which counts the probabilities/frequencies of each histogram interval [39, 45].
EspEn2D is a measure of image irregularity that takes spatial information into account and eliminates undefined values for small images [39]. EspEn2D calculations take into account the probability of occurrence of a set of samples with a dimension of m2 (m – window length) that are similar within the similarity threshold r, with an acceptable percentage of similar samples p [39, 46].
PermEn2D defines the distribution of order patterns in an image by encoding image order patterns/motifs, and then the probability of each pattern occurring, in the entire image. The normalized value of PermEn2D takes values in the range <0,…,1>, which means that a value of 1 indicates random data, while a value less than 1 indicates some correlated dynamics [47, 48].
The two–dimensional entropy measures were grouped for studied PLH grades and tested independently for univariate distributions using the Kolmogorov–Smirnov normality test. Data series were compared between PLH grades for each of entropy measures (SampEn2D, FuzzEn2D, DispEn2D, DistEn2D, EspEn2D and PermEn2D)/scale (scales 1–5) data pairs, separately. When all data series were Gaussian distributed, ANOVA summary followed by Holm–Sidak's multiple comparisons test were used. When at least one data series was non–Gaussian distributed, the Kruskal–Wallis test followed by the Dunn’s multiple comparisons test were used. The alpha value was established as α = 0.05. Statistical analysis was performed using Graph Pad Prism 6 software (GraphPad Software Inc., Avenida De La Playa La Jolla, CA, USA).
Linear Discriminant Analysis (LDA) was used as a first stage of distinguish between five classes [49] representing PLH grades 0–4. LDA was used for simplify classification [50] by transforming features from a high–dimensional space to a lower–dimensional space [51, 52]. LDA returned feature importance values, which indicate how much each feature contributes to class separation. LDA was implemented using the scikit–learn library in Python [38].
After dimensionality reduction using the LDA method, the extracted four components – maximizing the distance between the means of each class when projecting the data in a lower–dimensional space – were used to train and evaluate a classification model based on the Random Forest (RF) algorithm [53, 54]. Classification performance was evaluated using 5–fold stratified cross–validation accuracy. The implementation of RF was carried out using the scikit–learn library in Python [38, 55]. The effectiveness of the classifier was evaluated based on the following classification metrics: Accuracy, Precision, Recall, and F1.
. RESULTS
Entropy measures across 5 scales, obtained from endoscopic images after Normalize filtering, are presented in Fig. S1 of the supplementary materials. Fig. 2. shows only the scale for each entropy measure that yielded the lowest p value. SampEn2D at scale 1 (Fig. 2A) and FuzzEn2D at scale 2 (Fig. 2B) differed between PLH grades 1 and 2, as well as between PLH grades 1 and 3. DispEn2D at scale 5 (Fig. 2C) differed between PLH grades 0 and 1, PLH grades 1 and 2, as well as between PLH grades 1 and 4. DistEn2D at scale 3 differed between PLH grades 0–3 and PLH grade 4 (Fig. 2D). EspEn2D at scale 3 differed between PLH grades 2 and 4 (Fig. 2E). PermEn2D at scale 5 differed between PLH grades 3 and 4 (Fig. 2F).
Entropy measures across 5 scales, obtained from endoscopic images after Mean filtering, are presented in Fig. S2 of the supplementary materials. Fig. 3. shows only the scale for each entropy measure that yielded the lowest p value. SampEn2D at scale 5 (Fig. 3A) differed between PLH grades 1 and 2. FuzzEn2D at scale 4 (Fig. 3B) differed between PLH grades 1 and 2, as well as between PLH grades 1 and 3. DispEn2D at scale 5 (Fig. 3C) differed between PLH grades 0 and 1, as well as between PLH grades 1 and 2. DistEn2D at scale 3 differed between PLH grades 0–3 and PLH grade 4 (Fig. 3D). EspEn2D at scale 4 differed between PLH grades 2 and 3, as well as between PLH grades 2 and 4 (Fig. 3E). PermEn2D at scale 5 differed between PLH grades 1 and 3, as well as between PLH grades 2 and 3 (Fig. 3F).
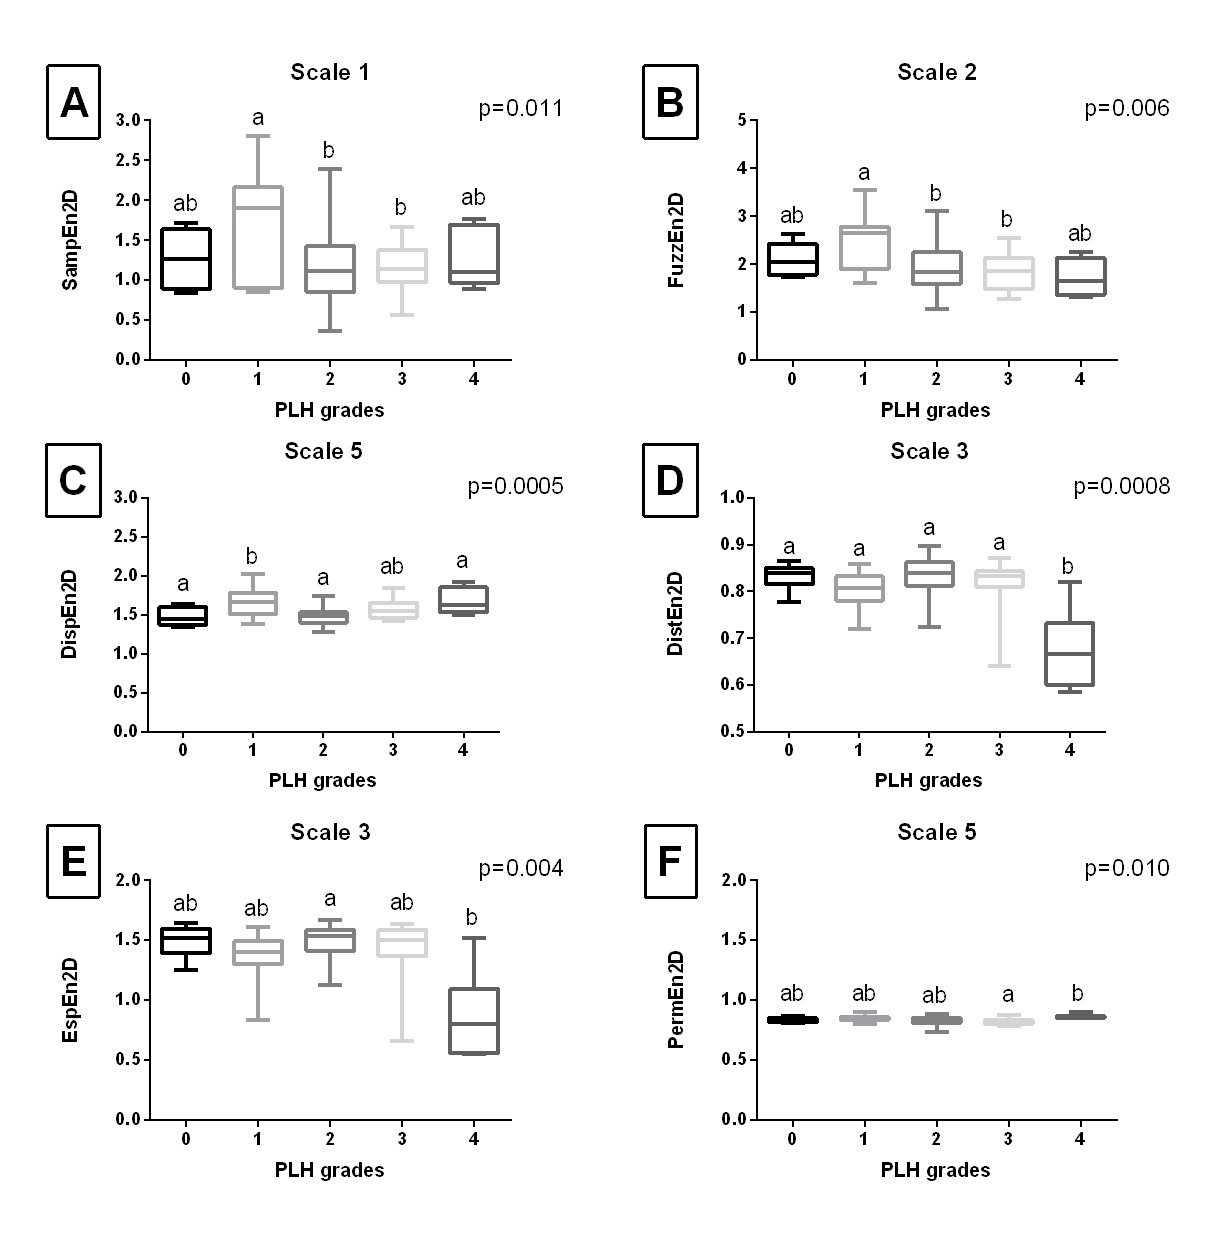
Fig. 2. The comparison of the two-dimensional entropy measures between the pharyngeal lymphoid hyperplasia (PLH) grades (0-4). Endoscopic images were filtered using Normalize filter. Data displayed for the two-dimensional sample entropy (SampEn2D) (A), fuzzy entropy (FuzzEn2D) (B), dispersion entropy (DispEn2D) (C), distribution entropy (DistEn2D) (D), Espinosa entropy (EspEn2D) (E), and permutation entropy (PermEn2D) (F) that yielded the lowest p value. Letters indicate differences between PLH grades (a, b) and lack of differences (ab) for p < 0.05
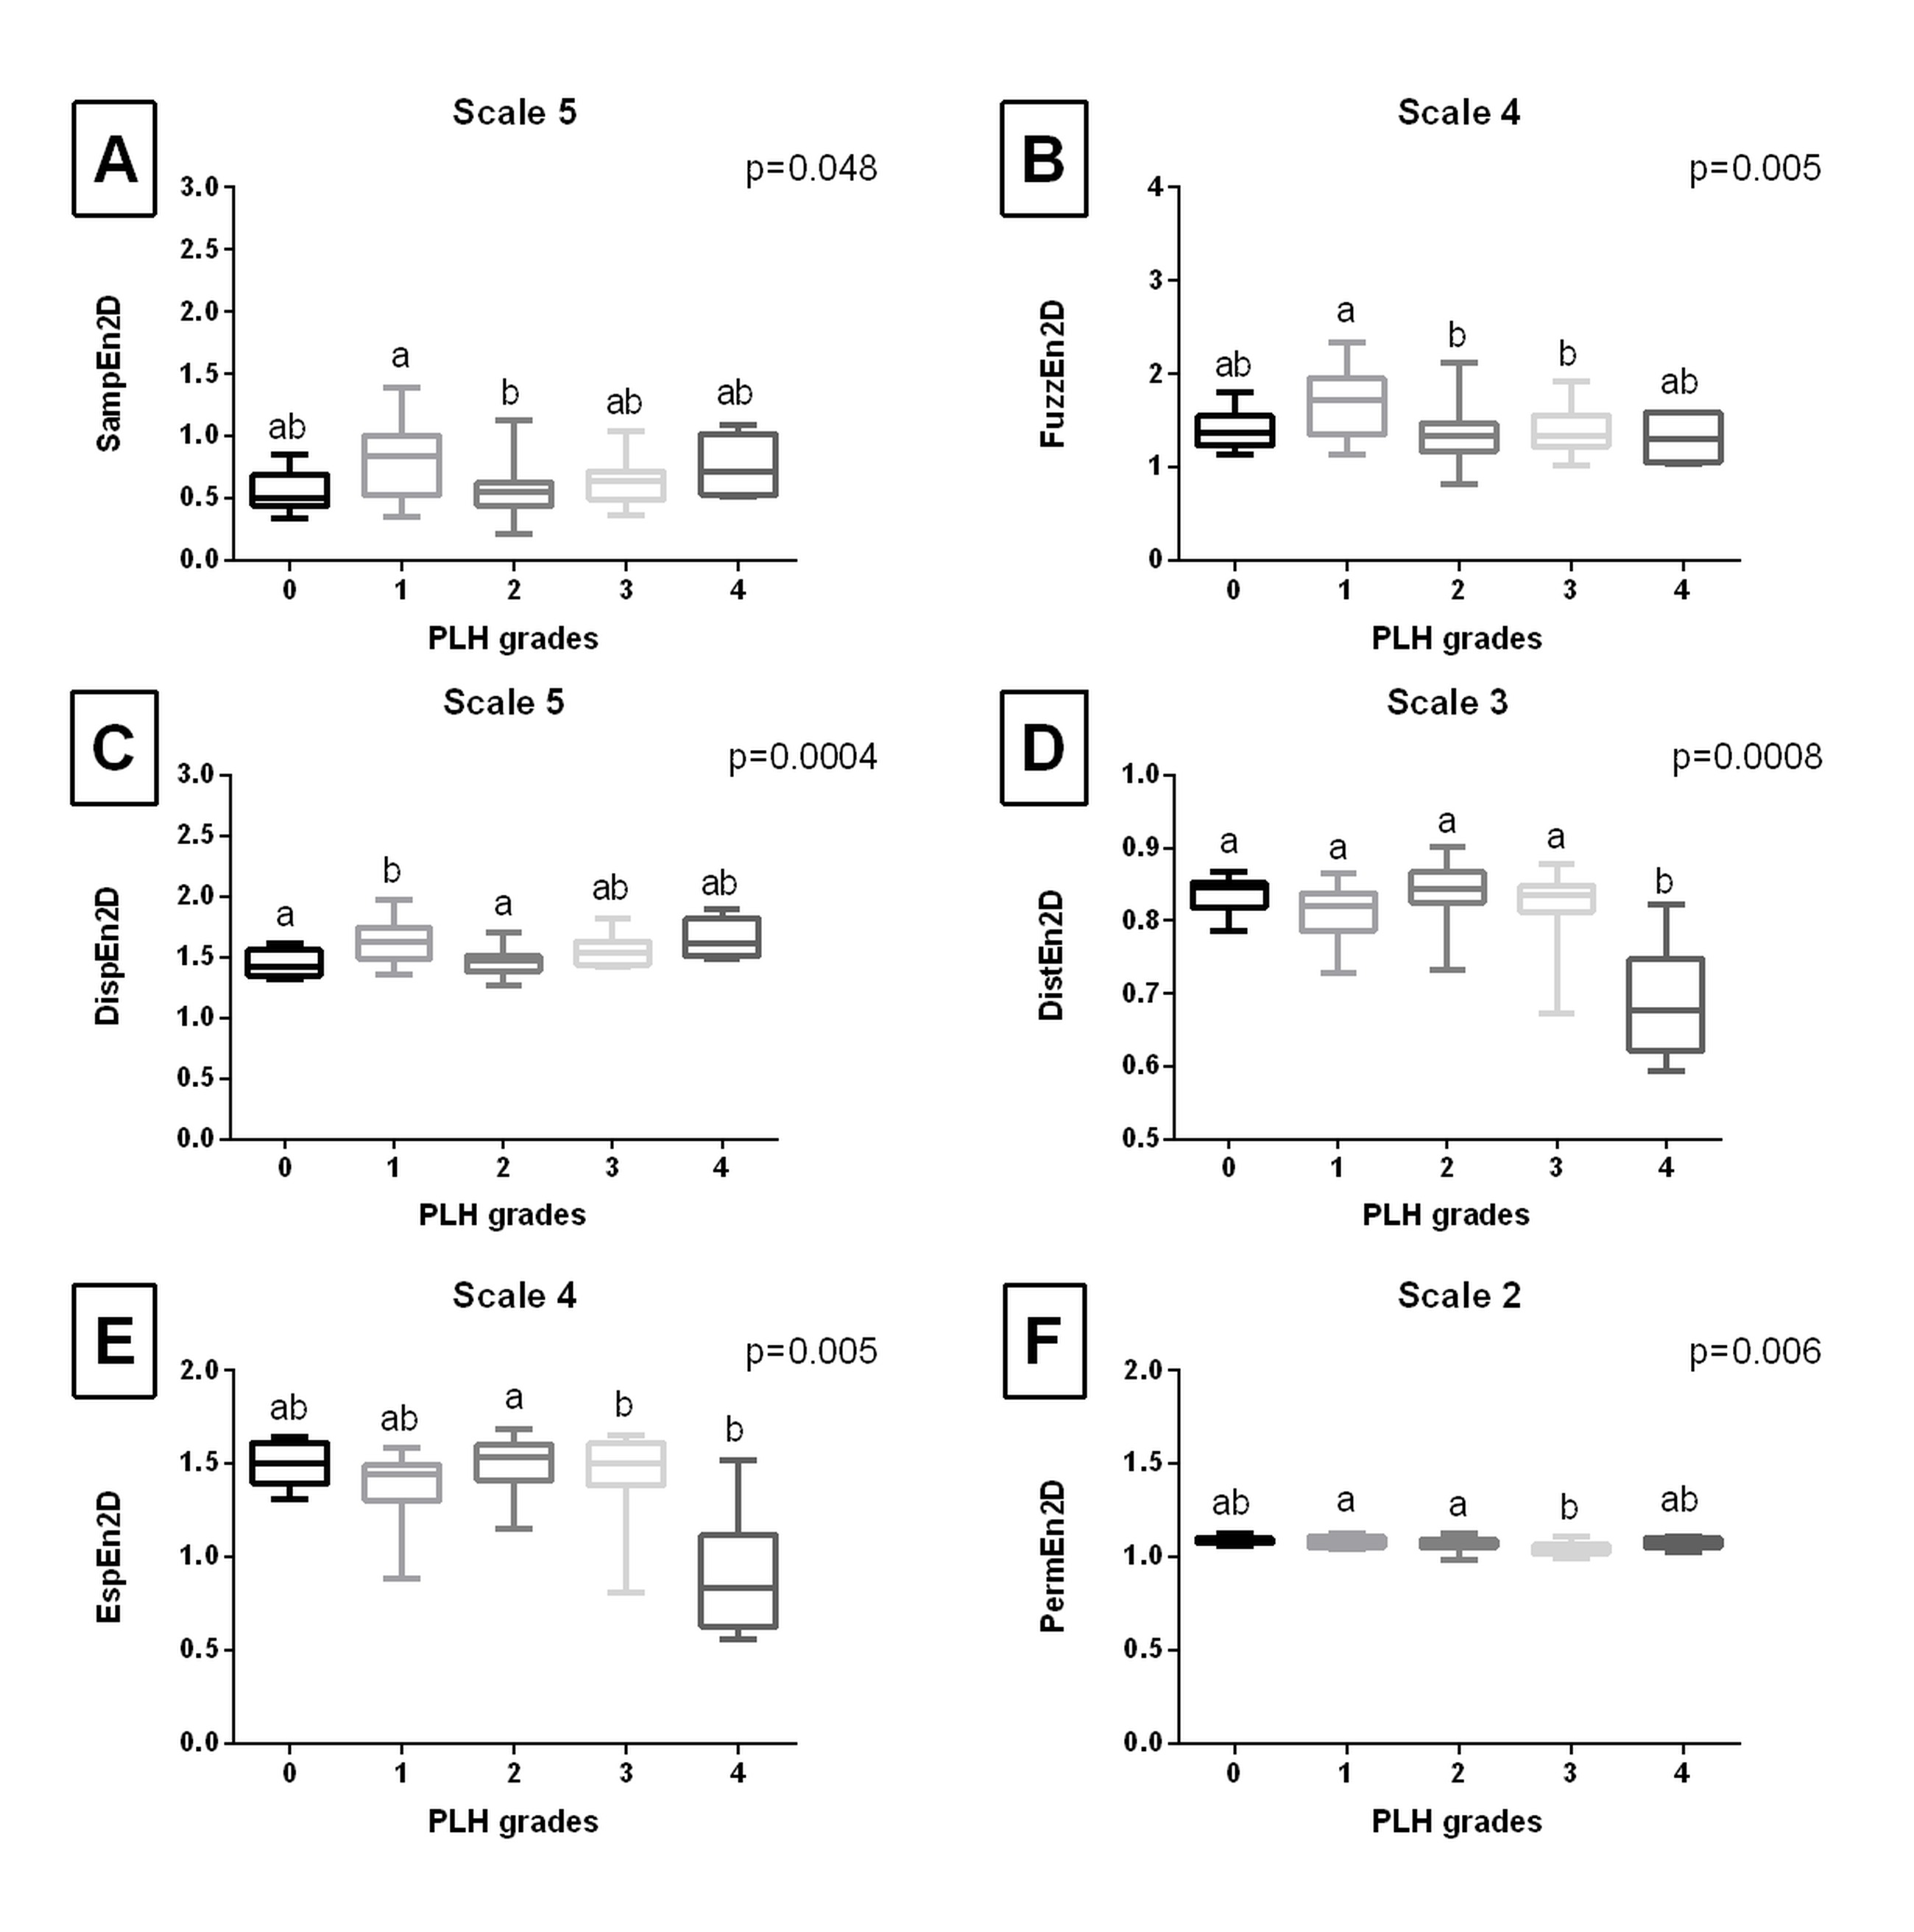
Fig. 3. The comparison of the two-dimensional entropy measures between the pharyngeal lymphoid hyperplasia (PLH) grades (0-4). Endoscopic images were filtered using Mean filter. Data displayed for the two-dimensional sample entropy (SampEn2D) (A), fuzzy entropy (FuzzEn2D) (B), dispersion entropy (DispEn2D) (C), distribution entropy (DistEn2D) (D), Espinosa entropy (EspEn2D) (E), and permutation entropy (PermEn2D) (F) that yielded the lowest p value. Letters indicate differences between PLH grades (a, b) and lack of differences (ab) for p < 0.05
Entropy measures across 5 scales, obtained from endoscopic images after Median filtering, are presented in Fig. S3 of the supplementary materials. Fig. 4. shows only the scale for each entropy measure that yielded the lowest p value. SampEn2D at scale 4 (Fig. 4A), FuzzEn2D at scale 5 (Fig. 4B), and DispEn2D at scale 5 (Fig. 4C) differed between PLH grades 1 and 2. DistEn2D at scale 3 differed between PLH grades 0-3 and PLH grade 4 (Fig. 4D). EspEn2D at scale 5 differed between PLH grades 2 and 3, as well as between PLH grades 2 and 4 (Fig. 4E). PermEn2D at scale 5 differed between four PLH grade pairs (1 and 2; 1 and 3; 2 and 4; 3 and 4) (Fig. 4F).
Entropy measures across 5 scales, obtained from endoscopic images after Laplacian filtering, are presented in Fig. S4 of the supplementary materials. Fig. 5. shows only the scale for each entropy measure that yielded the lowest p value. SampEn2D at scale 3 (Fig. 5A) and FuzzEn2D at scale 5 (Fig. 5B) differed between PLH grades 1 and 2, PLH grades 1 and 3, PLH grades 1 and 4 as well as between PLH grades 0 and 4, PLH grades 2 and 4, and PLH grades 3 and 4. DispEn2D at scale 4 differed between PLH grades 1 and 2 as well as between PLH grades 1 and 3 (Fig. 5C). DistEn2D at scale 5 differed between PLH grades 0–3 and PLH grade 4 (Fig. 5D). EspEn2D at scale 1 differed between PLH grades 0–2 and PLH grade 4 (Fig. 5E). PermEn2D at scale 5 differed between PLH grades 0 and 3 (Fig. 5F).
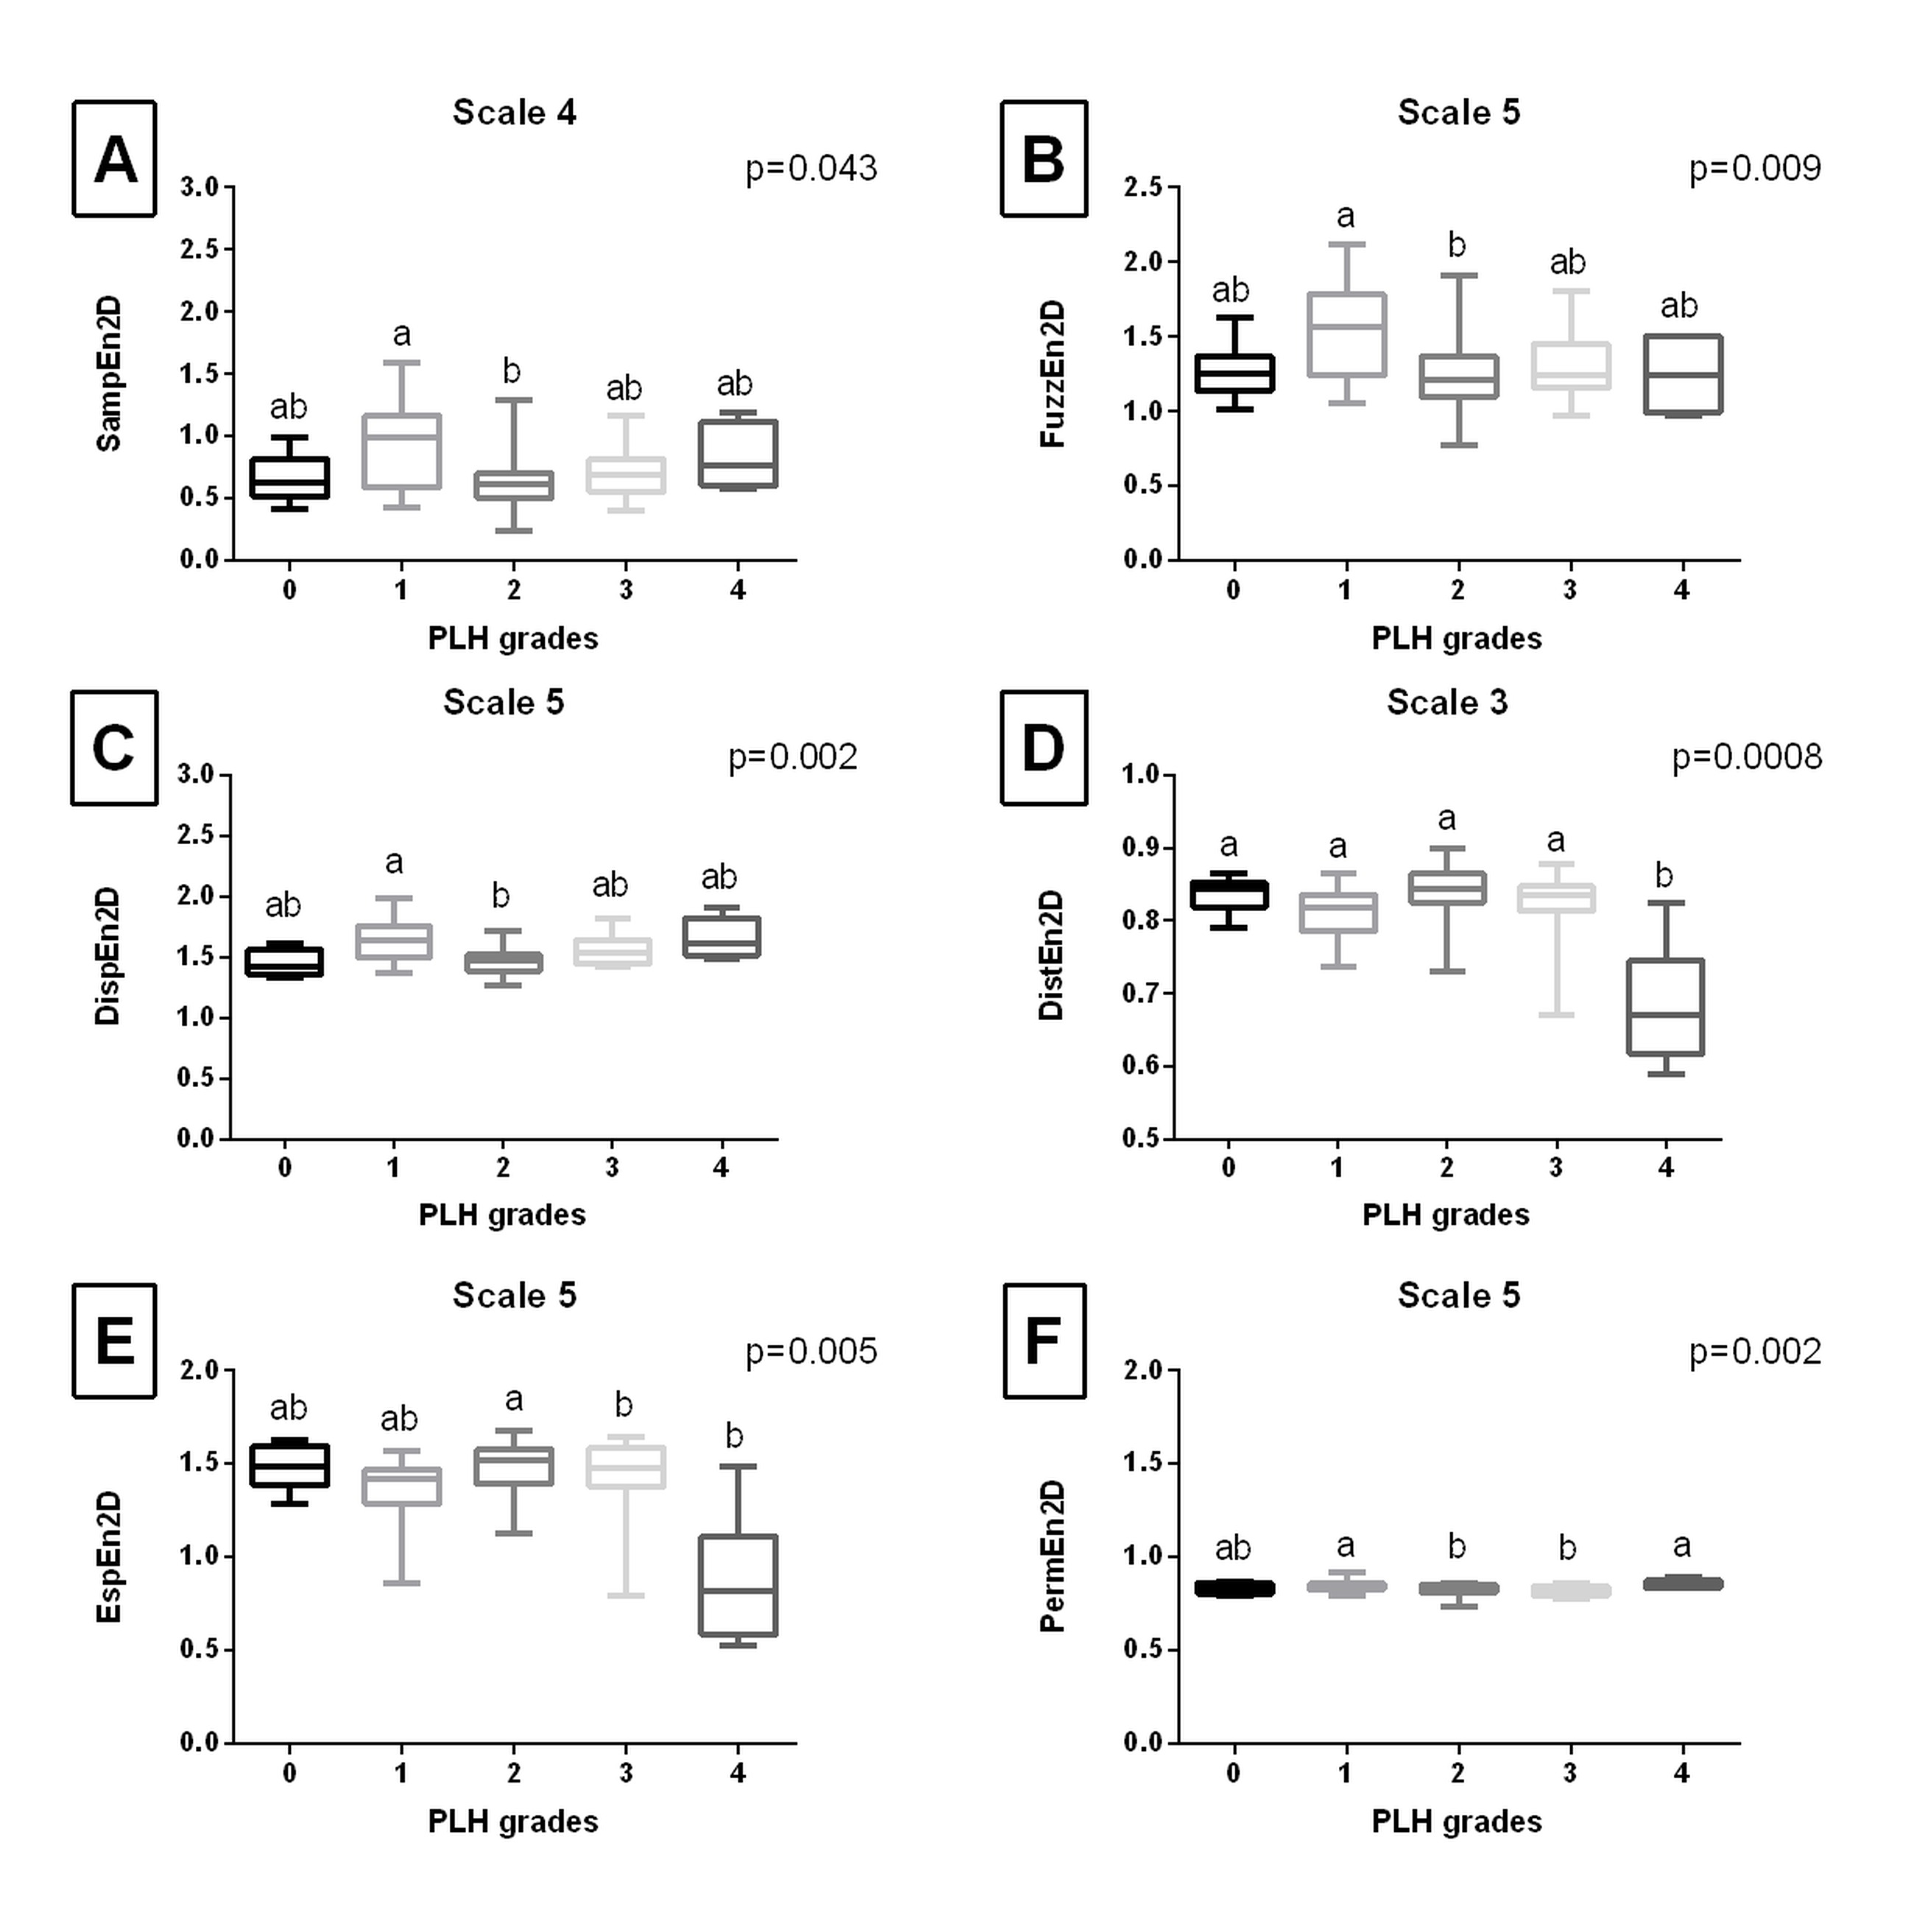
Fig. 4. The comparison of the two-dimensional entropy measures between the pharyngeal lymphoid hyperplasia (PLH) grades (0-4). Endoscopic images were filtered using Median filter. Data displayed for the two-dimensional sample entropy (SampEn2D) (A), fuzzy entropy (FuzzEn2D) (B), dispersion entropy (DispEn2D) (C), distribution entropy (DistEn2D) (D), Espinosa entropy (EspEn2D) (E), and permutation entropy (PermEn2D) (F) that yielded the lowest p value. Letters indicate differences between PLH grades (a, b) and lack of differences (ab) for p < 0.05
When single–scale two–dimensional entropy measures only in scale 1 were considered in PLH grades classification (Fig. 6A–D), the following entropy measures had the highest importance for classification results: FuzzEn2D > DispEn2D > DistEn2D > SampEn2D after Normalize filtering (Fig. 6A), DispEn2D > FuzzEn2D > EspEn2D > DistEn2D after Mean filtering (Fig. 6B) and Median filtering (Fig. 6C), as well as EspEn2D > DistEn2D > FuzzEn2D > DispEn2D after Laplacian filtering (Fig. 6D). However, this approach provides low classification metrics with the highest accuracy (0.47) for Normalize and Mean filtering, the highest precision (0.42) for Mean filtering, the highest recall (0.42) for Median filtering, as well as the highest F1 score (0.41) also for Median filtering (Tab. 1.).
When multi–scale two–dimensional entropy measures were considered in PLH grades classification (Fig. 6E–H), high classification metrics were achieved. The highest accuracy (0.86), precision (0.88), recall (0.87), and F1 score (0.85) were achieved for Median filtering. Moreover, also after the remaining filtrations, classification metrics were close to or greater than 0.70 (Tab. 1.). Thus, the highest classification metrics were achieved when the following only two entropy measures (FuzzEn2D and DispEn2D) were considered, however, across different scales. For this data set, the following entropy measures/scales data pairs had the highest importance for classification results: FuzzEn2D at scale 3 > FuzzEn2D at scale 4 > FuzzEn2D at scale 2 > DispEn2D at scale 4 (Fig. 6G).
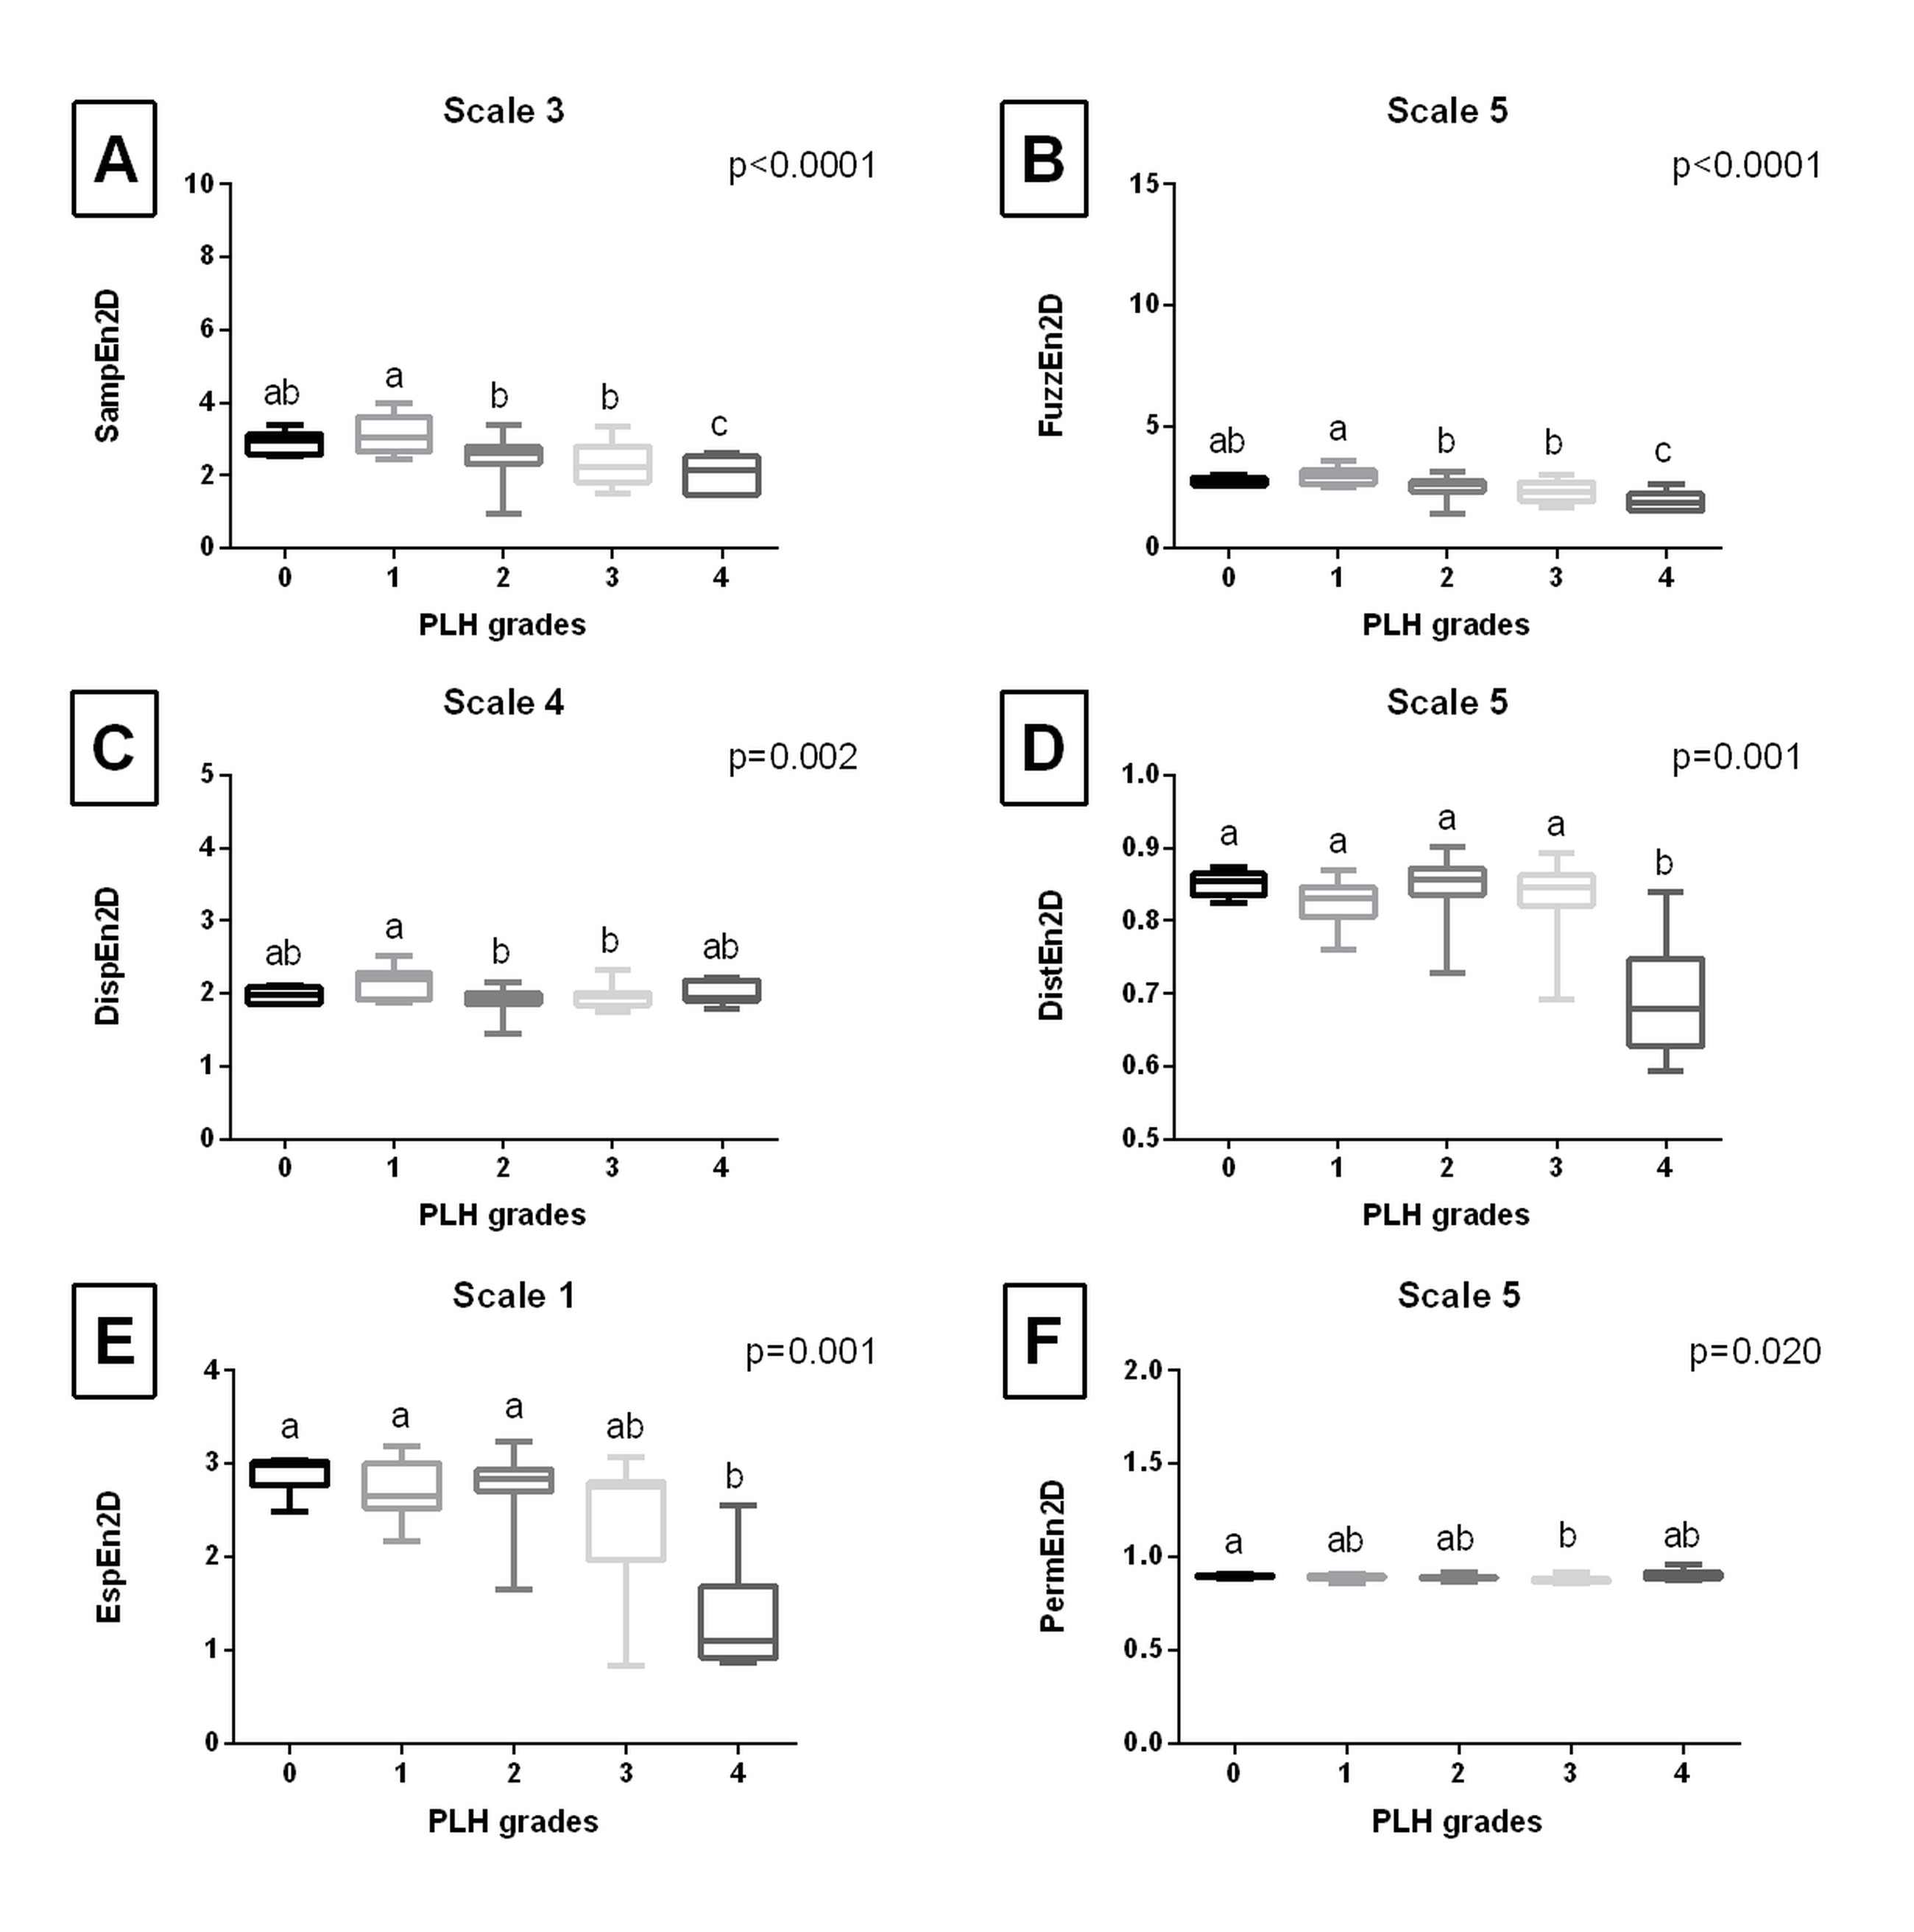
Fig. 5. The comparison of the two – dimensional entropy measures between the pharyngeal lymphoid hyperplasia (PLH) grades (0 – 4). Endoscopic images were filtered using Laplacian filter. Data displayed for the two – dimensional sample entropy (SampEn2D) (A), fuzzy entropy (FuzzEn2D) (B), dispersion entropy (DispEn2D) (C), distribution entropy (DistEn2D) (D), Espinosa entropy (EspEn2D) (E), and permutation entropy (PermEn2D) (F) that yielded the lowest p value. whereas whiskers represent minimum and maximum values. Letters indicate differences between PLH grades (a, b, c) and lack of differences (ab) for p < 0.05
Tab. 1
Classification metrics (accuracy, precision, recall, and F1 score) of the pharyngeal lymphoid hyperplasia (PLH) classification across single–scale (scale 1) and multi–scale (scales 1–5) and images filtered using Normalize, Mean, Median, and Laplacian filters
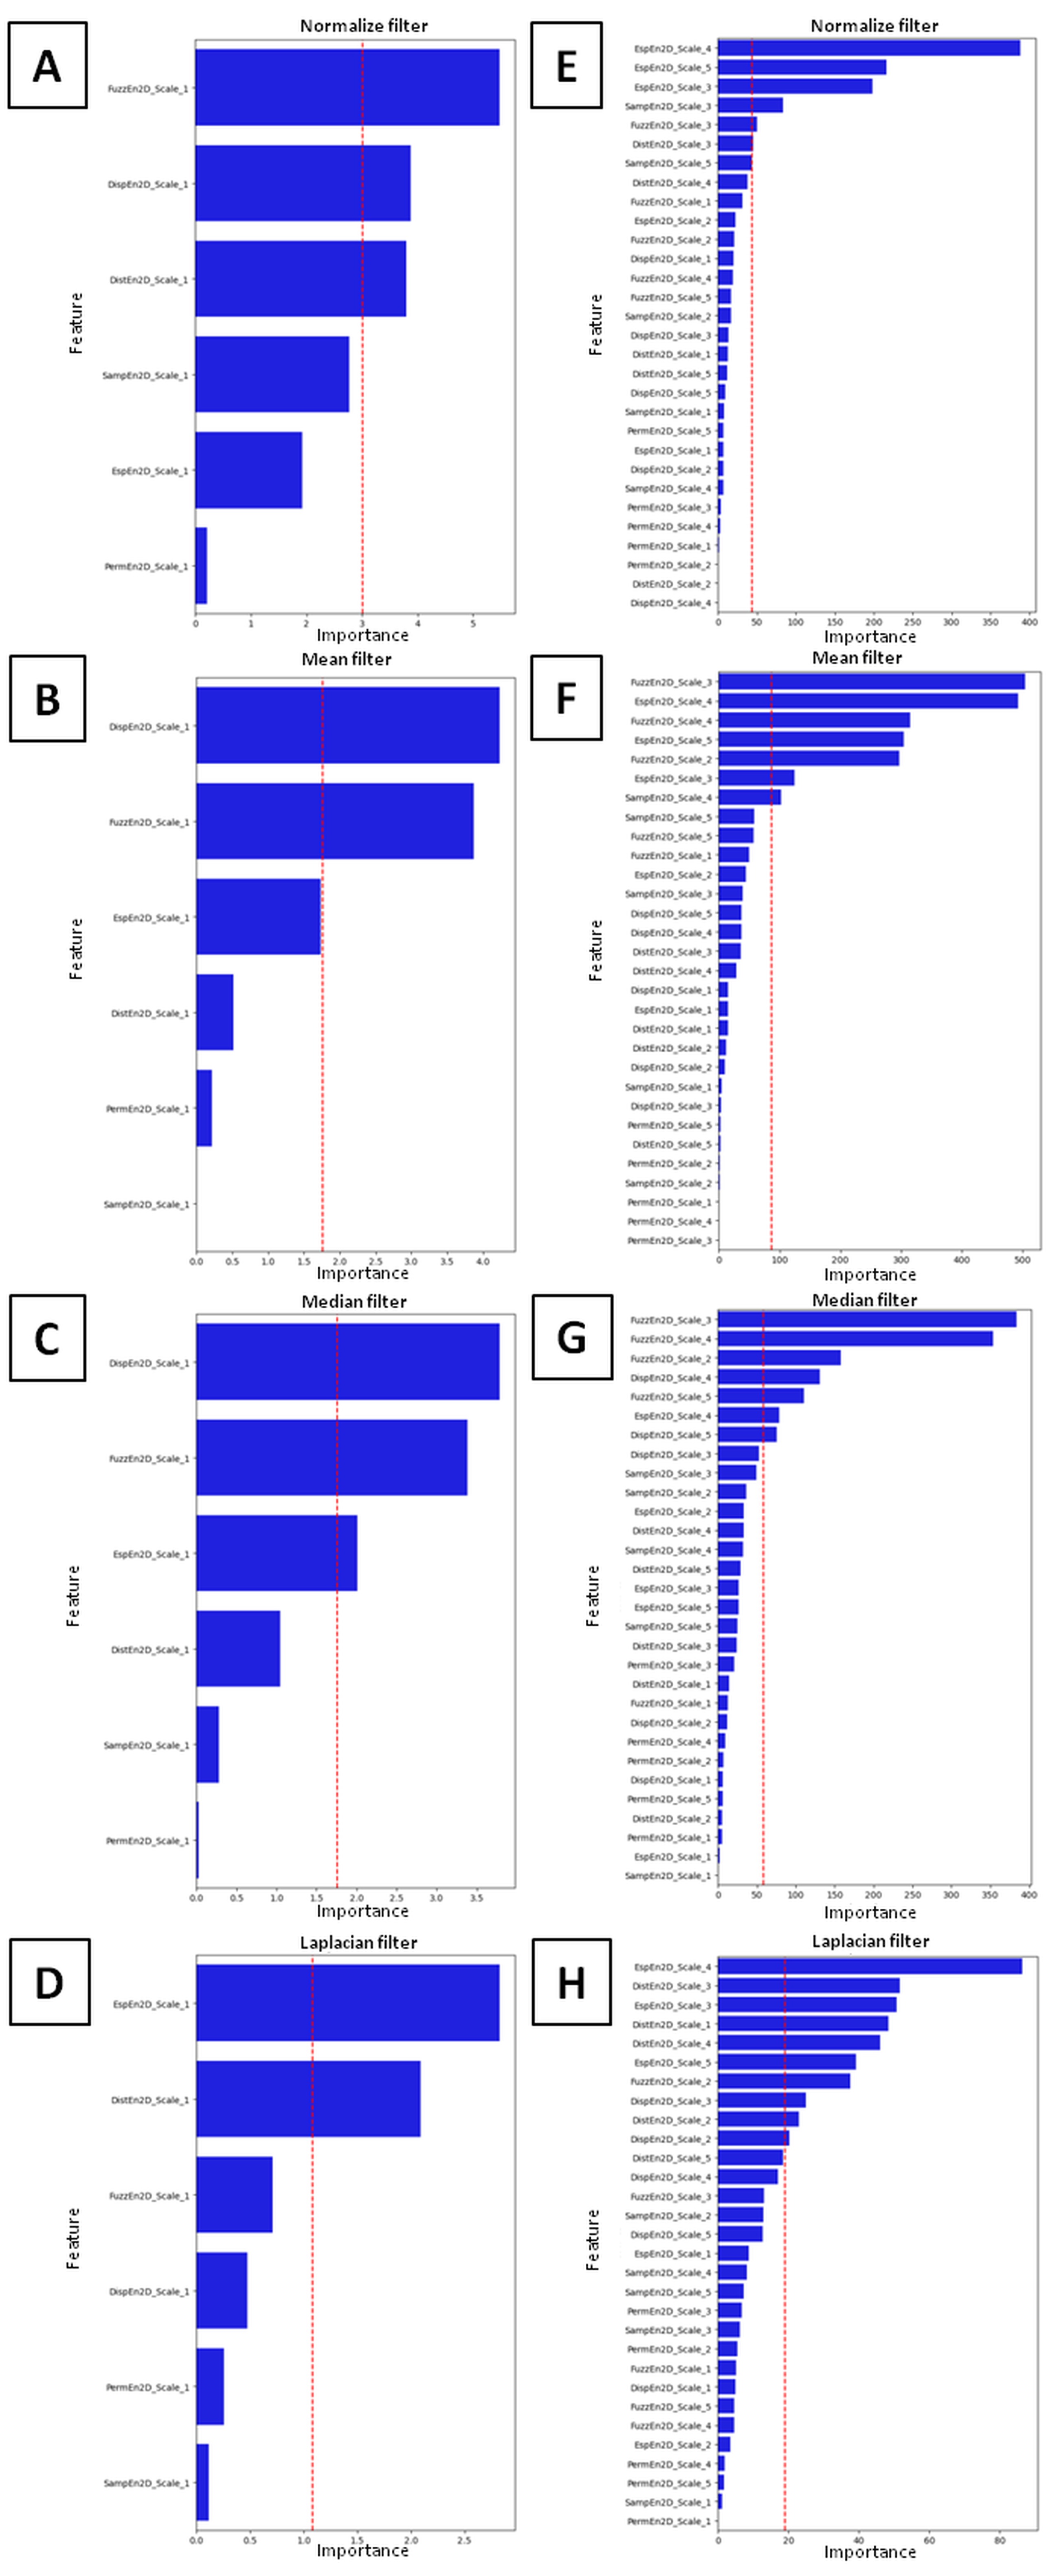
Fig. 6. Feature importance of the pharyngeal lymphoid hyperplasia (PLH) classification, computed using LDA, across single – scale (scale 1) (A – D) and multi – scale (scales 1 – 5) (E – H) and images filtered using Normalize (A,E), Mean (B,F), Median (C,G), and Laplacian (D,H) filters. The red dashed line indicates the mean value of importance for the considered data set
One may observe that the distribution of LDA components (Fig. 7) overlapped (which is visible when PLH grades occupy the same region of an LDA component in the density plots of the LDA components) the least for multi–scale two–dimensional entropy measures after Median filtering (Fig. 7G). In contrast, two classes overlapped after Mean filtering (Fig. 7F), three classes after Normalize filtering (Fig. 7E), and four classes after Laplacian filtering (Fig. 7H). Also for single–scale two–dimensional entropy measures only in scale 1, an overlap of four classes was observed after all studied filtering methods (Fig. 7A–D).
This class overlap was also visible in spatial distribution scatter plots (Fig. 8), also to the least extent for multi–scale two–dimensional entropy measures after Median filtering (Fig. 8G).
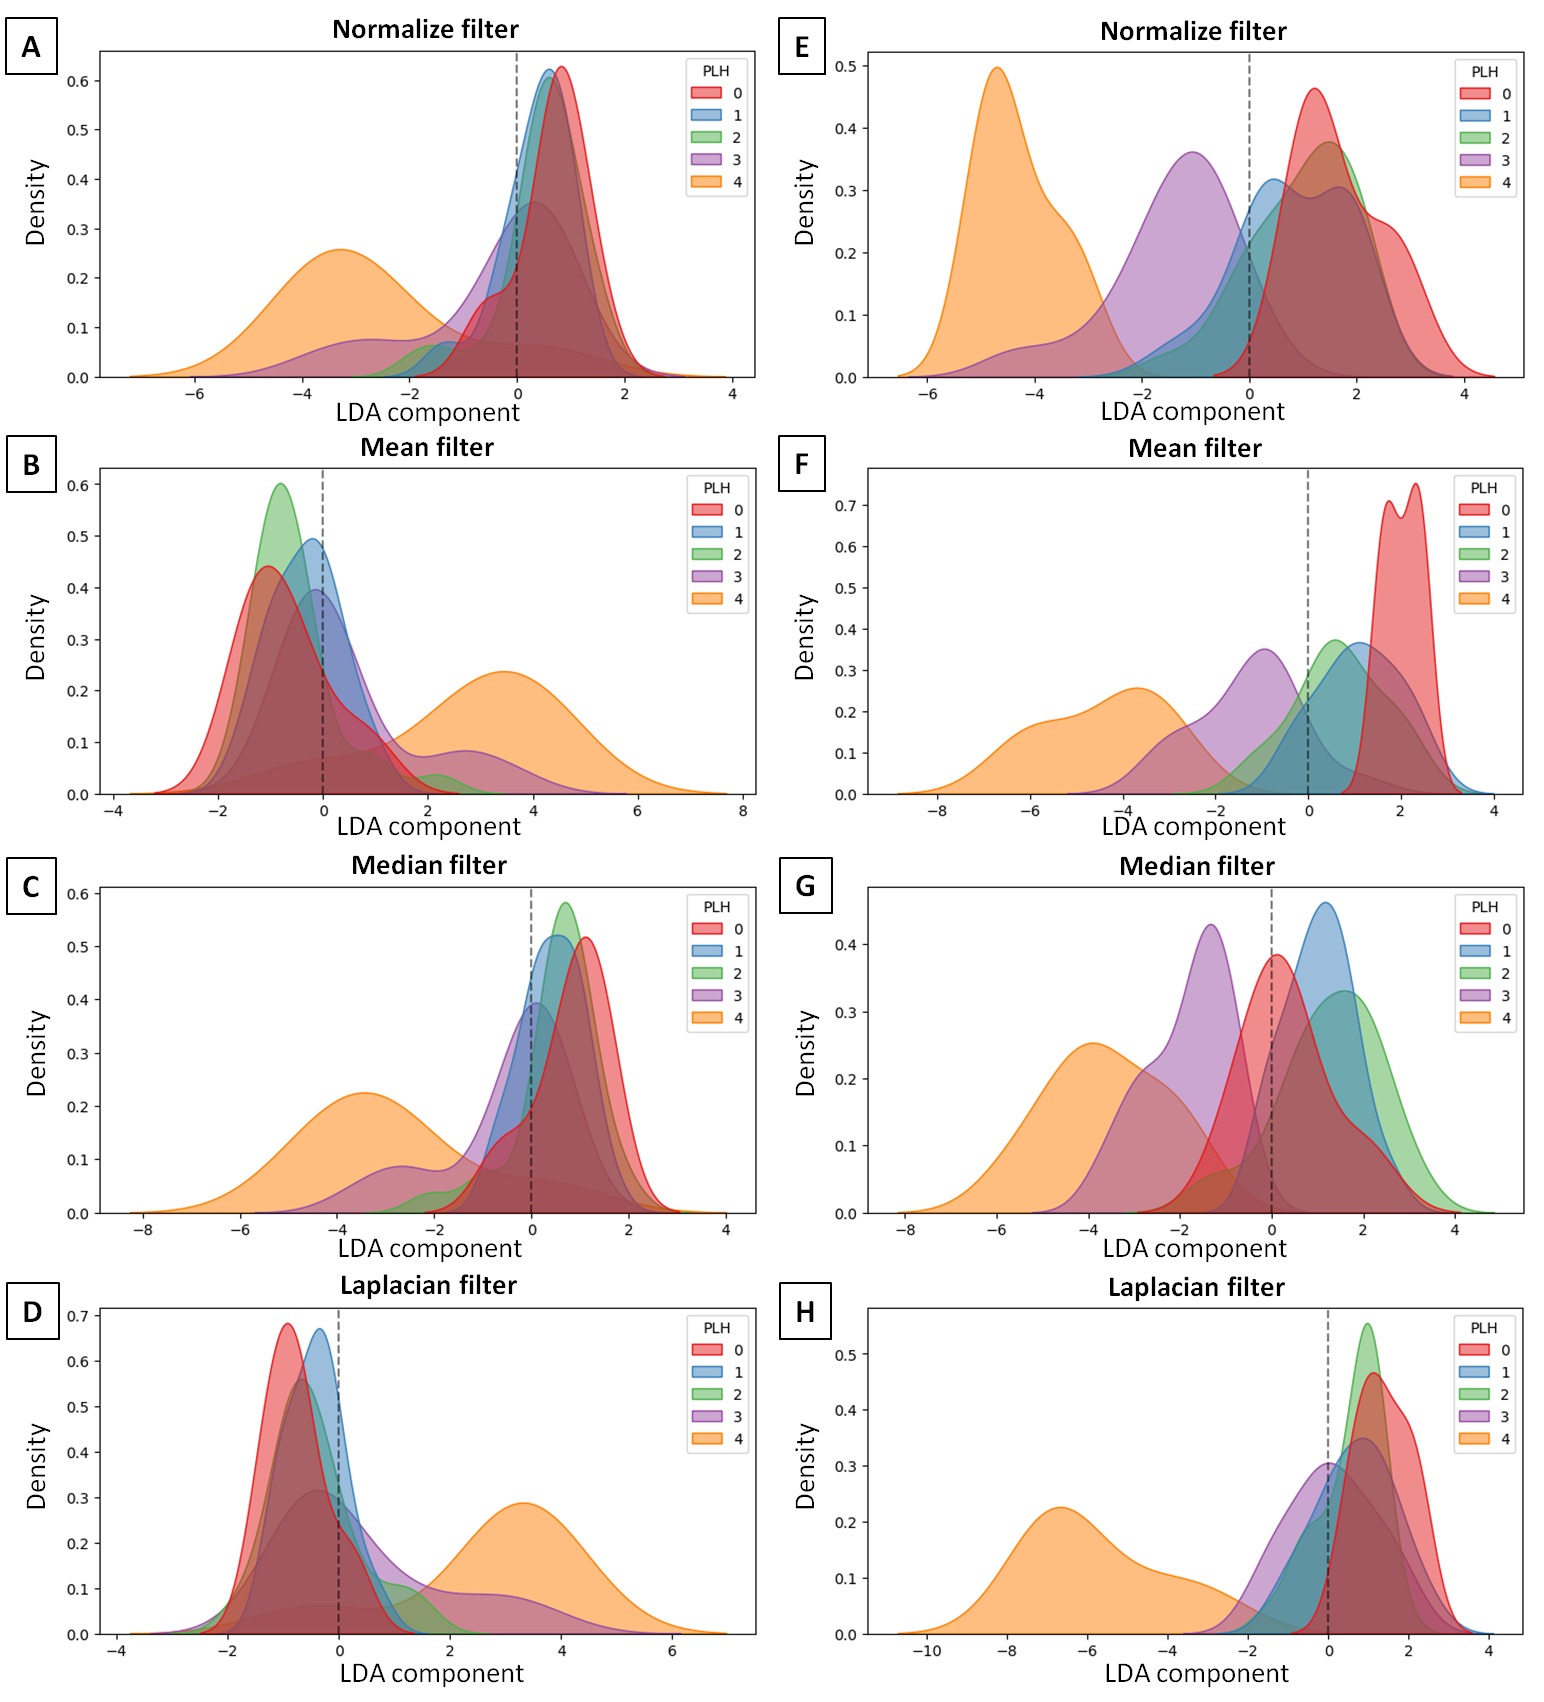
Fig. 7. Distribution of Linear Discriminant Analysis (LDA) component of the pharyngeal lymphoid hyperplasia (PLH) classification across single-scale (scale 1) (A-D) and multi-scale (scales 1-5) (E-H) and images filtered using Normalize (A,E), Mean (B,F), Median (C,G), and Laplacian (D,H) filters
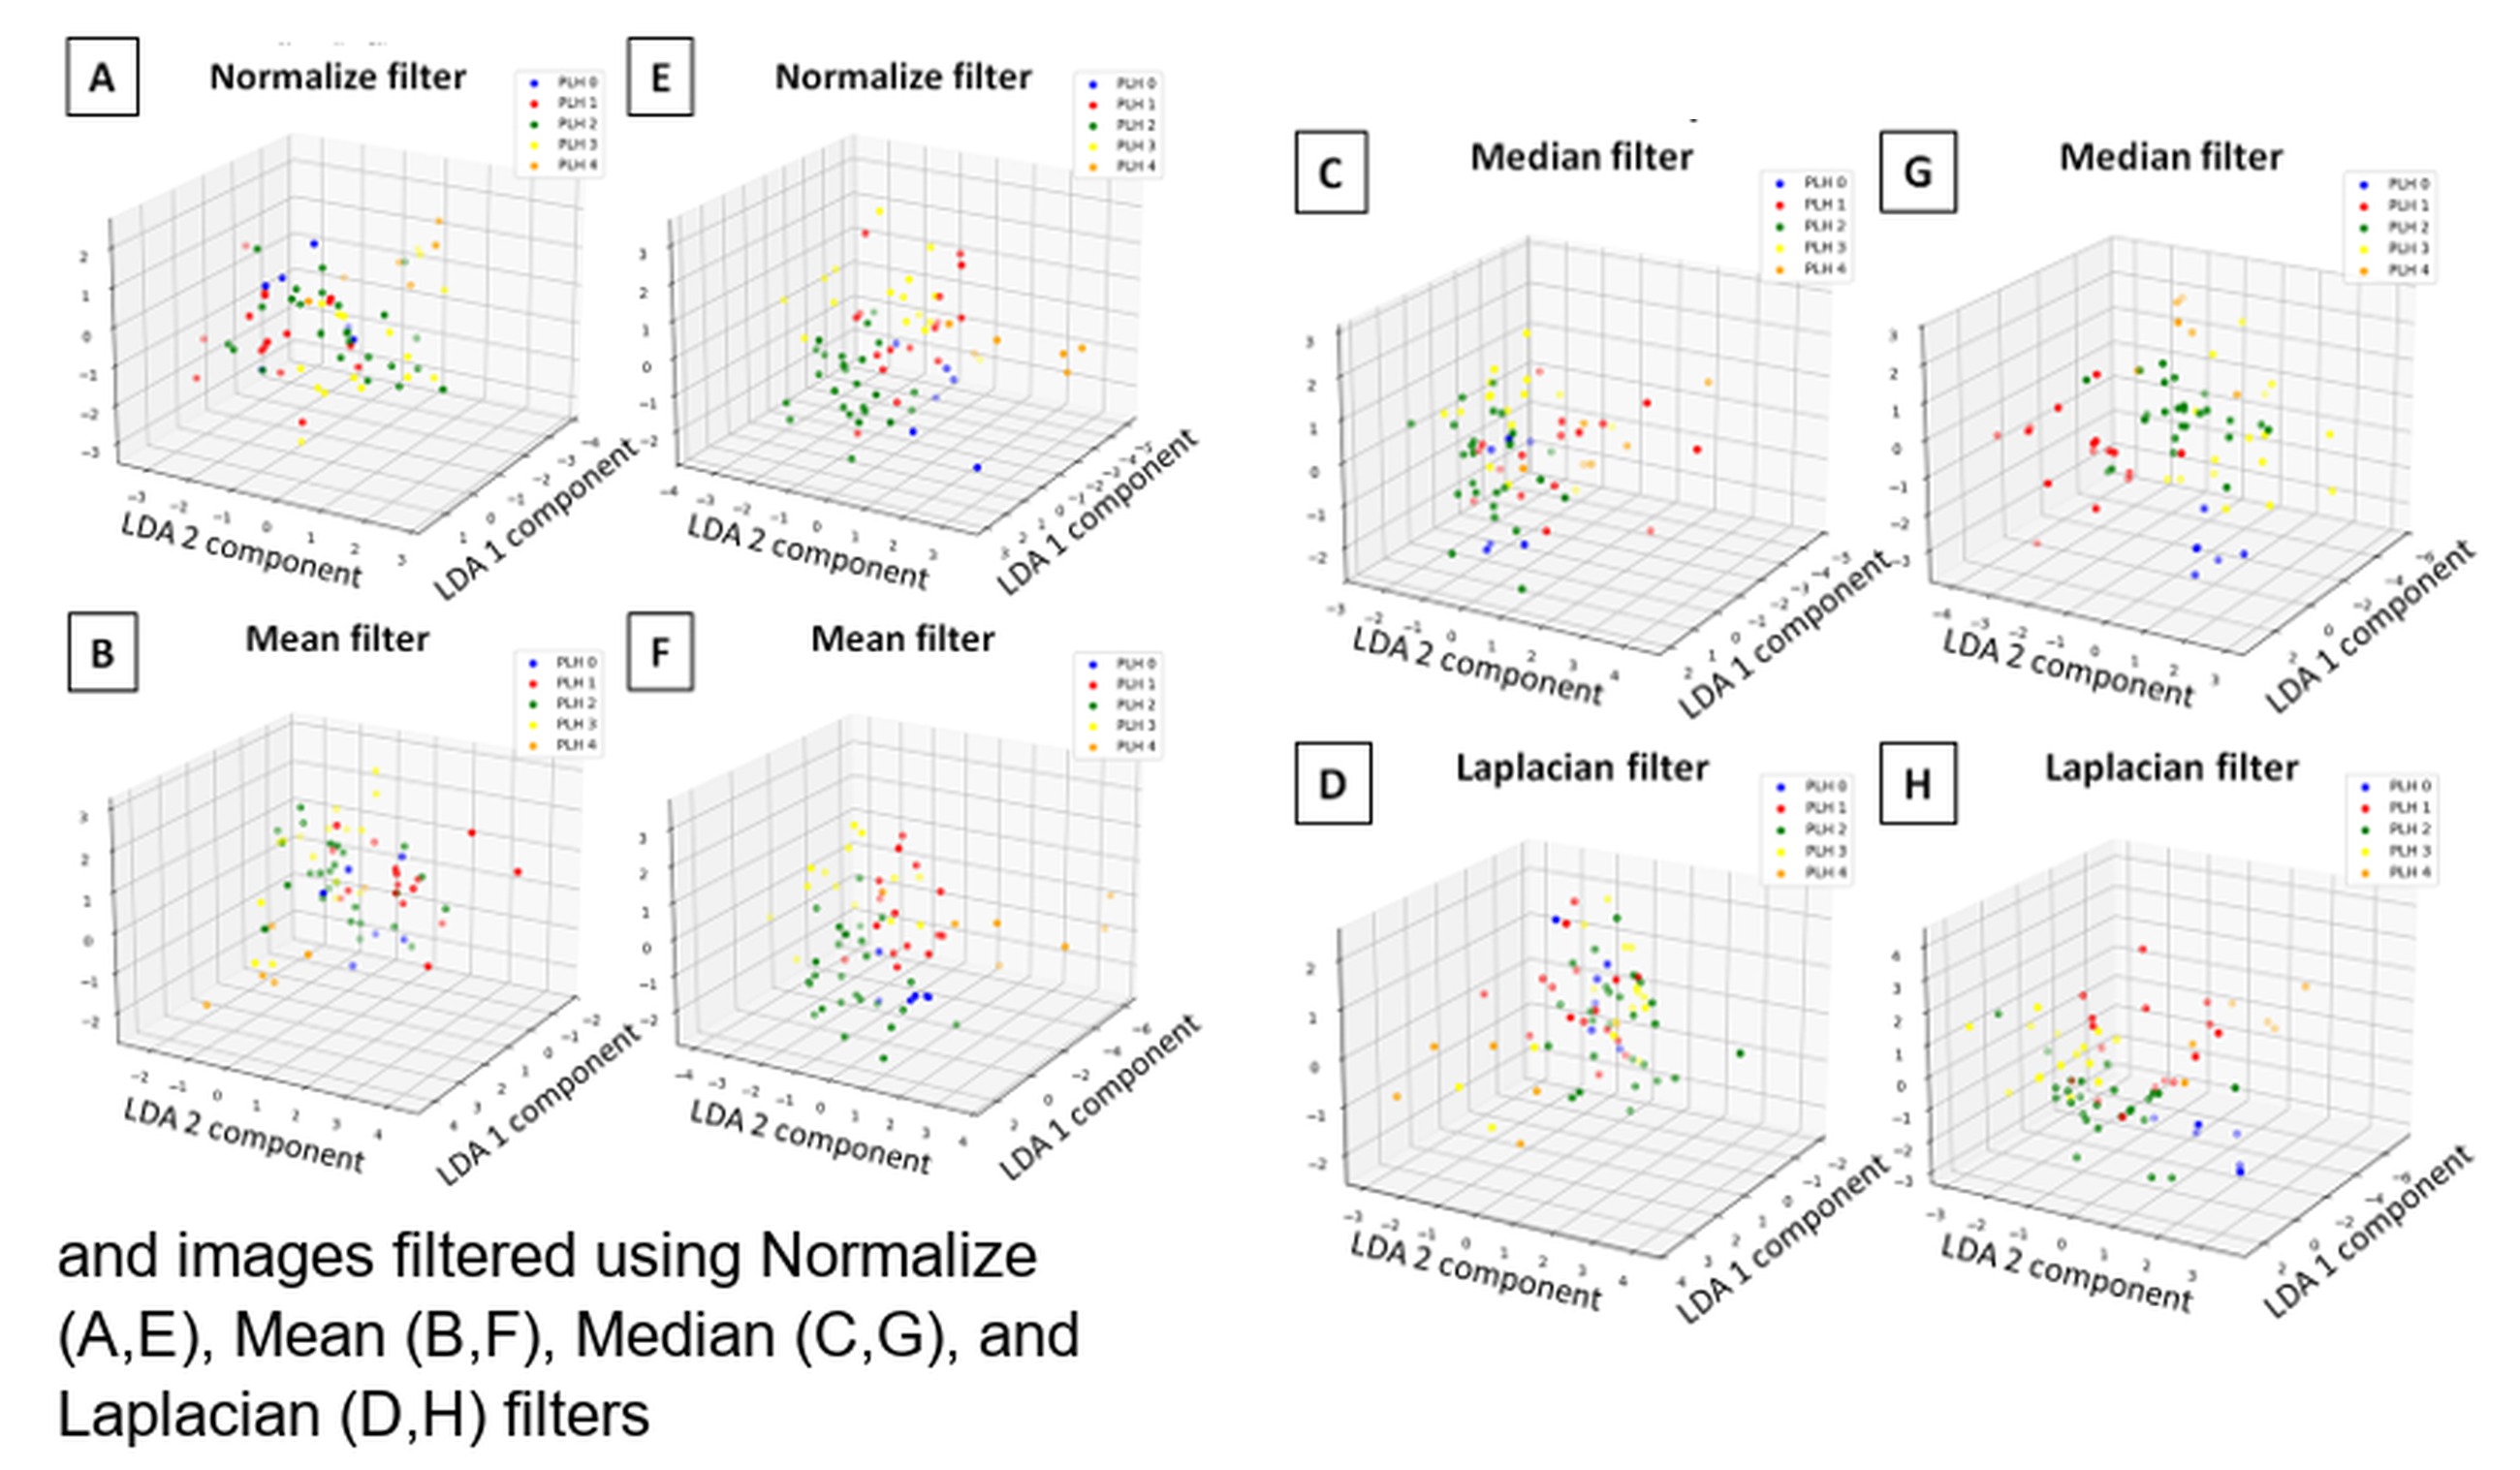
Fig. 8. Spatial distribution of Linear Discriminant Analysis (LDA) components (1,2) of the pharyngeal lymphoid hyperplasia (PLH) classification across single-scale (scale 1) (A-D) and multi-scale (scales 1-5) (E-H) and images filtered using Normalize (A,E), Mean (B,F), Median (C,G), and Laplacian (D,H) filters
. DISCUSSION
Two–dimensional multi–scale entropy measures quantitatively determines the complexity of an image, which is defined as a measure of irregularity across multiple spatial scales [56]. The current study showed that endoscopic images of equine pharynx differed in the complexity and irregularity regarding on the severity of endoscopic signs of pharyngitis. Since entropy measures are defined as the negative natural logarithm of the probability of a pattern occurring within an image [39, 41], images containing periodic, repetitive structures that reflect regular patterns yield low entropy values, whereas those with unpredictable, irregular patterns yield high entropy values.
Endoscopic images of PLH grade 0, representing a normal pharynx with not visually visible lymphoid follicles [15, 16], showed more periodic and repetitive structures of pharyngeal mucosa than endoscopic images of PLH grade 4, indicated by higher DistEn2D after all studied filtering methods as well as by higher SampEn2D, FuzzEn2D, and EspEn2D after Laplacian filtering. Endoscopic images of PLH grade 4 represent large edematous lymphoid follicles [15, 16], shifting the pharyngeal mucosa structure toward unpredictable and irregular. One may observe that the proliferation and growth of the lymphoid follicles in equine pharynx is thus associated with increased irregularity of mucosa, which may be captured on endoscopic images and quantified using specific entropy measures. Initial proliferation of the lymphoid follicles – reflected by the differences between PLH grades 0 and 1 [15, 16] – was characterized by DistEn2D after Normalize and Mean filtering. Increase in number of small lymphoid follicles – reflected by the differences between PLH grades 1 and 2 [15, 16] – was characterized by SampEn2D, FuzzEn2D, and DistEn2D after all studied filtering methods. Increase in size of lymphoid follicles from small to large – reflected by the differences between PLH grades 2 and 3 [15, 16] – was characterized by EspEn2D after Median and Mean filtering as well as by PermEn2D after Mean filtering. Finally, edema of large lymphoid follicles – reflected by the differences between PLH grades 3 and 4 [15, 16] – was characterized by DistEn2D after all studied filtering methods, FuzzEn2D after Laplacian filtering, as well as PermEn2D after Normalize and Median filtering.
Although two–dimensional entropy measures – across the studied filtering methods and specific scales – varied between individual PLH grades, they did not consistently increase or decrease in line with consecutive PLH grades. This may be due to differences in the component disordering measures of the pharyngeal endoscopic images, which tend to show higher values for small and very large, edematous lymphoid follicles in PLH grades 1 and 4, and lower values for numerous small and large lymphoid follicles in PLH grades 2 and 3. Nevertheless, the observed differences in two–dimensional entropy measures between PLH grades were sufficient to perform LDA of equine pharyngitis with high classification metrics exceeding 0.85. These strong results were achieved through the application of LDA for data transformation, followed by RF classification.
LDA is a technique that simplifies classification using supervised machine learning algorithm – e.g. RF algorithm [50]. LDAs primary objective is to distinguish between two or more classes – in the current study five classes representing PLH grades 0–4 – by modeling the differences between them [49]. LDA transforms features from a high–dimensional space into a lower–dimensional space, thereby simplifying classification. This transformation maximizes the ratio of interclass variance to intraclass variance by computing eigenvectors and eigenvalues. The eigenvectors associated with the largest eigenvalues define the most discriminative directions in the feature space. Therefore, LDA is a fundamental dimensionality reduction step in many classification algorithms [51, 52], which also proved useful for the RF algorithm applied to quantified endoscopic data. Given that RF algorithm is an ensemble machine learning method that constructs multiple decision trees – each making predictions independently – the final classification is determined by majority voting. Thus, RF algorithm is recognized for its high accuracy in multi–class classification tasks and its roboustness against overfitting [54, 55]. These advantages were the reason for choosing the RF algorithm as a method applied to the current five–class classification of the data set consisting of only 70 realizations; however, no other supervised machine learning algorithm – e.g., the k–nearest neighbors (kNN) algorithm [57, 58] or Support Vector Machine (SVM) algorithm [59, 60] – was investigated.
One may observe that RF classification based on the multi–scale entropy measures achieved higher classification metrics (0.86 accuracy, 0.88 precision, 0.87 recall, and 0.85 F1 score) compared with those based on measures extracted at scale 1, only filtered with the same filtering method (0.46 accuracy, 0.41 precision, 0.42 recall, and 0.41 F1 score). Multi–scale measures capture image complexity through two main steps: (1) a coarse–graining process, which removes high–frequency image components using a digital low–pass filter and downsamples the filtered data by a scale factor s, and (2) entropy calculation for all coarse–grained data at each scale s [56]. In the two–dimensional multi–scale approach in this study, the coarse–graining is applied to the endoscopic images at spatial scales, after which the two–dimensional entropy value is computed for each coarse version of the original endoscopic image. It may suggest that images' spatial scales contain digital data that are more useful for RF classification and thus CAD than the original images.
Therefore, extracting two–dimensional multi–scale entropy measures from endoscopic images processed with Median filtering may be proposed as an effective method for quantifying endoscopic signs of equine pharyngitis. This method may be clinically useful for automatization [30-32] screening, identifying, and monitoring early endoscopic signs of equine respiratory tract inflammation, just as it is the case with humans, CAD of gastrointestinal tract diseases [32-36].
. CONCLUSION
An application of two–dimensional entropy measures quantifies endoscopic features of normal equine pharyngeal mucosa and mucosa affected by the PLH, allowing PLH grades classification. RF classification based on the multi–scale entropy measures provides higher classification metrics than those based on scale 1. Combining multi–scale two–dimensional entropy measures – particularly FuzzEn2D and DispEn2D – and Median filtering enables the best discrimination of endoscopic signs of PLH, supporting CAD of active respiratory tract inflammation in equine veterinary medicine.