
Introduction
With the rapid technological development in the agricultural industry, where advanced machinery plays a key role in increasing efficiency, using artificial intelligence in monitoring [1] and diagnosing their technical condition [2] is becoming increasingly important. AI offers innovative solutions, enabling continuous analysis of data from sensors and vision systems to identify subtle anomalies and predict potential failures before they occur. This proactive approach, supported by machine learning algorithms, allows optimization of maintenance schedules, minimizing field downtime and reducing repair costs. Thus, AI-based diagnostic systems [19] are crucial for advancing automation and improving agricultural machinery reliability.
To enhance the process of agricultural machinery damage detection, the implementation of computer tools based on image detection and classification [3] is being considered. The utilization of deep learning algorithms, with a particular focus on convolutional neural networks (CNNs) [20], has emerged as a promising methodology. The following paper [4] provides a detailed description of the application of a CNN network tasked with the recognition of household items and their surroundings, including bicycles, chairs, and deer. The study, which was based on a database of 6,000 images, found that the CNN algorithm achieved a detection accuracy of (74%) for the class "bicycle," (89%) for "chair," and (87%) for "deer" after a training process. The authors of the study did not implement additional modifications to the input data. However, a common challenge in the process of acquiring samples for training algorithms is the scarcity of available data. Examples of data augmentation techniques employed to enhance the performance of models that recognize objects using images are presented in the paper [5].
In their experiment, the researchers employed the RVL-CDIP database to train the CNN model, implementing image operations such as resolution change, Gaussian blur, mirroring, and image rotation. The findings indicated a (1%) enhancement in the efficacy of image recognition algorithms. A frequently employed contemporary model that is founded upon CNN algorithms [20] for object detection is the YOLO model [14], along with methodologies that utilize SSD detection blocks [6]. The application of the aforementioned model can be seen in the work of two scientific teams. The first team, described in the work [7], undertook the task of detecting corn seedlings in the natural environment. The use of detection using the YOLO architecture was aimed at reducing the pollution factor and promoting sustainable agricultural development. To train the algorithm, the team initially collected 1,000 images of seedlings. Then, through the use of digital augmentation involving a fourfold 90-degree rotation, the database size was increased to 2,400 samples. The implementation of the YOLO algorithm achieved a seedling detection efficiency of (86.66%).
The YOLO model is used in the analysis of images acquired from cameras on unmanned aerial vehicles to monitor forest areas to identify pine wilt disease [8]. The model's detection efficiency of disease outbreaks was achieved by the research team at (88%). The model allows both analysis of static images, and video and real-time detection of camera images. Another application of the YOLO model in image analysis is presented in paper [9]. The authors conducted an experiment to train an algorithm to detect objects from the environment of working agricultural machinery using the YOLOv8 architecture. The training process employed the COCO database and drew parallels between examples from seven different databases. The dataset comprised examples of objects such as people, cars, agricultural machinery, and other environmental elements that can be found in the environment of a working agricultural machine. The author trained two variants of the model: nano and small, with both models undergoing a training process comprising 80 epochs. The findings demonstrated a high level of detection efficiency for the "combine" (97%) and tractor (94%) classes. The efficiency of the algorithms was found to be lower in detecting objects such as humans (71-75%), cars (83%), tractors (82%) and agricultural machinery (84%).
In the extant literature concerning the YOLO family of models, comparative analyses of different architectural variants in terms of their effectiveness are commonplace. Of particular interest to researchers are the YOLOv8 and YOLOv11 versions, due to their similar structure and mechanism of operation. An example of such a comparison is furnished by the studies presented in papers [10, 11]. The paper [10] presents a study focusing on the detection of seedlings at different stages of development and the evaluation of their resistance to herbicides. In the course of the experiment, the researchers made use of a collection of 2,348 colour photographs. Furthermore, a range of variants of the YOLO model were employed in the analysis, including YOLOv11 and YOLOv8. The findings of the experimental trials demonstrated comparable object recognition accuracies, attaining (91%) and (92%), respectively. Furthermore, the objective of the study was to ascertain the time taken to detect the presence of the virus. Within the conditions of the natural plant growth environment, YOLOv11 demonstrated a superior object detection speed, outperforming the YOLOv8 model by 10.5 milliseconds. The findings suggest that, while the accuracy rates of the two versions of the model are comparable, the newer version exhibits substantially reduced detection times.
In this article, a comparative analysis of two neural network (NN) architectures, YOLOv11x and YOLOv8x, is conducted. The evaluation of the algorithms was based on the task of detecting specific defects in an agricultural rotary tedder machine. The training of the models was facilitated by a visual dataset that had been acquired under conditions of actual machine operation. The article provides a comprehensive account of the process of preparing the database, which involves the division of the database into three separate sets. In two group, digital data augmentation methods were used to increase the number of training samples. The process of acquiring knowledge of both models using the prepared sets is presented, and an analysis of the results is obtained. A detailed comparison of the performance of the two YOLO models was made based on the confusion matrix.
The main novelty of this study aims to evaluate the feasibility of using AI-based models to detect potential damage in our specific use case. Therefore, the primary contribution of this work is a practical, empirical comparison of two state-of-the-art, off-the-shelf YOLO architectures (YOLOv8x and YOLOv11x) for a specific, data-constrained agricultural fault detection task. We provide a detailed analysis of their performance under data scarcity, the impact of progressive dataset augmentation, and practical insights for implementing such systems in real-world conditions. In particular, machine component recognition using vision systems has the potential to allow for the identification of damage types in real time and during machine maintenance. It is possible that this could reduce operating costs and ultimately mitigate potentially harmful environmental impacts.
Methodology
The task was accomplished by utilizing the YOLOv11x and YOLOv8x models to detect the elements of the teeth of an agricultural machine. Models were trained using the PyTorch framework [16] and the Ultralytics YOLO library [14], utilizing physical hardware equipped with CUDA technology [17] version 12.6. The process incorporated the NVIDIA GeForce RTX 3060 Laptop GPU, the Windows 10 Pro operating system, and the Visual Studio development environment.
A dedicated database has been developed for the training of neural networks, with the networks being extracted from video recordings of mowing operations. The parameters of the footage are shown in Tab. 1. The footage was recorded from the vantage point of a standing individual observing the operation of the machine in a working environment. The extraction of frames from the video into individual images in graphic format was made with DaVinci Resolve 17 software. In addition, 291 photos of the SaMASZ P10-1100 rotary tedder machine were taken to mitigate the dataset imbalance. The focus was mainly on potential damage to the teeth. This allowed for the expansion of the input data for model learning.
Tab. 1
Features of video materials
Video | Format | Resolution | FPS | Time (s) |
1 | mp4 | 1920x1080 | 30 | 67 |
2 | mp4 | 1920x1080 | 30 | 16 |
The acquired materials were added and pre-processed before they were given to the input of the YOLO network model. Based on the acquired materials, three datasets used to train the neural network will be prepared. Assumptions for the use of the effects for the databases are shown in Tab. 2. Effects imposed on the materials are as follows:
- Rotate +45* and -45* to achieve up to a full 360-degree rotation;
- changing the colour palette;
- changing the resolution;
- pixelation;
- black-white contrast;
- changing threshold values.
Modifications applied to the database
Tab. 2
Dataset V1 | Dataset V2 | Dataset V3 | |
rotation | YES | YES | YES |
colour change | NO | YES | YES |
resolution | YES | YES | YES |
black and white | NO | YES | YES |
threshold change | NO | YES | YES |
pixelate | NO | YES | YES |
additional data | NO | NO | YES |
The training of neural networks will be performed based on two models: YOLOv11x and YOLOv8x. Each model must undergo a learning process using Datasets. The machine on which the learning process will be carried out is shown in Tab. 3.
Tab. 3
Parameters of the computer using to learning NN
RAM | VRAM | Processor | Disk | Graphic | OS |
32 GB DDR4 3200 MHz | 6 GB | AMDRYZEN 7-5800H 3.20 GHz | 1T/ M.2 SSD | NVIDIA GeForceRTX 3060 | Windows 10 Pro |
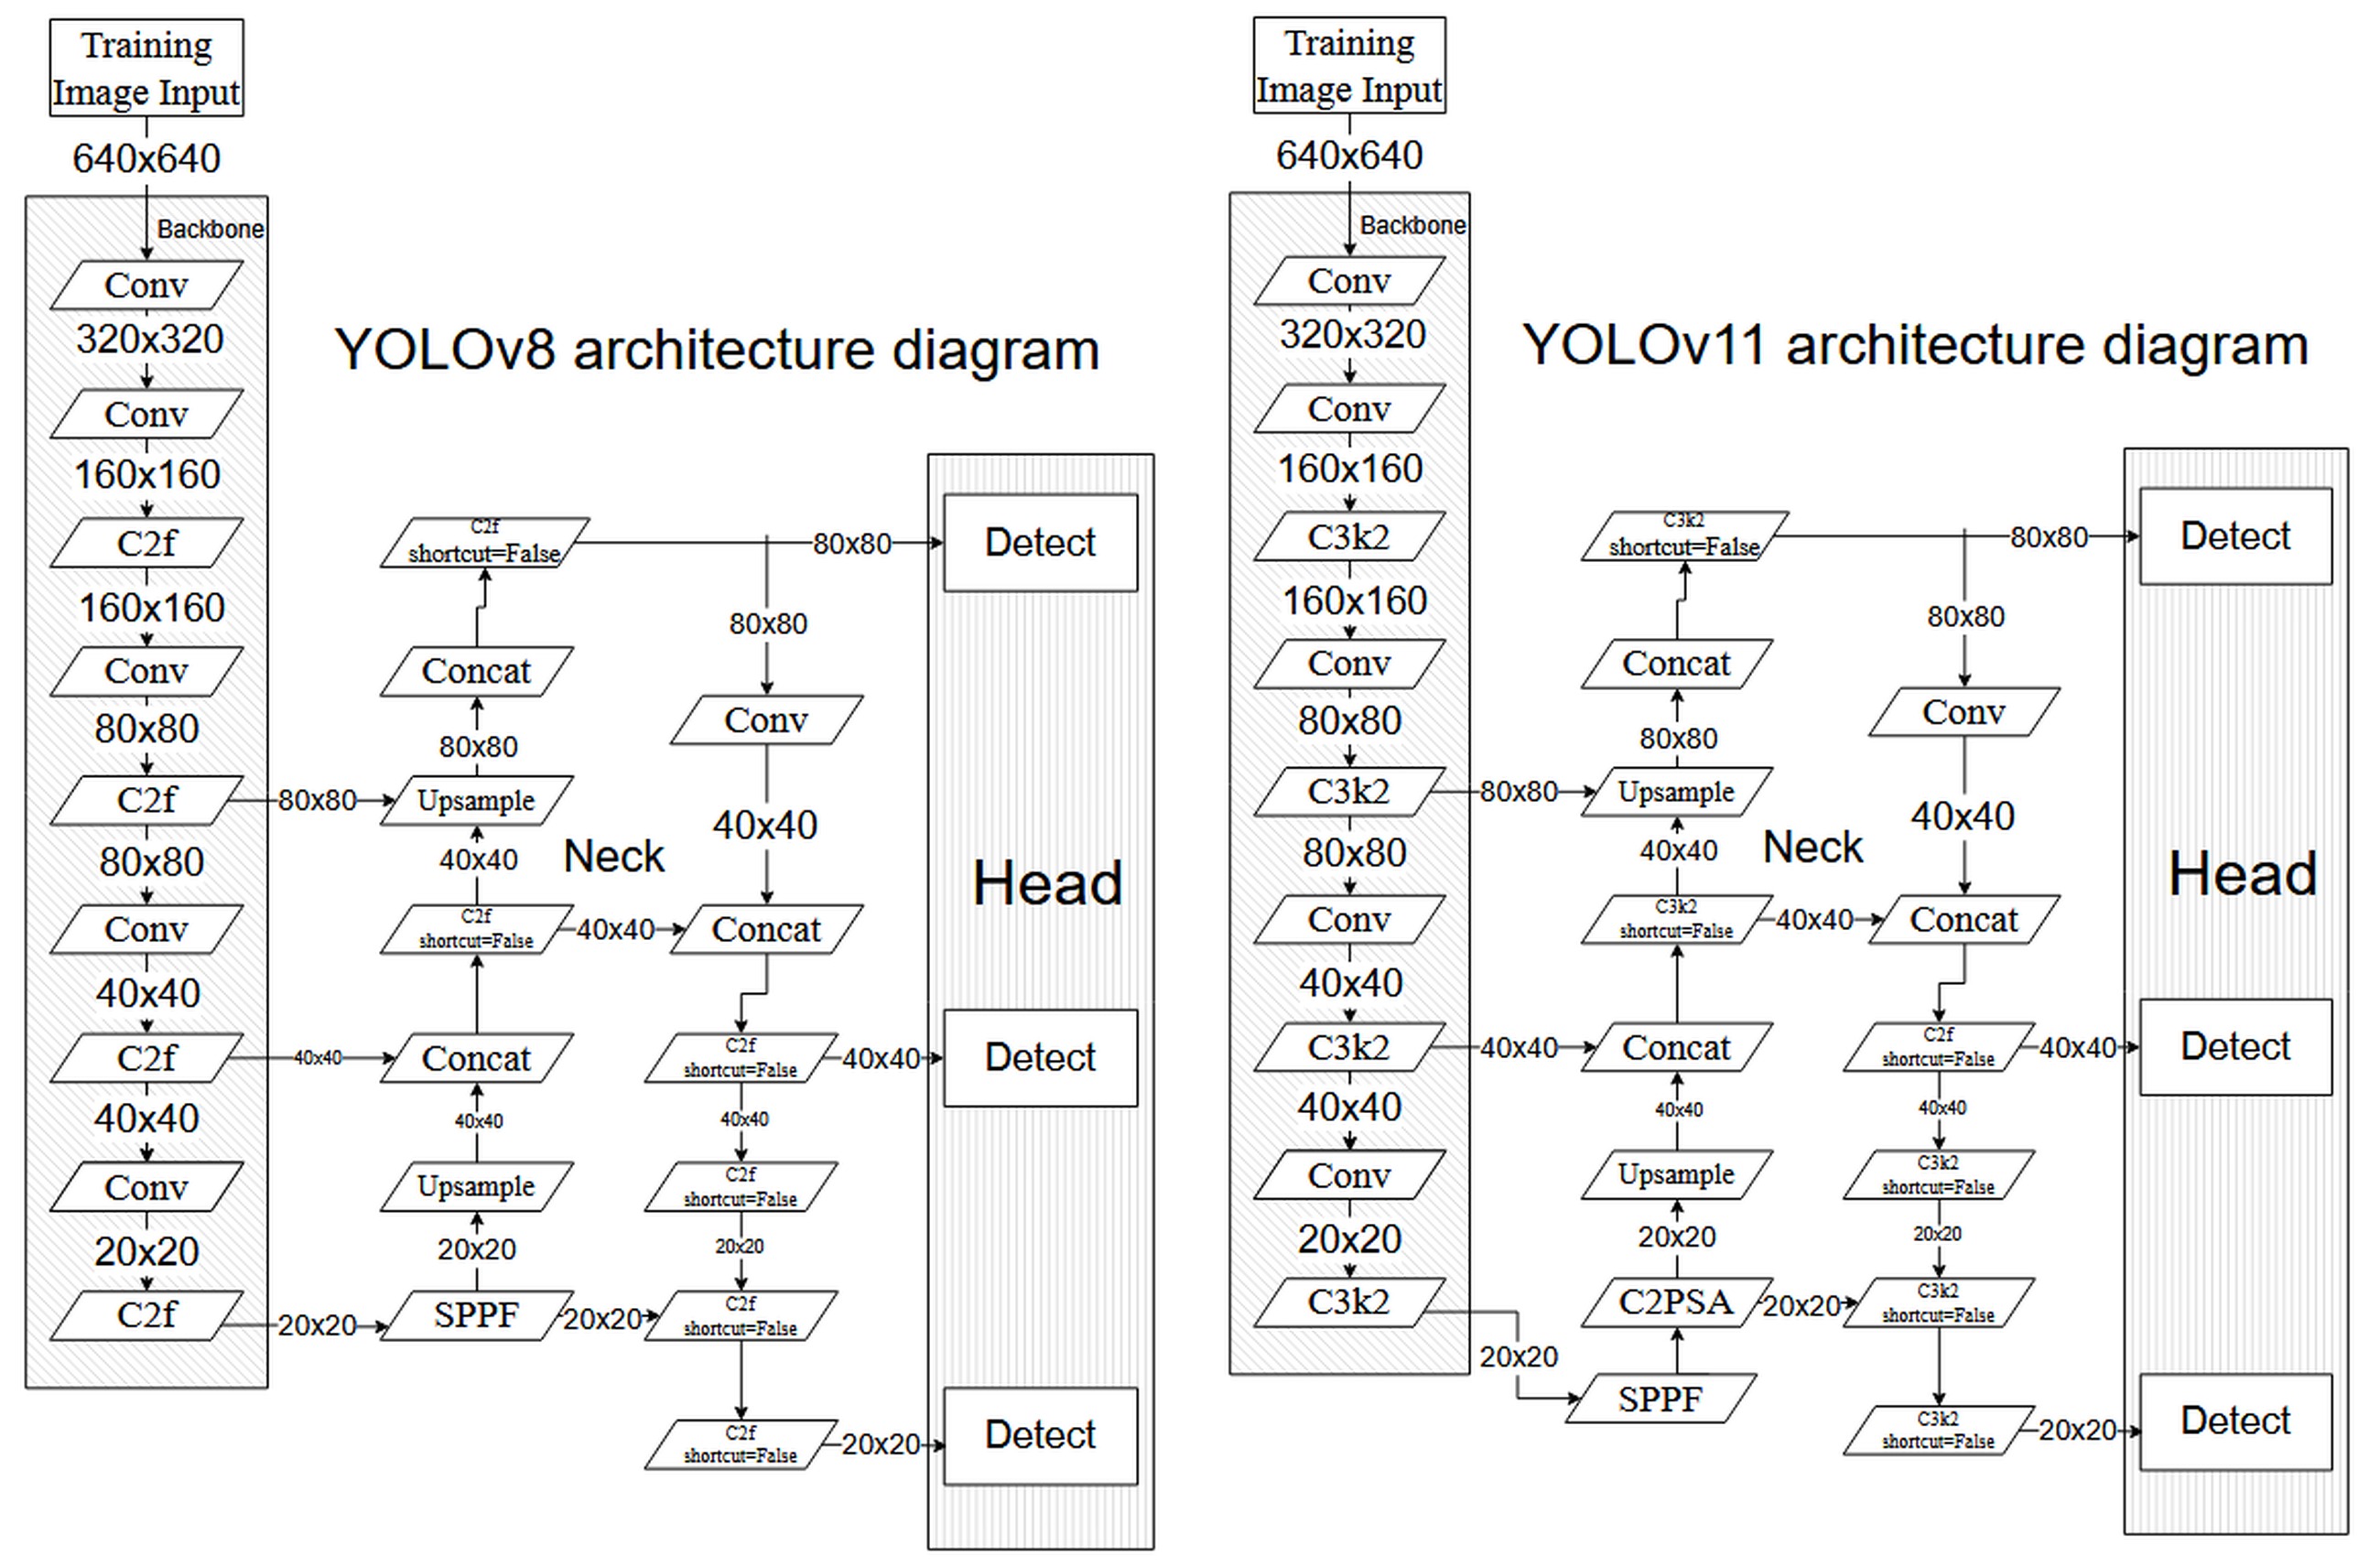
The network's learning assumptions will be established for all cases as follows, as demonstrated in Tab. 4. In the YOLOv8x architecture (see Fig. 1), the image detection process involves the input of a normalised and rescaled input image of predefined illustrative dimensions 640 x 640 pixels into the backbone module. This fundamental component of the network, predicated on C2f blocks, sequentially extracts hierarchical feature maps of varying resolutions, ranging from higher resolution maps characterised by their richness in spatial detail to lower resolution maps.
Tab. 4
YOLO model parameters used in training the network
As illustrated in Fig. 1, the architecture of YOLOv11x [12] demonstrates evolutionary advancements in comparison to YOLOv8x, while concurrently preserving substantial similarities. As in YOLOv8x, the scaling of YOLOv11x variants is implemented using depth_multiple, width_multiple, and max_channels parameters, while the initial stem component remains identical. In the cervical region, both architectures incorporate the SPPF block, in addition to merging and zooming operations. A substantial modification in YOLOv11x is the integration of an advanced C3k2 block within the backbone modules, which replaces the C2f from YOLOv8x [13]. This results in a reduced number of parameters and the potential for enhanced efficiency.
Neck of model YOLOv11x, following the SPPF block, the integration of a C2PSA self-attention module was implemented to augment the model's capacity to discern global relationships within the analysed image. The down-sampling process in YOLOv11x is implemented through convolution layers with a 3x3 kernel and a step of 2. The structure of head YOLOv11x shows some similarities with the solutions from YOLOv8x in terms of an anchor-free approach. These modifications indicate the focus of YOLOv11x and development on increasing efficiency and improving contextual modelling while using proven solutions from previous generations. The YOLO versions were selected based on their comparable features. The YOLOv11x model represents an endeavour to enhance the architecture of its previous version. The diagrams are intended to provide a visual representation of the process by which the YOLO algorithm learns to recognise objects. The algorithm uses samples based on data collected from the actual object, and then compresses and analyses it.
Dataset and preprocessing
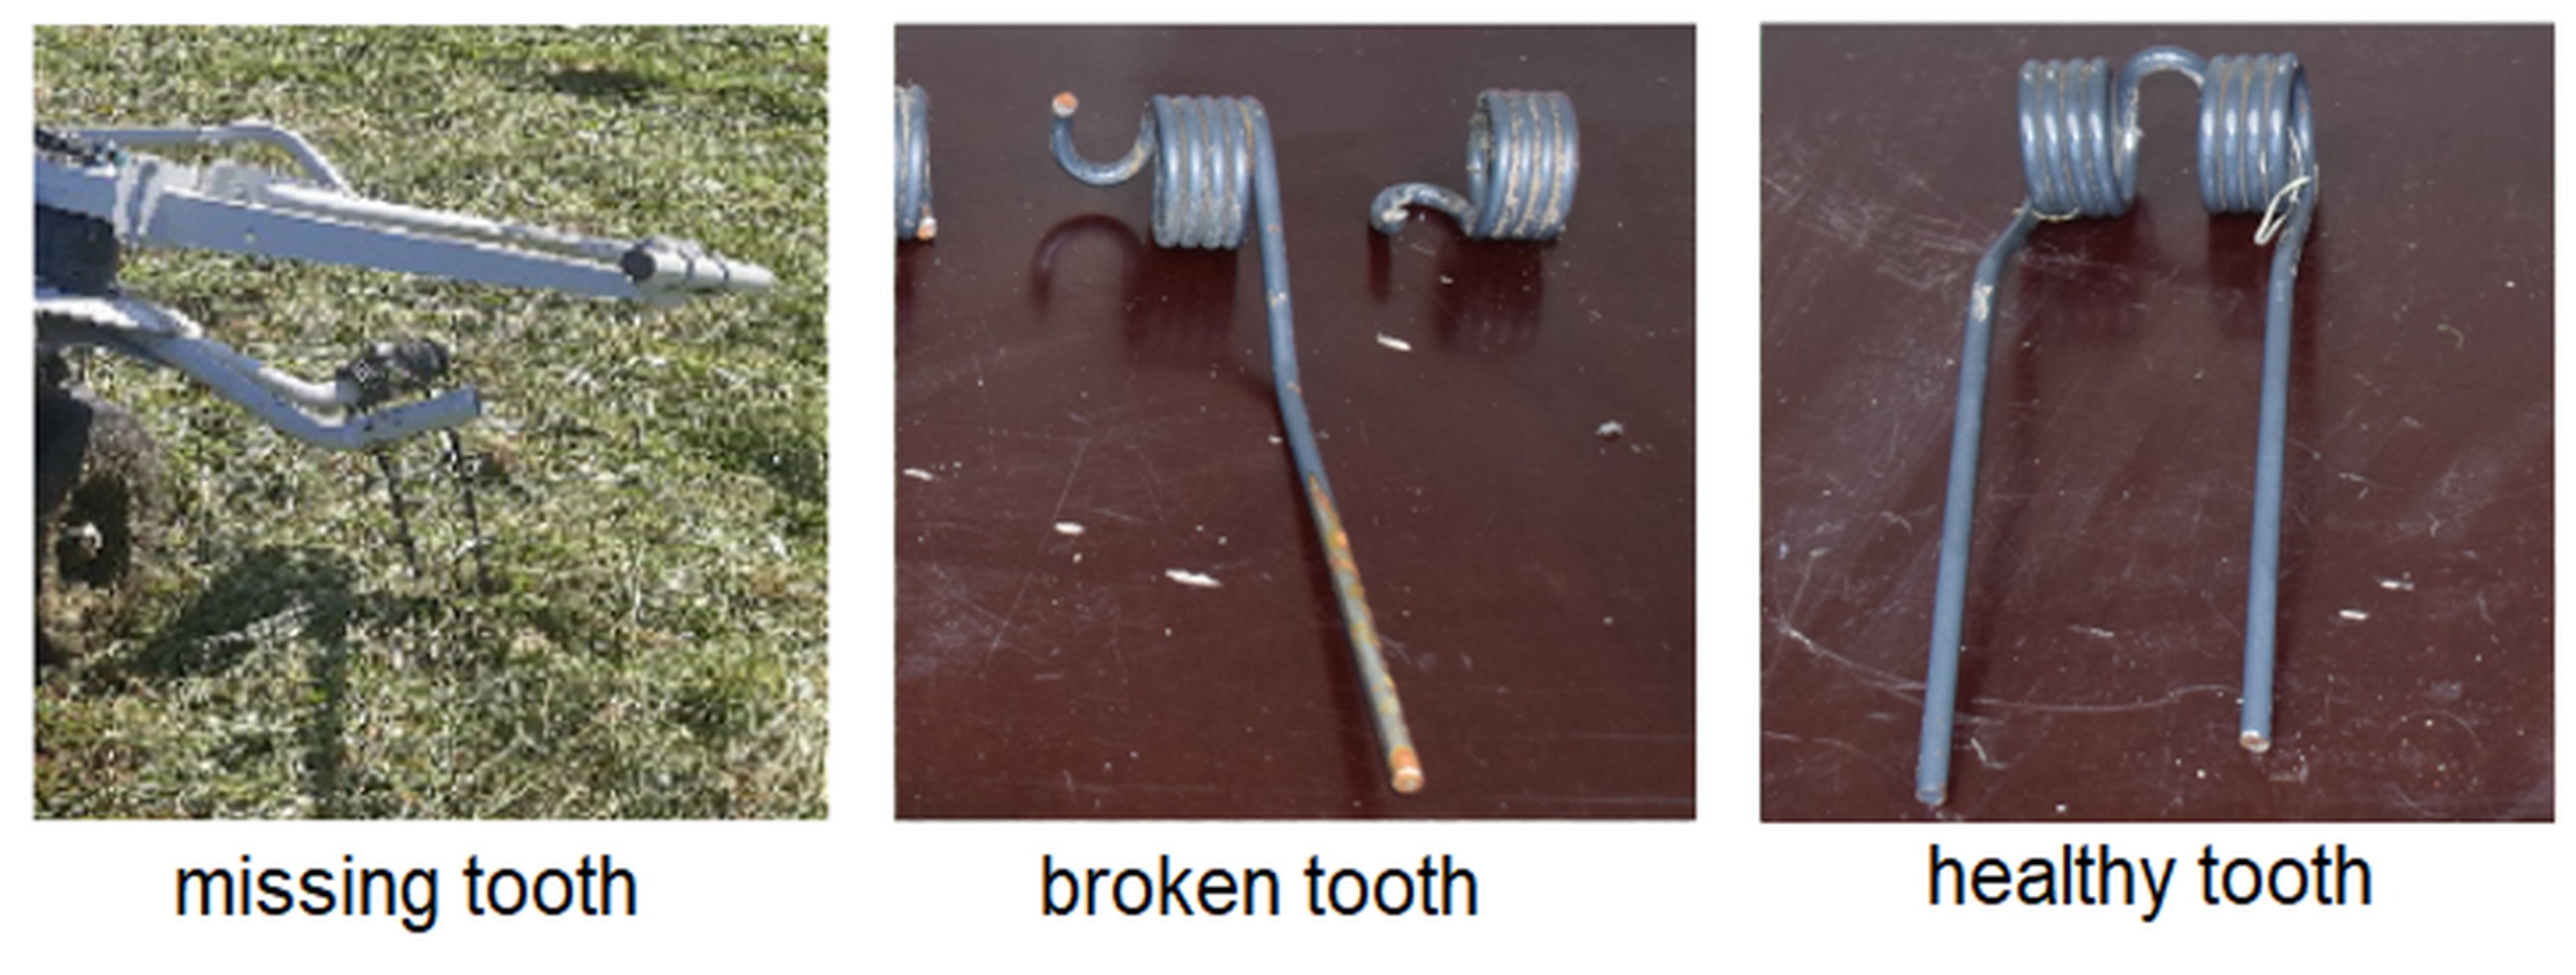
The implementation of the algorithms in this study involved the creation of a dedicated database for model learning. The source data was obtained from video footage recorded in the operating environment of an agricultural machine, considering the damage sustained by a broken tooth and a missing tooth, see Fig. 2. The video footage was decomposed into individual frames, which were then subjected to analysis. A selected portion of these frames was then used in a further process. The implementation of this procedure resulted in the acquisition of a total of 2,519 frames. From this pool, the frames that met the specified criteria were selected for further processing. The selection process focused on three key elements of the machine: healthy tooth, missing tooth, and broken tooth. It is evident that the visual patterns exhibited by the majority of the frames are repetitive, and the machine's operation is characterized by a cyclical pattern. Consequently, the data set under consideration consists of a representative sample of 34 images, with a resolution of 1980x1080. The acquired image database was then subjected to further processing to increase the number of samples required for the training process. The database was divided into three data sets. The initial training set for the algorithm was rotated by 45 degrees using Roboflow tools [15]. The rotation operation was performed on 233 samples.
The subsequent stage of the process involved the annotation of the elements to be incorporated into each image. For this purpose, the tool offered by the Roboflow platform was utilised. The labelling process was executed manually, based on assumptions concerning the identified elements. The following labels were entered: healthy tooth, broken tooth, and missing tooth. Following the conclusion of the annotation process, the final step in the augmentation of the training dataset was to rotate each image by 45 degrees. The resultant dataset comprised images for training, testing, and validation. Consequently, four distinct variants were formulated through the implementation of image modification.
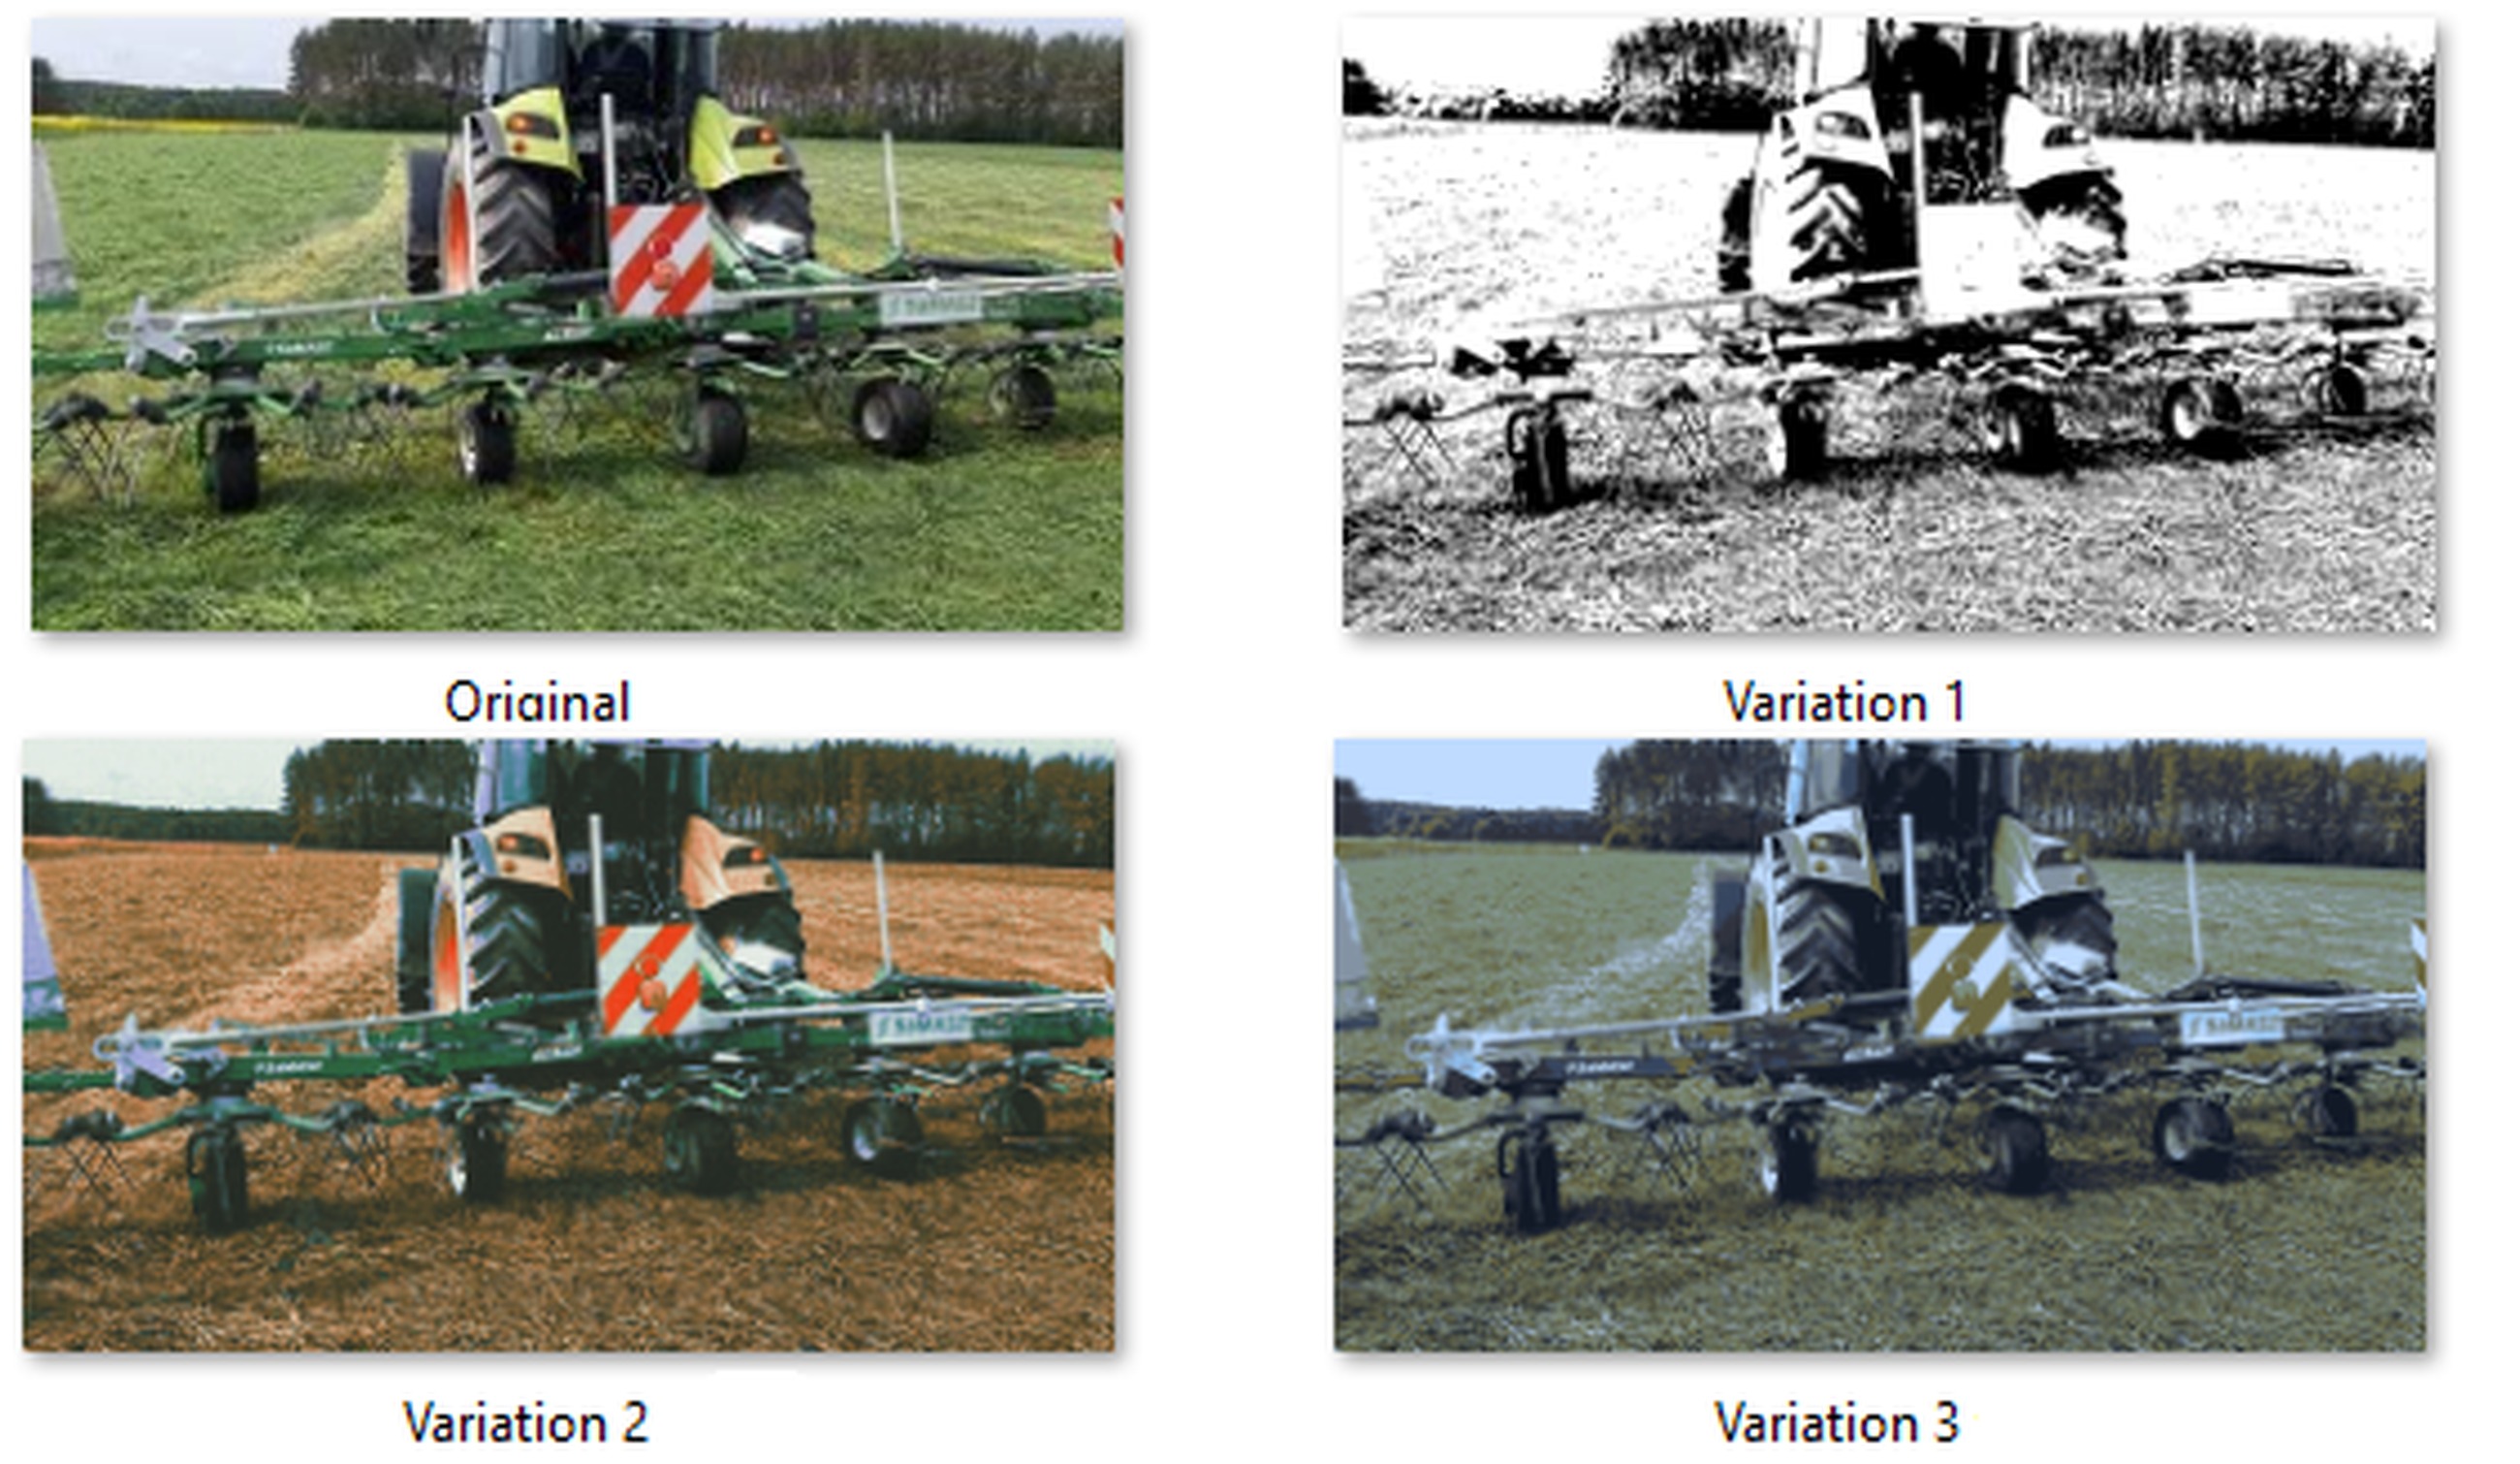
Due to the limited number of samples extracted from the videos, additional operations were performed on the selected images to increase the number of samples and introduce more variance into the learning process. Using Dithermark image processing software, which allows manipulation of threshold, saturation, image base colour change, and additional parameters such as the texture of the displayed image. The total number of samples was increased. The image variants are given in Fig. 3.
Expanding the initial dataset mitigated the constraints of a limited sample size, specifically enriching the repository of rotary tedder tooth defects. This enhancement facilitated the development of the third database iteration Tab. 5, which prioritizes the representation of fractured components to improve the model.
Description of the database acquired in the preparation process:
Dataset V1: Custom database having tags for healthy tooth, broken tooth, missing tooth, rotor, and wheel classes. Number of images: 233, 3 images for test, 7 images for validation;
Dataset V2: Custom database having markings for healthy tooth, broken tooth, and missing tooth classes. Number of images: 921, 26 images for test, 13 images for validation.
Dataset V3: Custom Database having tags for healthy tooth, broken tooth and missing tooth. Number of images: 3377, 50 for test and 99 for validation.
The assumptions of the training process of the YOLOv11x and YOLOv8x networks included the use of images with a resolution of 640x640 pixels, based on the prepared dataset using the tools of the Roboflow tools the preprocessing is shown in Fig. 4.

Results And Discussion
The subject of this chapter is the analysis of the results of learning two separate instances of the YOLO algorithm, aimed at recognizing three defined states of the working teeth of the rotary tedder:
healthy tooth;
broken tooth;
missing tooth.
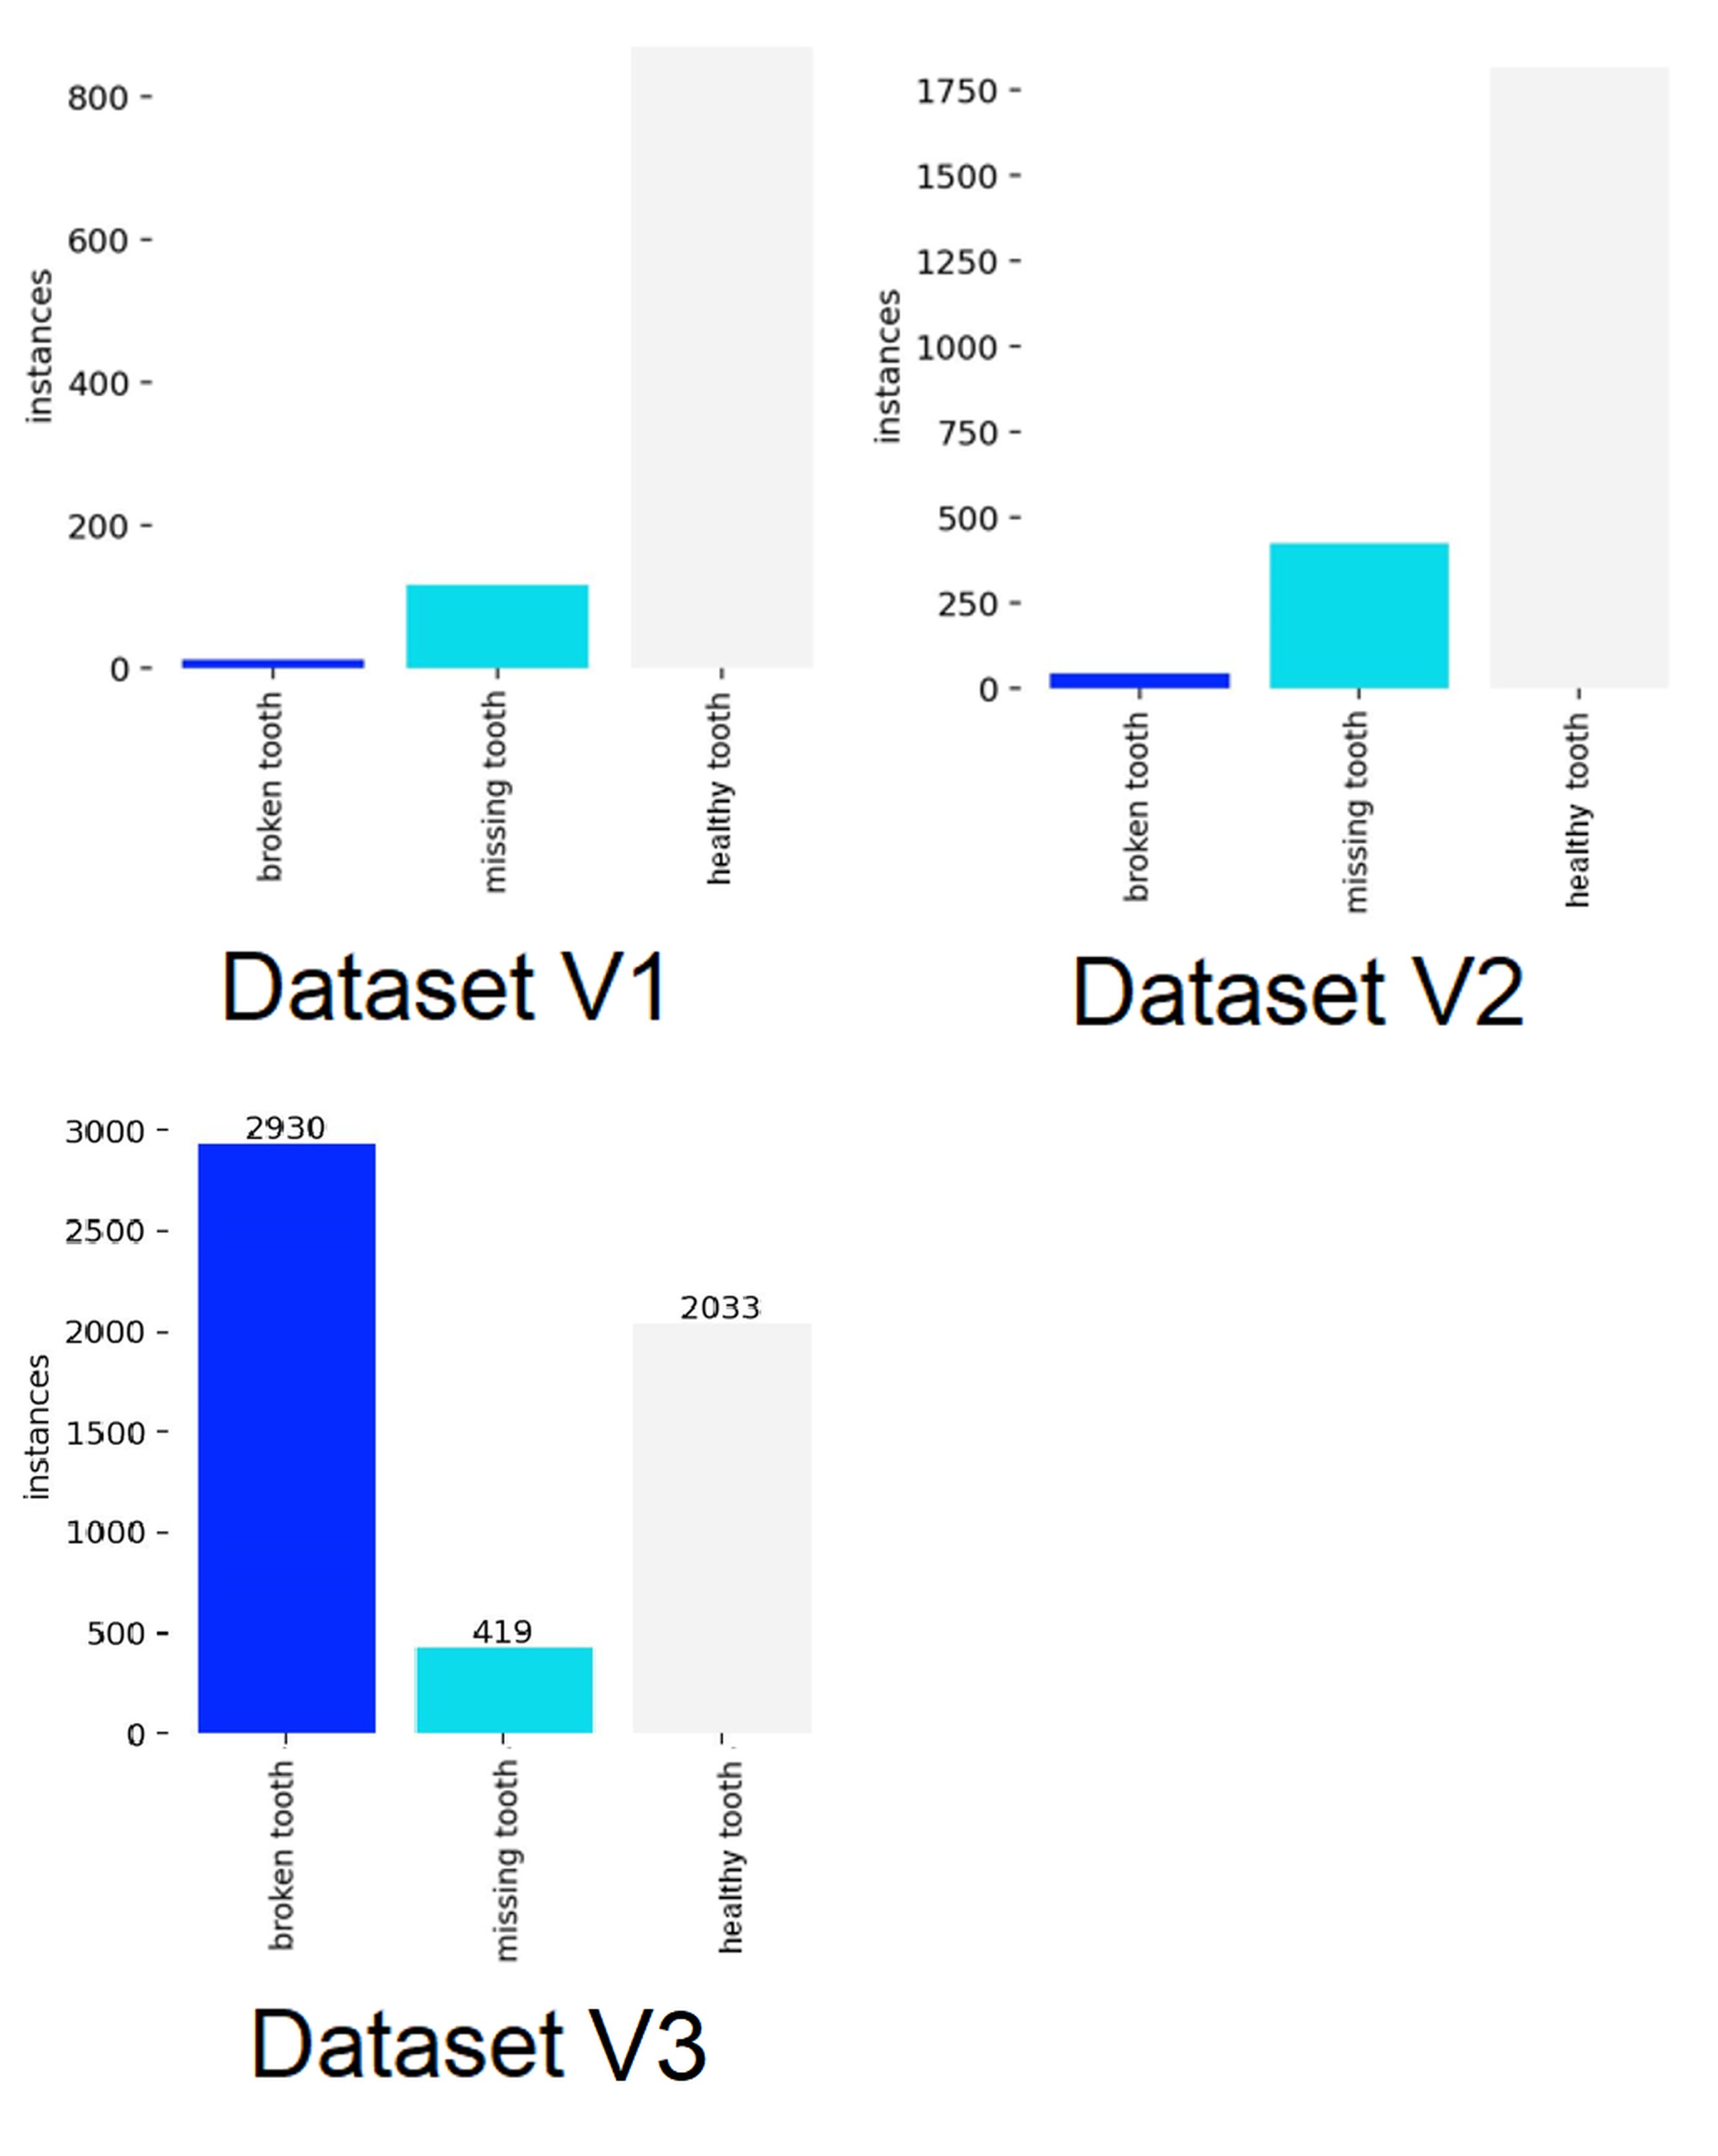
Proceeding to a detailed analysis of the learning results, it is necessary to characterize the differences between the datasets used. A quantitative summary of each class of objects for Dataset V1, Dataset V2 and Dataset V3 is shown in Fig. 5. Due to the use of methods involving the use of filters, the set of iterations for the learning process has significantly increased. The time in which both models completed their training shown in Tab. 6 suggests that the increased number of iterations extended the process to finish.
Training the YOLO model for V1, V2 and V3 databases
Before proceeding to a detailed analysis of the learning results, it is necessary to characterise the differences between the three datasets used.
Results Dataset V1
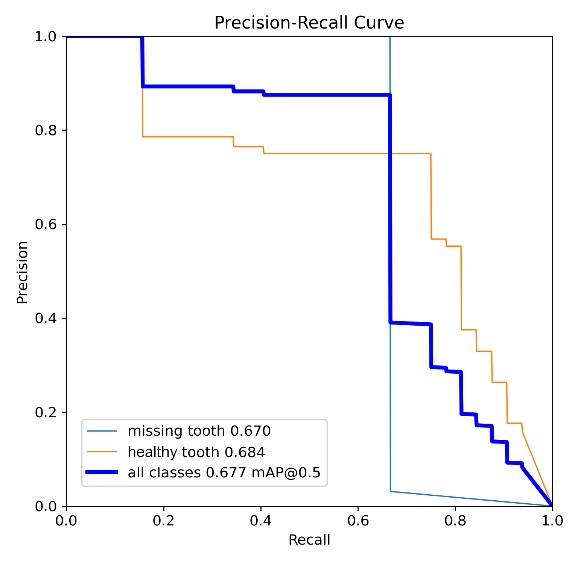
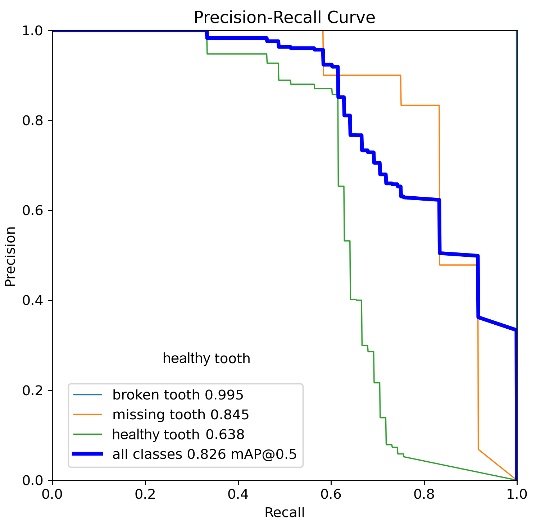
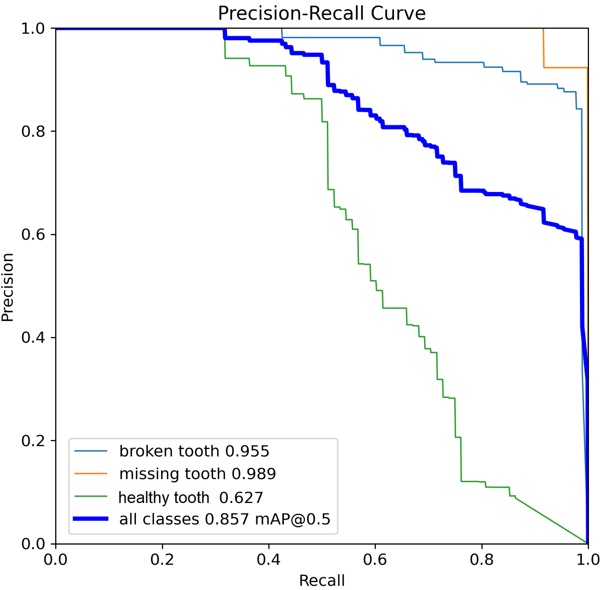
The detailed statistics generated during the YOLO algorithm's learning process, incorporating graphical visualizations and numerical summaries, facilitated an in-depth analysis and comparison of precision metrics and the overall efficiency of neural network learning. It is imperative to acknowledge that the percentage indicated herein pertains to the precision of detection of the specified object classes. An analysis of the data from the learning process of the YOLO algorithm reveals the value of the mAP0.5 metric. This metric measures the model's ability to correctly detect and locate objects according to the annotations in the image dataset. Values above 50% are generally considered to indicate high model performance. This assertion is supported by an analysis of the precision-recall curves given in Tab. 7.
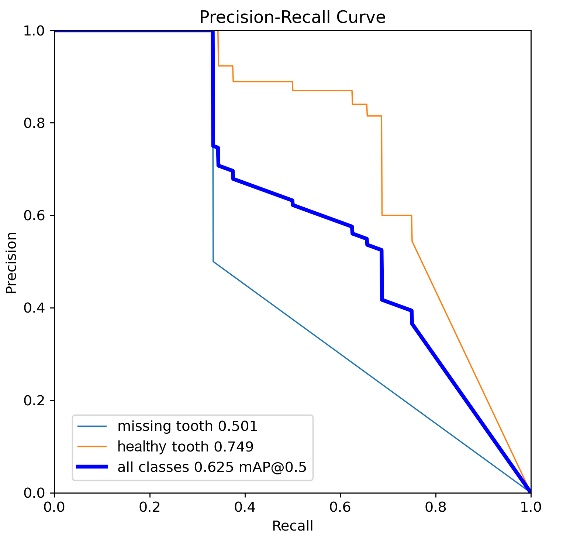
The YOLOv8x model, trained on the Dataset V1, achieved an overall mAP0.5 value of 0.625, which translates to approximately 62% object detection efficiency (see Tab. 8). A detailed analysis of the individual classes was conducted, yielding the following values: for the missing tooth class, the value was 0.501, and for the healthy tooth class, 0.729.
Tab. 8
Results of parameter mAP0.5 Dataset V1
Model | Overall | Healthy tooth | Missing tooth |
YOLOv8x | 62% | 74% | 50% |
YOLOv11x | 67% | 68% | 67% |
difference | 5% | 9% | 17% |
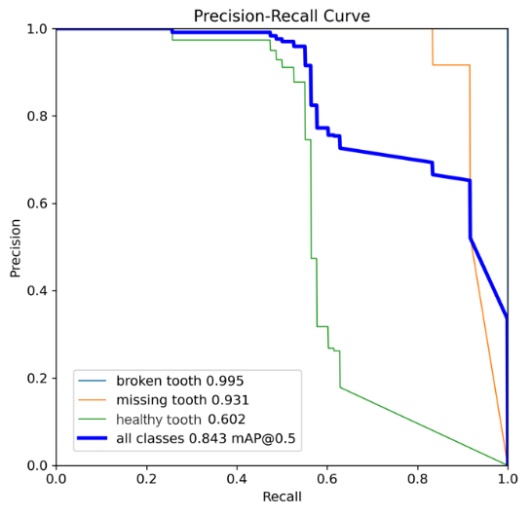
The case for model YOLOv11x using the first set of images showed an overall mAP0.5 value of 0.625, which gives a 62% efficiency in object detection. The mAP0.5 coefficient for the classes was a missing tooth at 0.670 and a healthy tooth at 0.684. Analysis of the results using the first set of images showed that both models had an overall precision coefficient of 62% and 67% respectively. Even so, differences emerged for individual class results. The YOLOv11x model showed 17% better performance in detecting a missing tooth defect. However, for the healthy tooth class, it was inferior to YOLOv8x by 9%. The results are shown in Tab. 9. However, the samples in their combination had no reference for the last broken tooth class. Due to the very small number of markers, the model could only be trained but had no material to compare the effect of training.
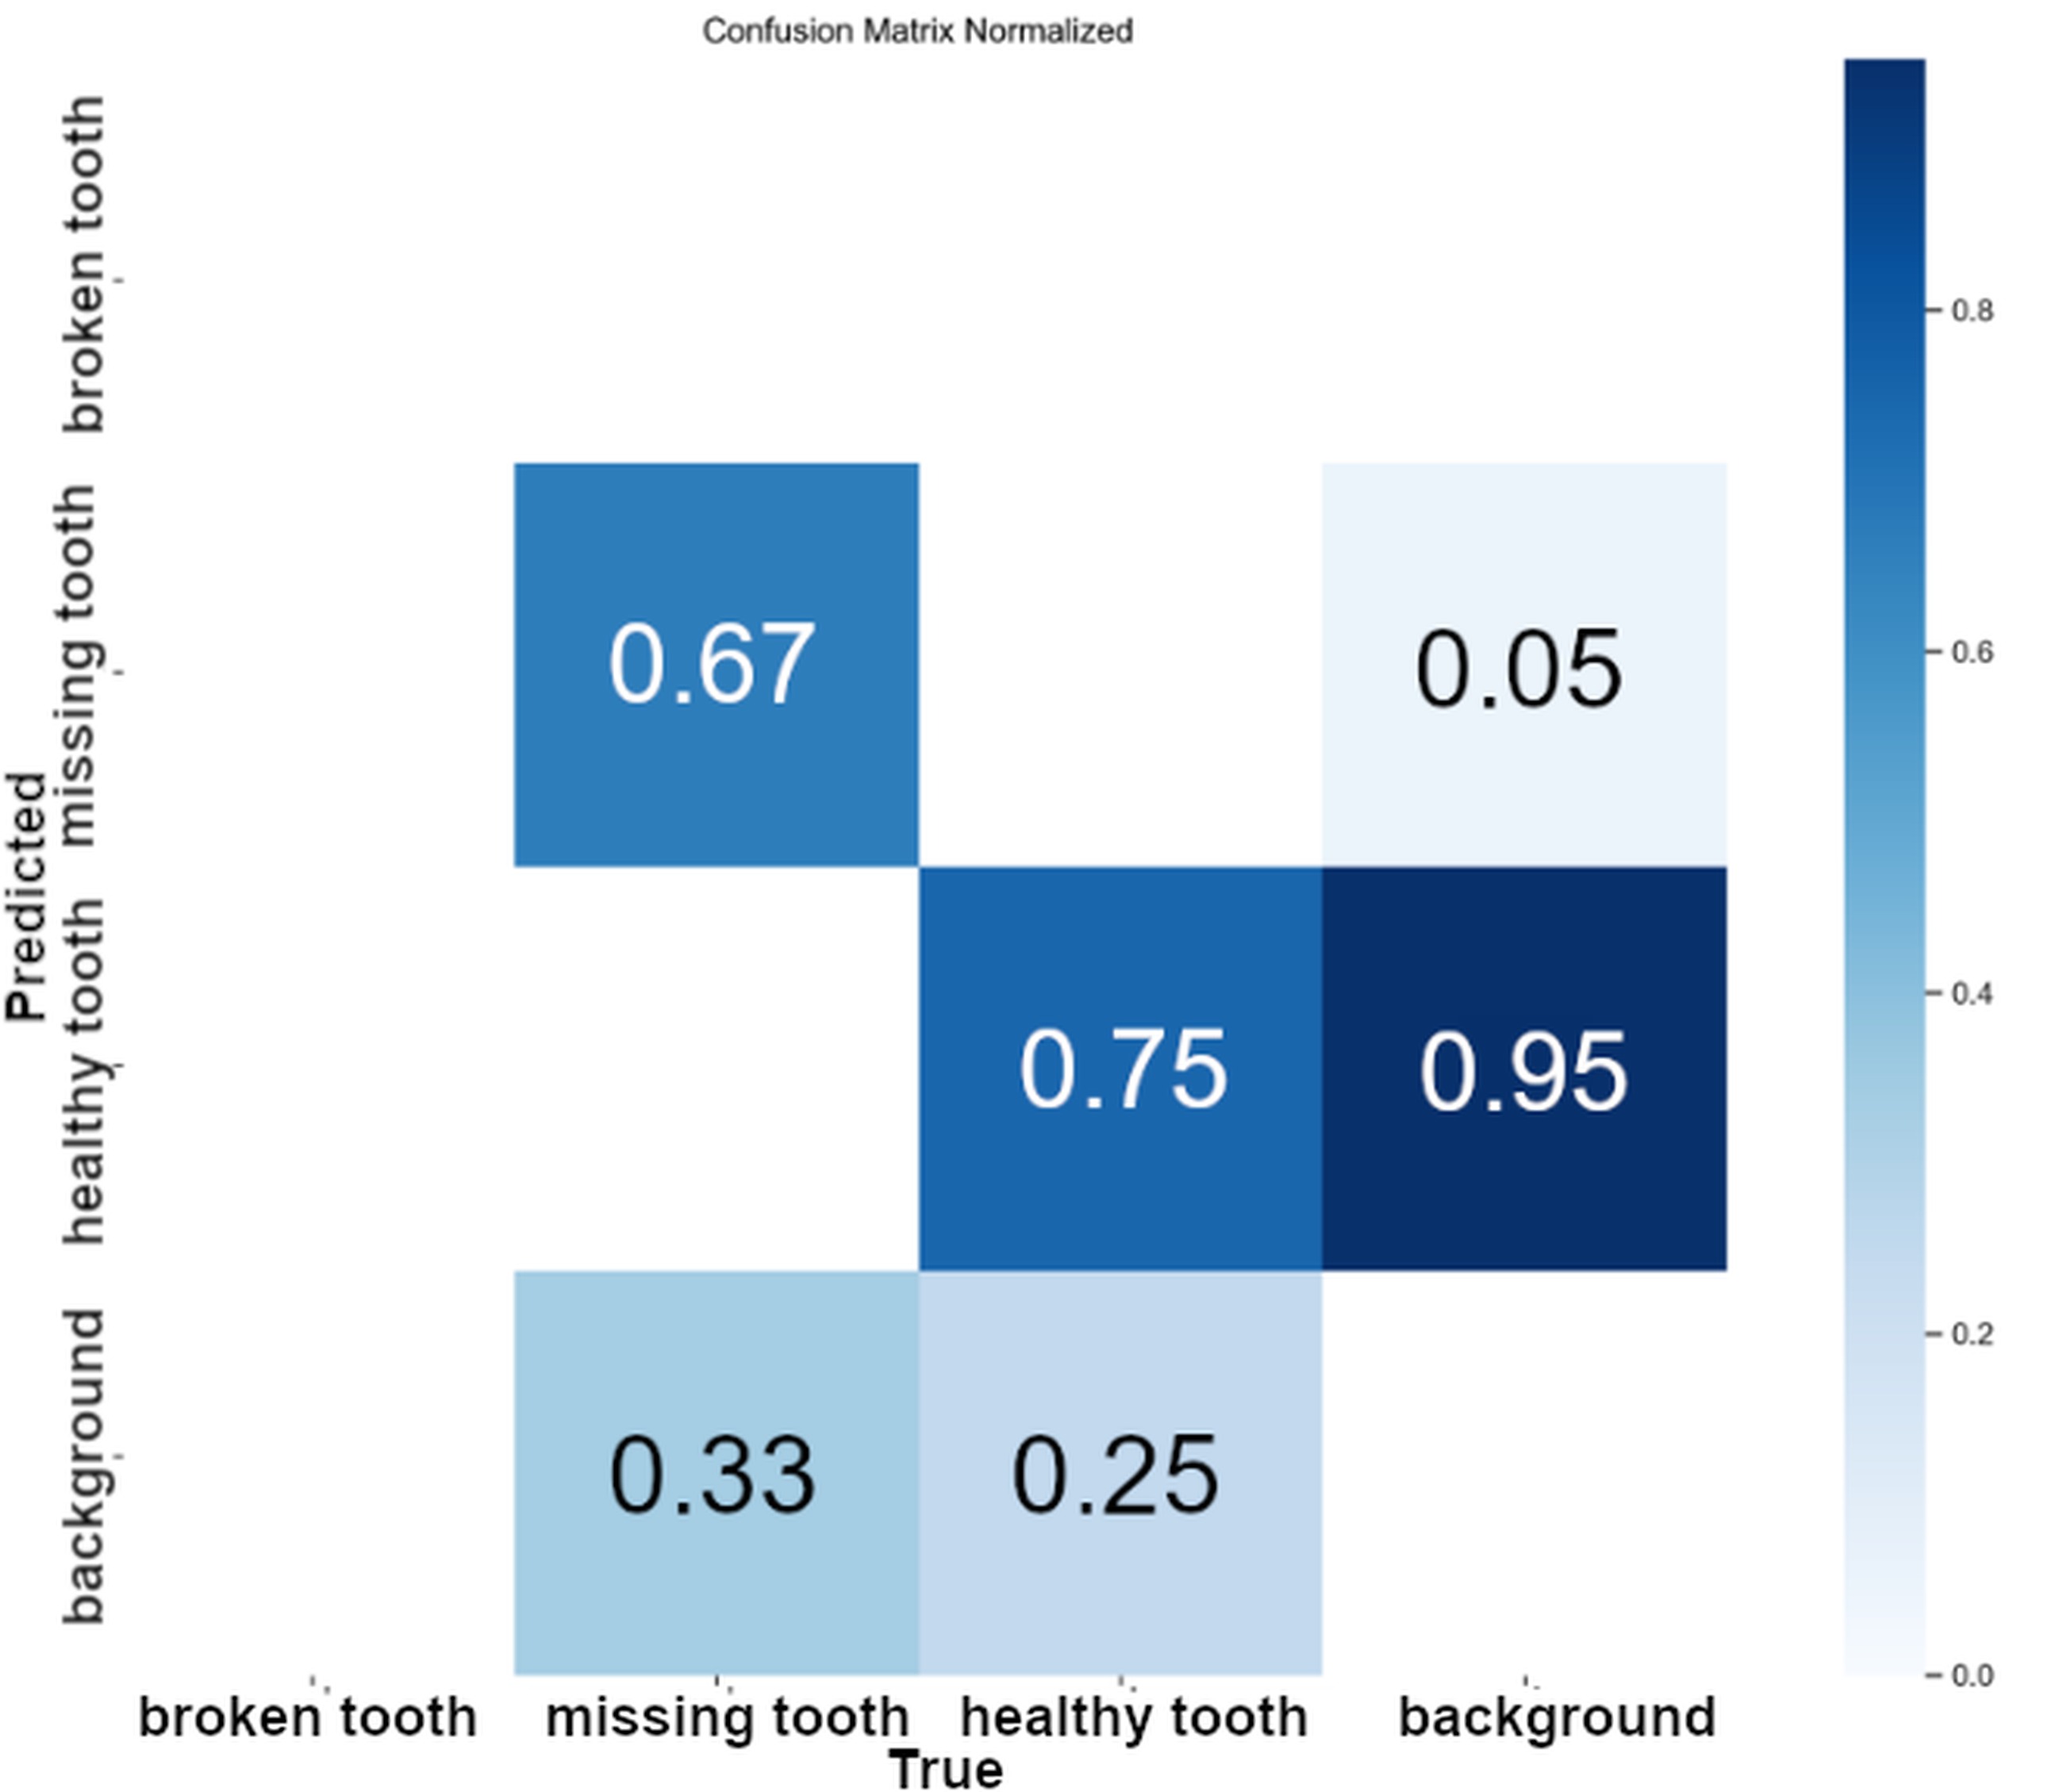
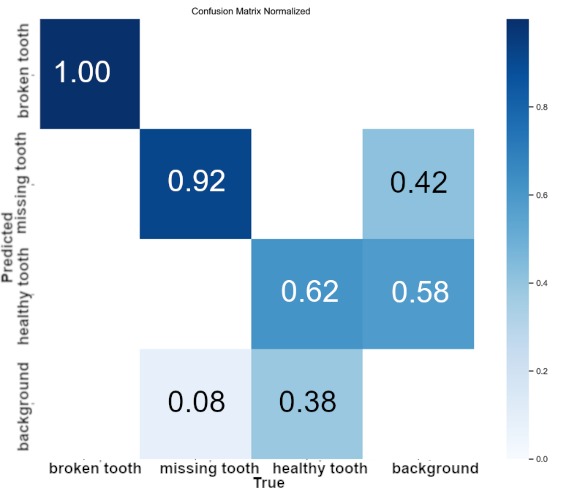
The subsequent dataset to be analysed is the confusion matrix, which has been normalized for both sets. As illustrated in Fig. 6, Dataset V1 demonstrates the challenges experienced by the YOLOv11x model during the learning process. The algorithm demonstrated a certain degree of difficulty in accurately identifying the broken tooth and background classes. In contrast, the remaining classes exhibited an accuracy rate above 65%, with the healthy tooth class achieving 75% accuracy and the missing tooth class attaining 67%. The broken tooth class was not included in the matrix due to an absence of material associated with this class of damage.
It can also be deduced that a common problem for the healthy tooth class is its confusion with background elements. The hypothesis that such a relationship exists is postulated based on the operating environment of the agricultural machine. The machine was operational and engaged in the process of harvesting grass, a process which has the potential to cause interference.
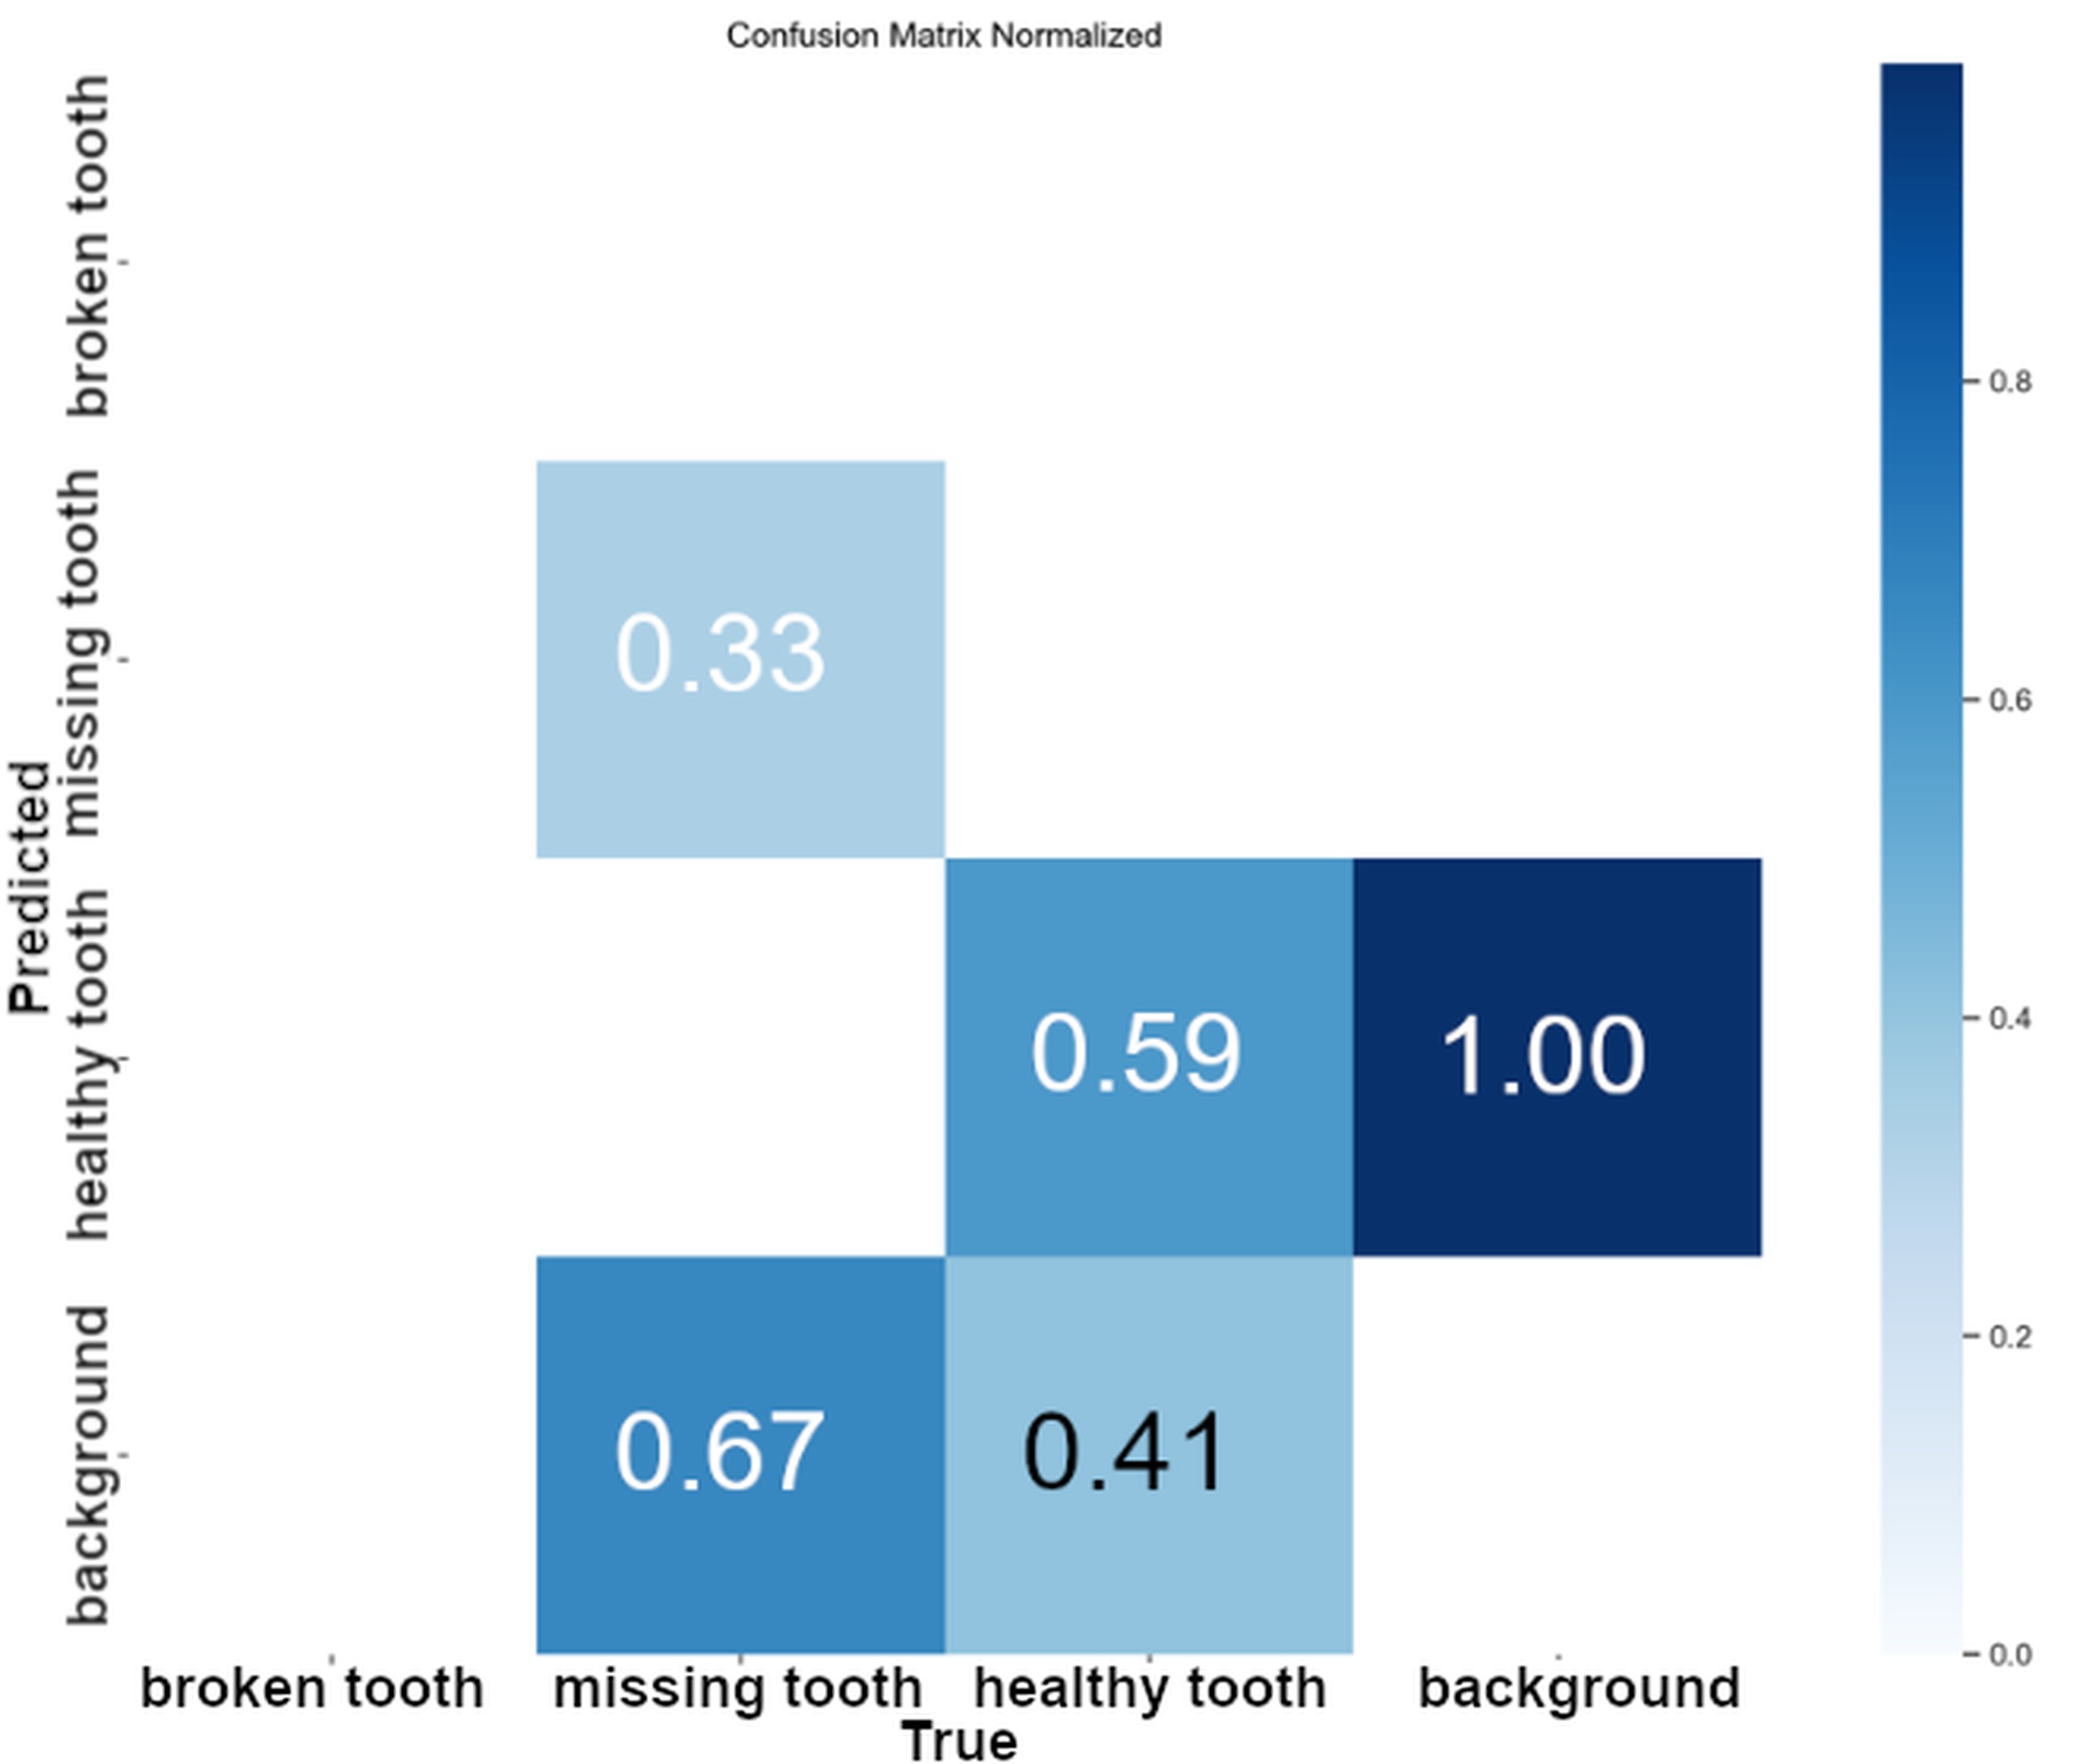
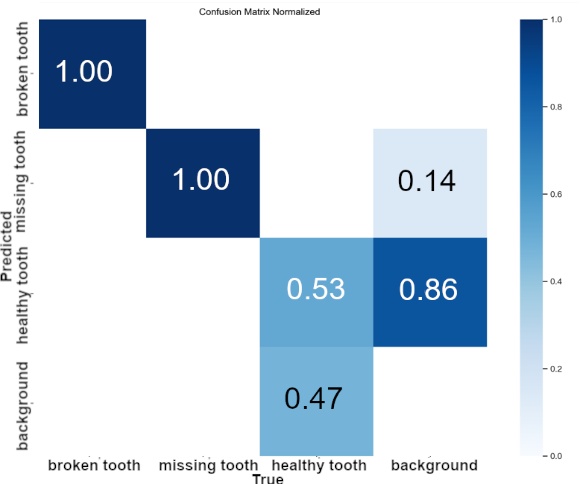
The results of the matrix obtained from the training process of the YOLOv8x model indicate that the model scored worse in terms of accuracy compared to YOLOv11x. A thorough examination of the matrix presented in Fig. 7 reveals the detection rate for the healthy tooth (59%) and missing tooth (33%) classes. The findings from the comparison of the two models' performance for the Dataset V1 database are presented in Tab. 9. Analysis of the results revealed higher object detection performance for the V1 dataset for the YOLOv11x model. In particular, this model achieved significantly better results in the recognition of tooth classes, improving by 16% and missing teeth by 34% compared to YOLOv8x.
Tab. 9
YOLOv8x and v11 model results for each class Dataset V1
Model | Healthy tooth | Missing tooth |
YOLOv8x | 59% | 33% |
YOLOv11x | 75% | 67% |
difference | 16% | 34% |
Both analysed models showed a tendency to classify background elements as objects, with the problem being more severe for the healthy tooth class. Nevertheless, an analysis of the confusion matrix showed that the v11 model had a 5% lower false-positive background detection rate for the healthy tooth class compared to the v8 model. Significantly better results were observed in the detection of missing tooth class defects, where the YOLOv11x model showed a 37% lower rate of misclassification of background elements as defects.
Results dataset V2
An analysis of the YOLO neural network learning results followed, focusing on the data obtained from the training process using the Dataset V2. The interpretation began with the evaluation of the average precision metric mAP0.5. Based on the precision-recall precision-sensitivity curves given in Tab. 10, a comparison of the results achieved for the dataset was made.
Analysis of the average precision value at the mAP0.5 threshold showed that the YOLOv8x model achieved an overall improvement in this indicator by 3% for all object classes, see Tab. 11. Detailed analysis of individual classes revealed varying trends. The detection of the healthy tooth class was characterized by higher precision in the YOLOv11x model, with a difference of 3%. In contrast, missing tooth class damage was more effectively detected by the YOLOv8x model, which showed an improvement of 9% compared to the YOLOv11x model.
Tab. 11
YOLOv8x and v11x model results with broken tooth excluded
Model | Overall | Healthy tooth | Missing tooth |
YOLOv8x | 77% | 60% | 93% |
YOLOv11x | 74% | 63% | 84% |
difference | 3% | 3% | 9% |
The precision value for the broken tooth class reached a high level (99%) in both analysed models, see Tab. 12. Nevertheless, there is a suspected overestimation of this result, which may be due to the insufficient sample size of this class in the training dataset, which could potentially lead to an overfitting effect and inflated precision. In addition, an overlap of samples of the missing tooth class was observed between the training, validation, and test datasets. Given the above considerations, the decision was made to exclude the missing tooth class from the calculation of overall network performance metrics.
YOLOv8x and YOLOv11x model results for each class dataset V2
Tab. 12
YOLOv8x and YOLOv11x model results for each class dataset V2
Model | Overall | Healthy tooth | Missing tooth | Broken tooth |
YOLOv8x | 84% | 63% | 93% | 99% |
YOLOv11x | 82% | 60% | 84% | 99% |
difference | 4% | 3% | 9% | 0% |
Analysis of the confusion matrix given in Fig. 8 for the YOLOv11x model and for the YOLOv8x model given in Fig. 9 identified specific problems that occurred during the learning process. Regarding the healthy tooth and missing tooth classes, the model based on the YOLOv11x architecture showed better overall detection statistics at 62%, an improvement of 9% over the YOLOv8x model. In addition, the YOLOv11x model more effectively distinguished between background and healthy tooth class objects, achieving a difference in classification accuracy of 33%. The YOLOv8x model, on the other hand, was more effective in detecting the missing tooth class, achieving an improvement of 8%.
Detailed analysis of the confusion matrix for both YOLOv11x and YOLOv8x models provided valuable information on specific types of classification errors, see Tab. 13.
Tab. 13
Dataset V2 Confusion Matrix Results
Model | Healthy tooth | Missing tooth |
YOLOv8x | 53% | 100% |
YOLOv11x | 62% | 92% |
difference | 9% | 8% |
These observations made it possible to identify the object classes that posed the greatest difficulties in the detection process. For example, the tendency to confuse background features with the healthy tooth class, particularly evident in the YOLOv8x model results (86%), suggests a potential need to further enrich the dataset with examples of backgrounds or to apply techniques that increase the value of features specific to this class. In contrast, the YOLOv11x model's better distinction between background (58%) and healthy tooth class, is highlighted in its confusion matrix. Analysis of the confusion matrix indicated that for the missing tooth class, the YOLOv8x model did better at distinguishing the background relative to YOLOv11x by 28%. This indicates that the two models do not clearly show which one is better when using Dataset V2.
Results Dataset V3
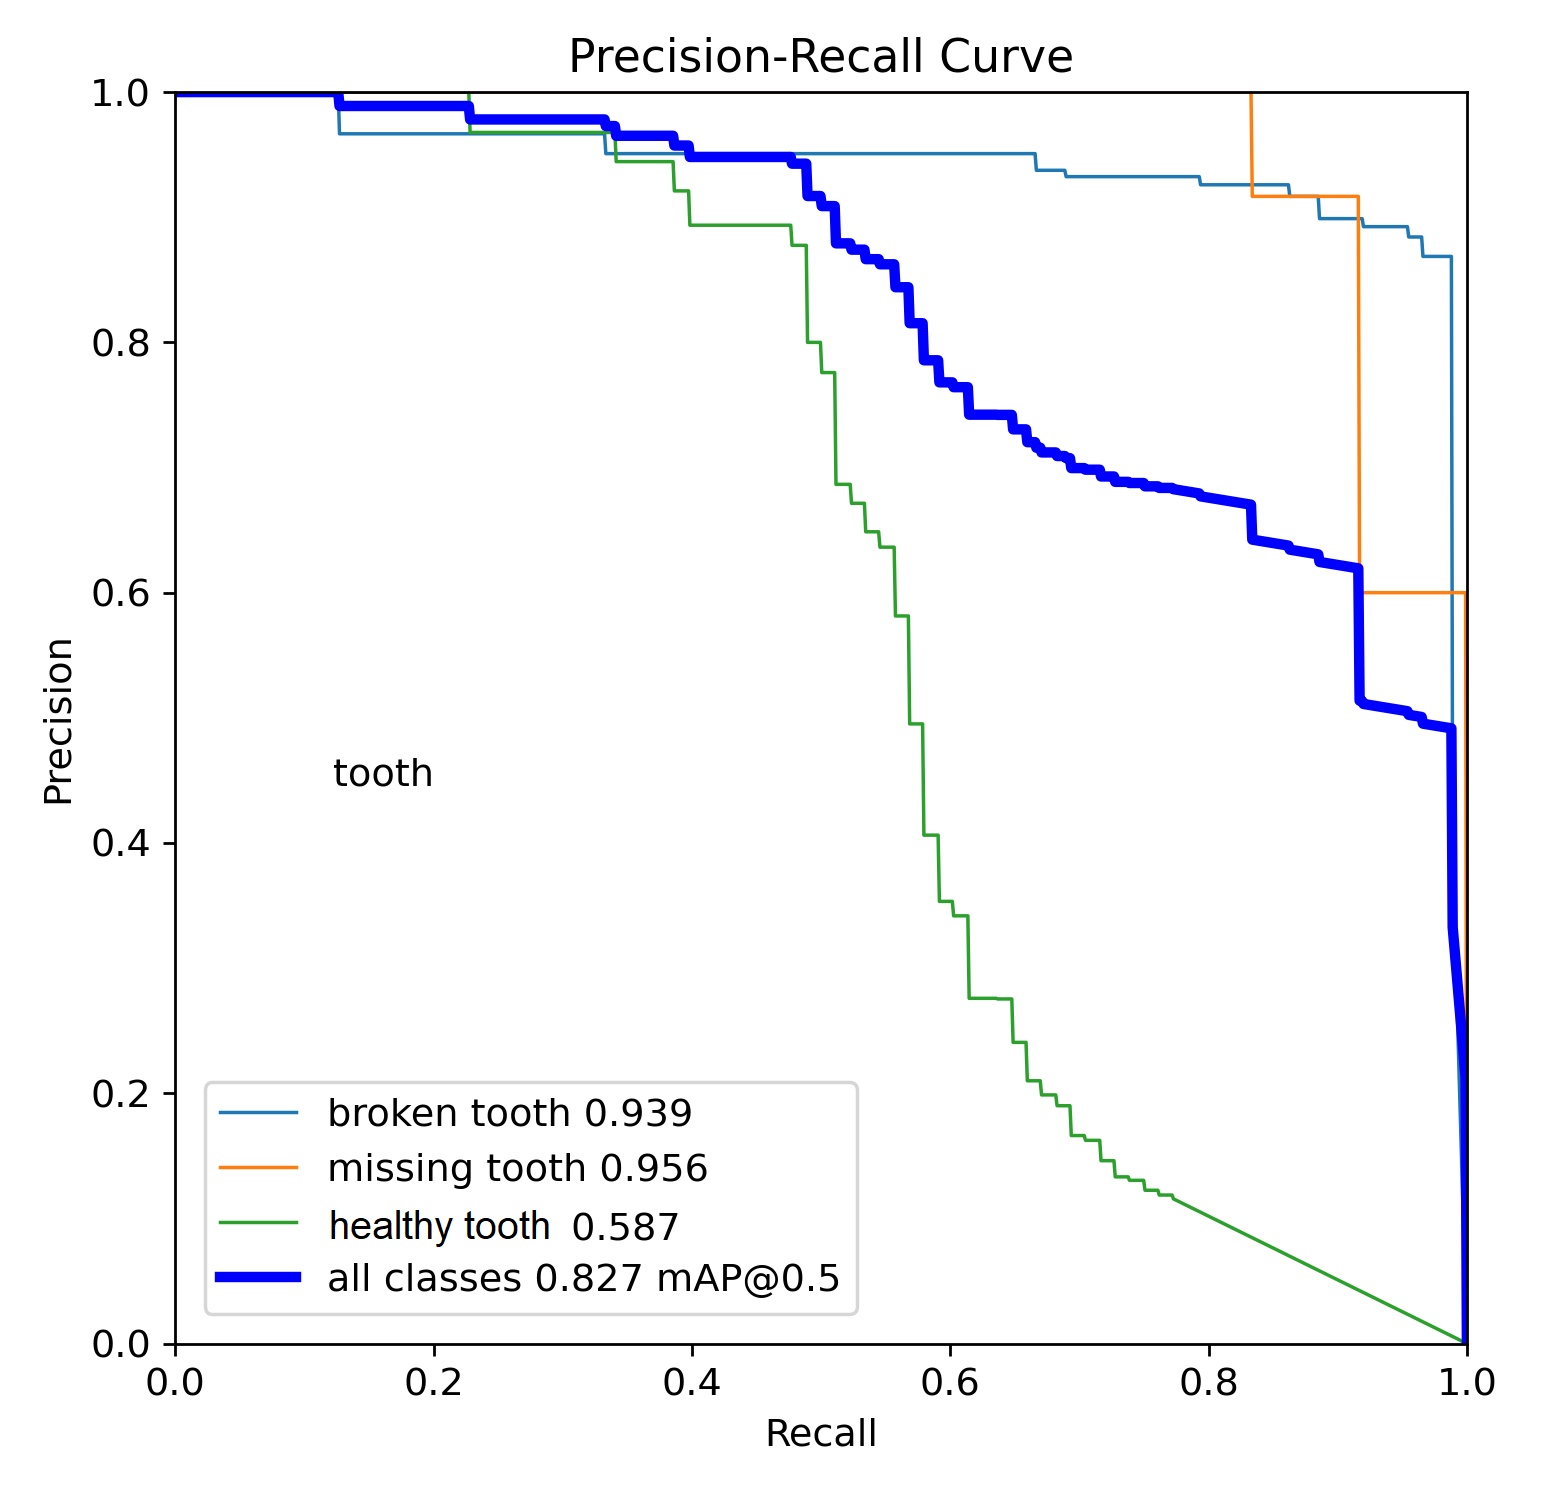
A performance analysis of the YOLO architecture was conducted, centered on the data derived from the training phase utilising Dataset V3. The evaluative framework prioritised the Average Precision at a 0.50 Intersection over Union threshold mAP0.5 as the primary metric. Furthermore, a comparative assessment was performed between the two models by synthesizing the precision recall characteristics. These curves, consolidated in Tab. 14, serve as the basis for interpreting the trade-offs between model precision and sensitivity across the investigated variants.
A comparative evaluation of the mAP0.5 metric indicates that the YOLOv8x model yielded an overall performance enhancement of 82% and YOLOv11x yielded 85% across all object classes relative to the baseline Tab. 15. However, a class specific analysis revealed divergent performance trends between the investigated architectures. While the YOLOv11x model demonstrated better precision in the detection of missing teeth (98%), and broken teeth (95%) YOLOv11x variant exhibited higher efficacy in identifying broken teeth and missing teeth defects, surpassing YOLOv8x by 2% and 3% respectively. These results suggest that while YOLOv11x may offer refined feature extraction for detecting teeth and damages.
Tab. 15
Results of training models for Database V3
Model | Overall | Healthy tooth | Missing tooth | Broken tooth |
YOLOv8x | 82% | 58% | 95% | 93% |
YOLOv11x | 85% | 62% | 98% | 95% |
difference | 3% | 4% | 2% | 2% |
These observations facilitated the identification of object classes that presented the most significant challenges during the detection process. Specifically, a pronounced tendency to misclassify background features, particularly within the YOLOv8x architecture. This phenomenon suggests a requirement for further dataset refinement, either through the inclusion of more diverse background samples or the implementation to enhance classes. Conversely, the confusion matrix analysis revealed that YOLOv11x demonstrated better discriminative capabilities in distinguishing background elements from. Such divergent results indicate that neither architecture maintains a definitive advantage when trained on Dataset V3.
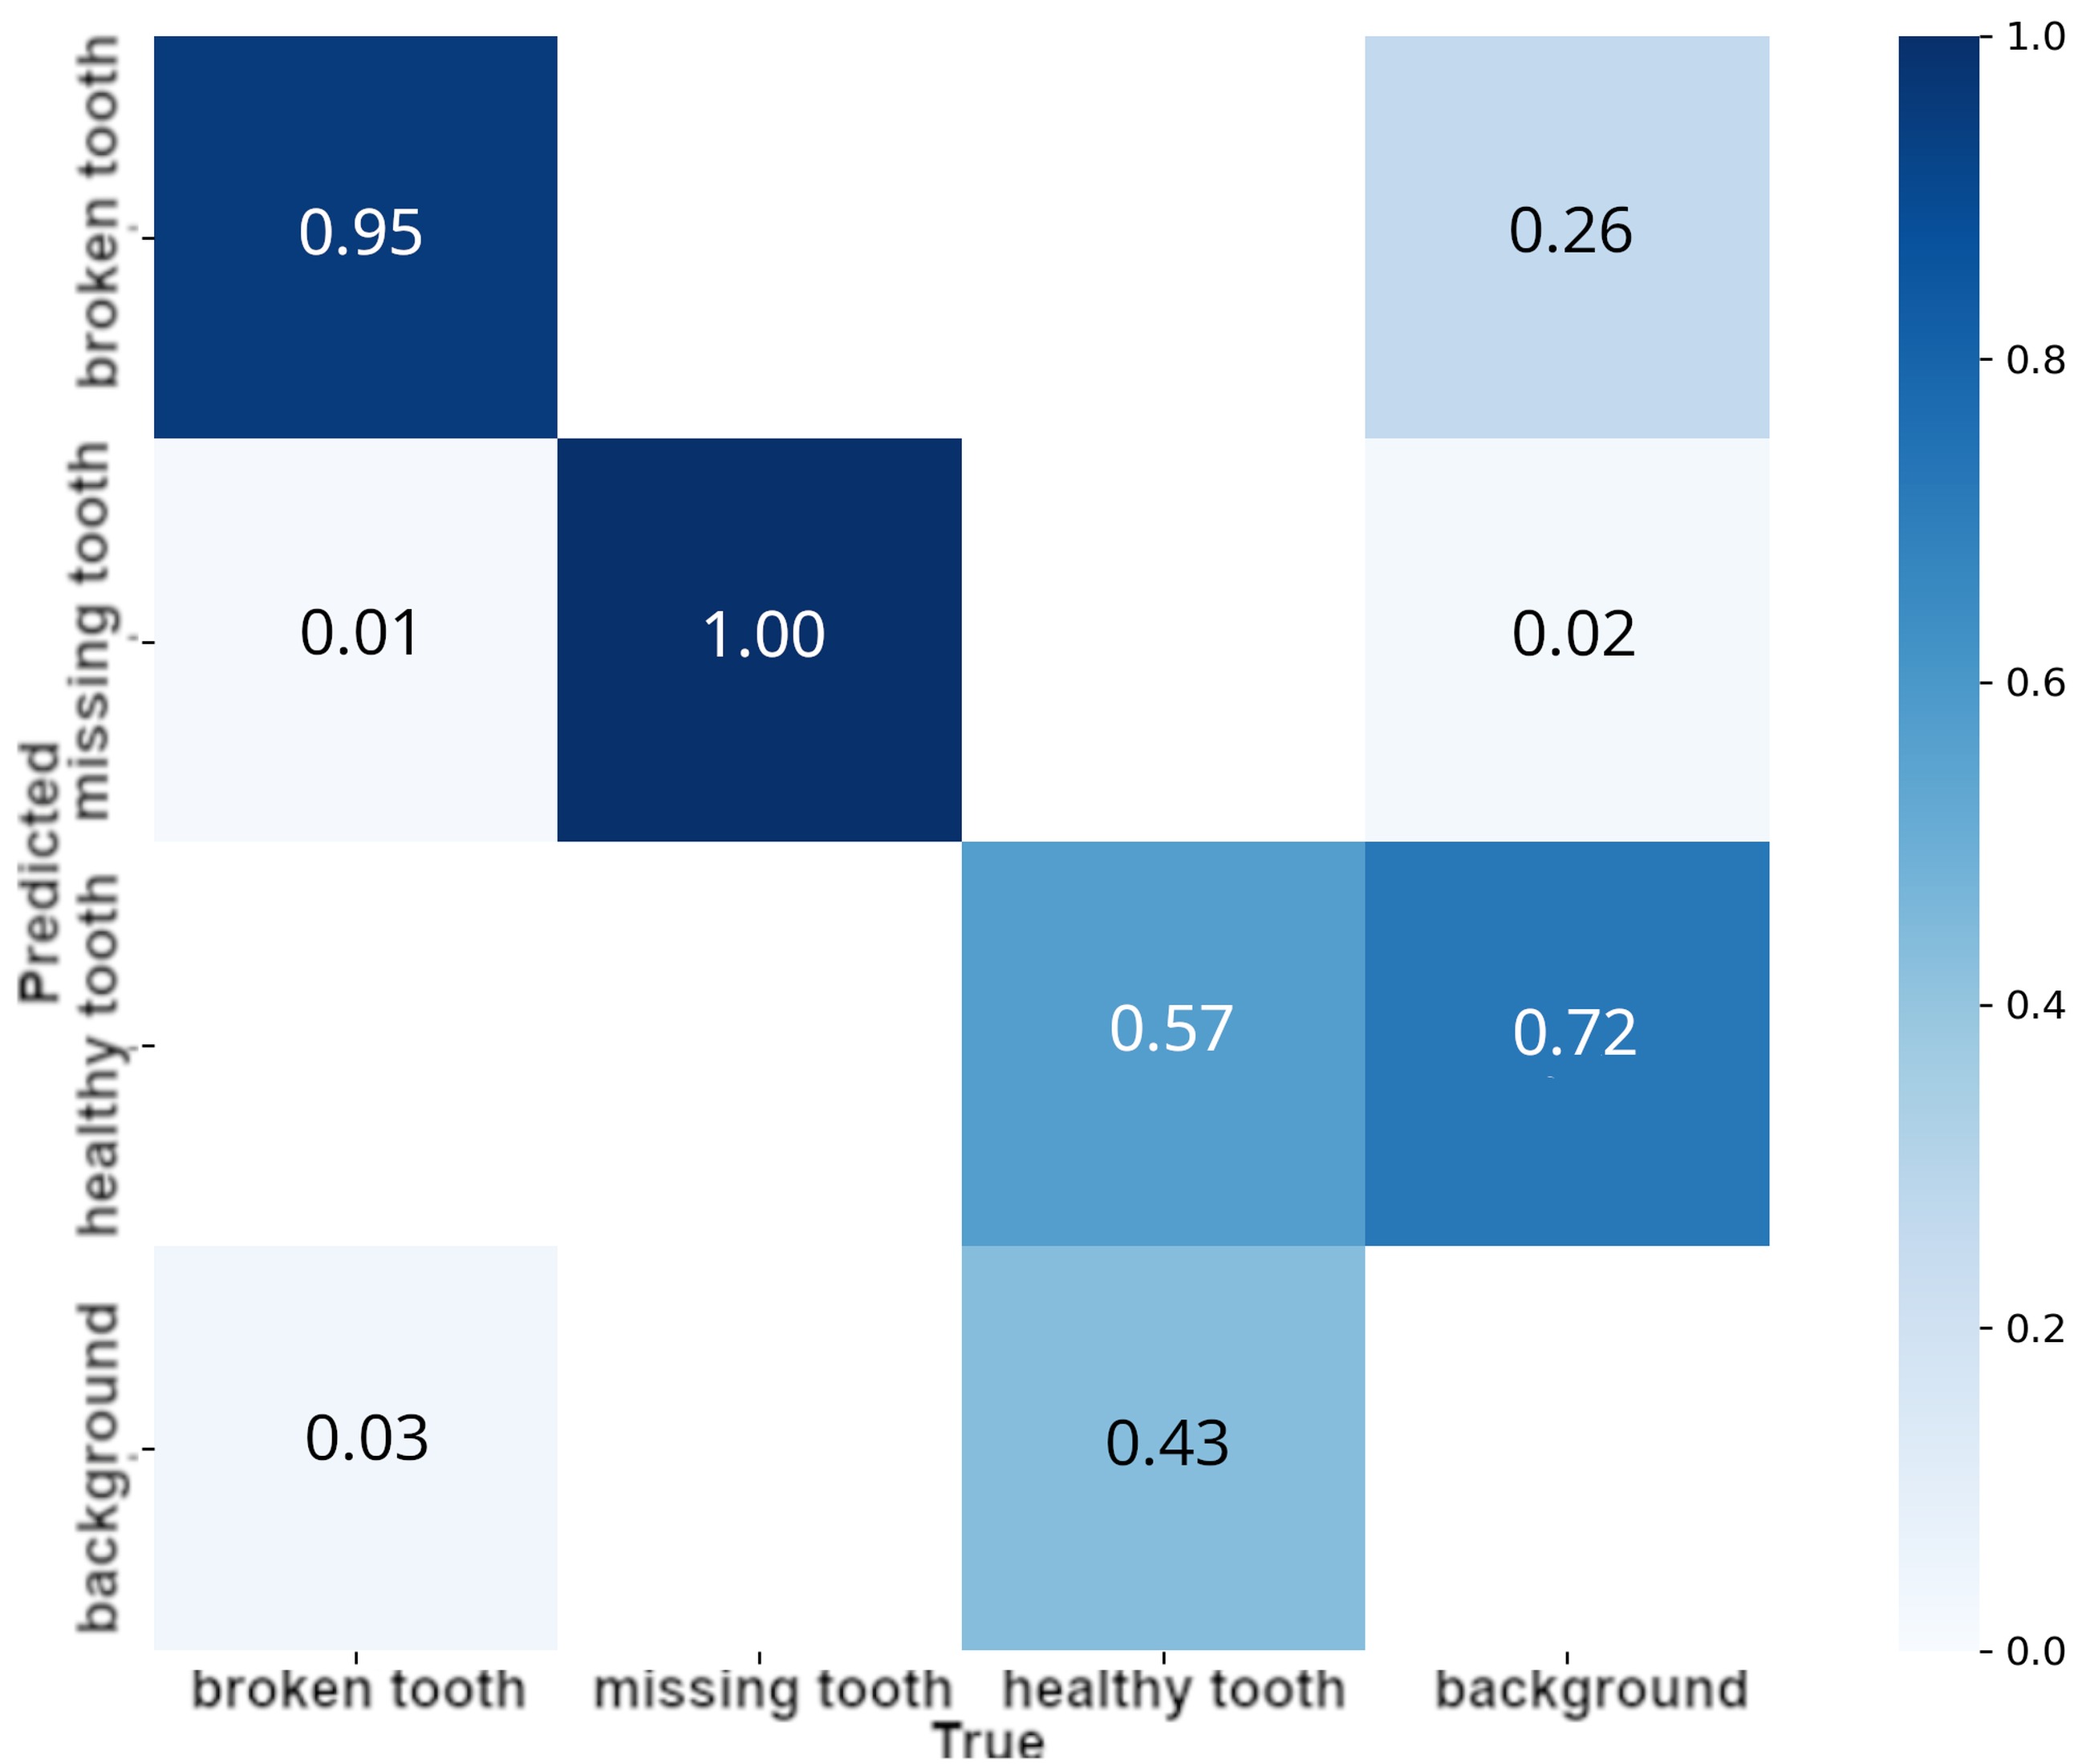
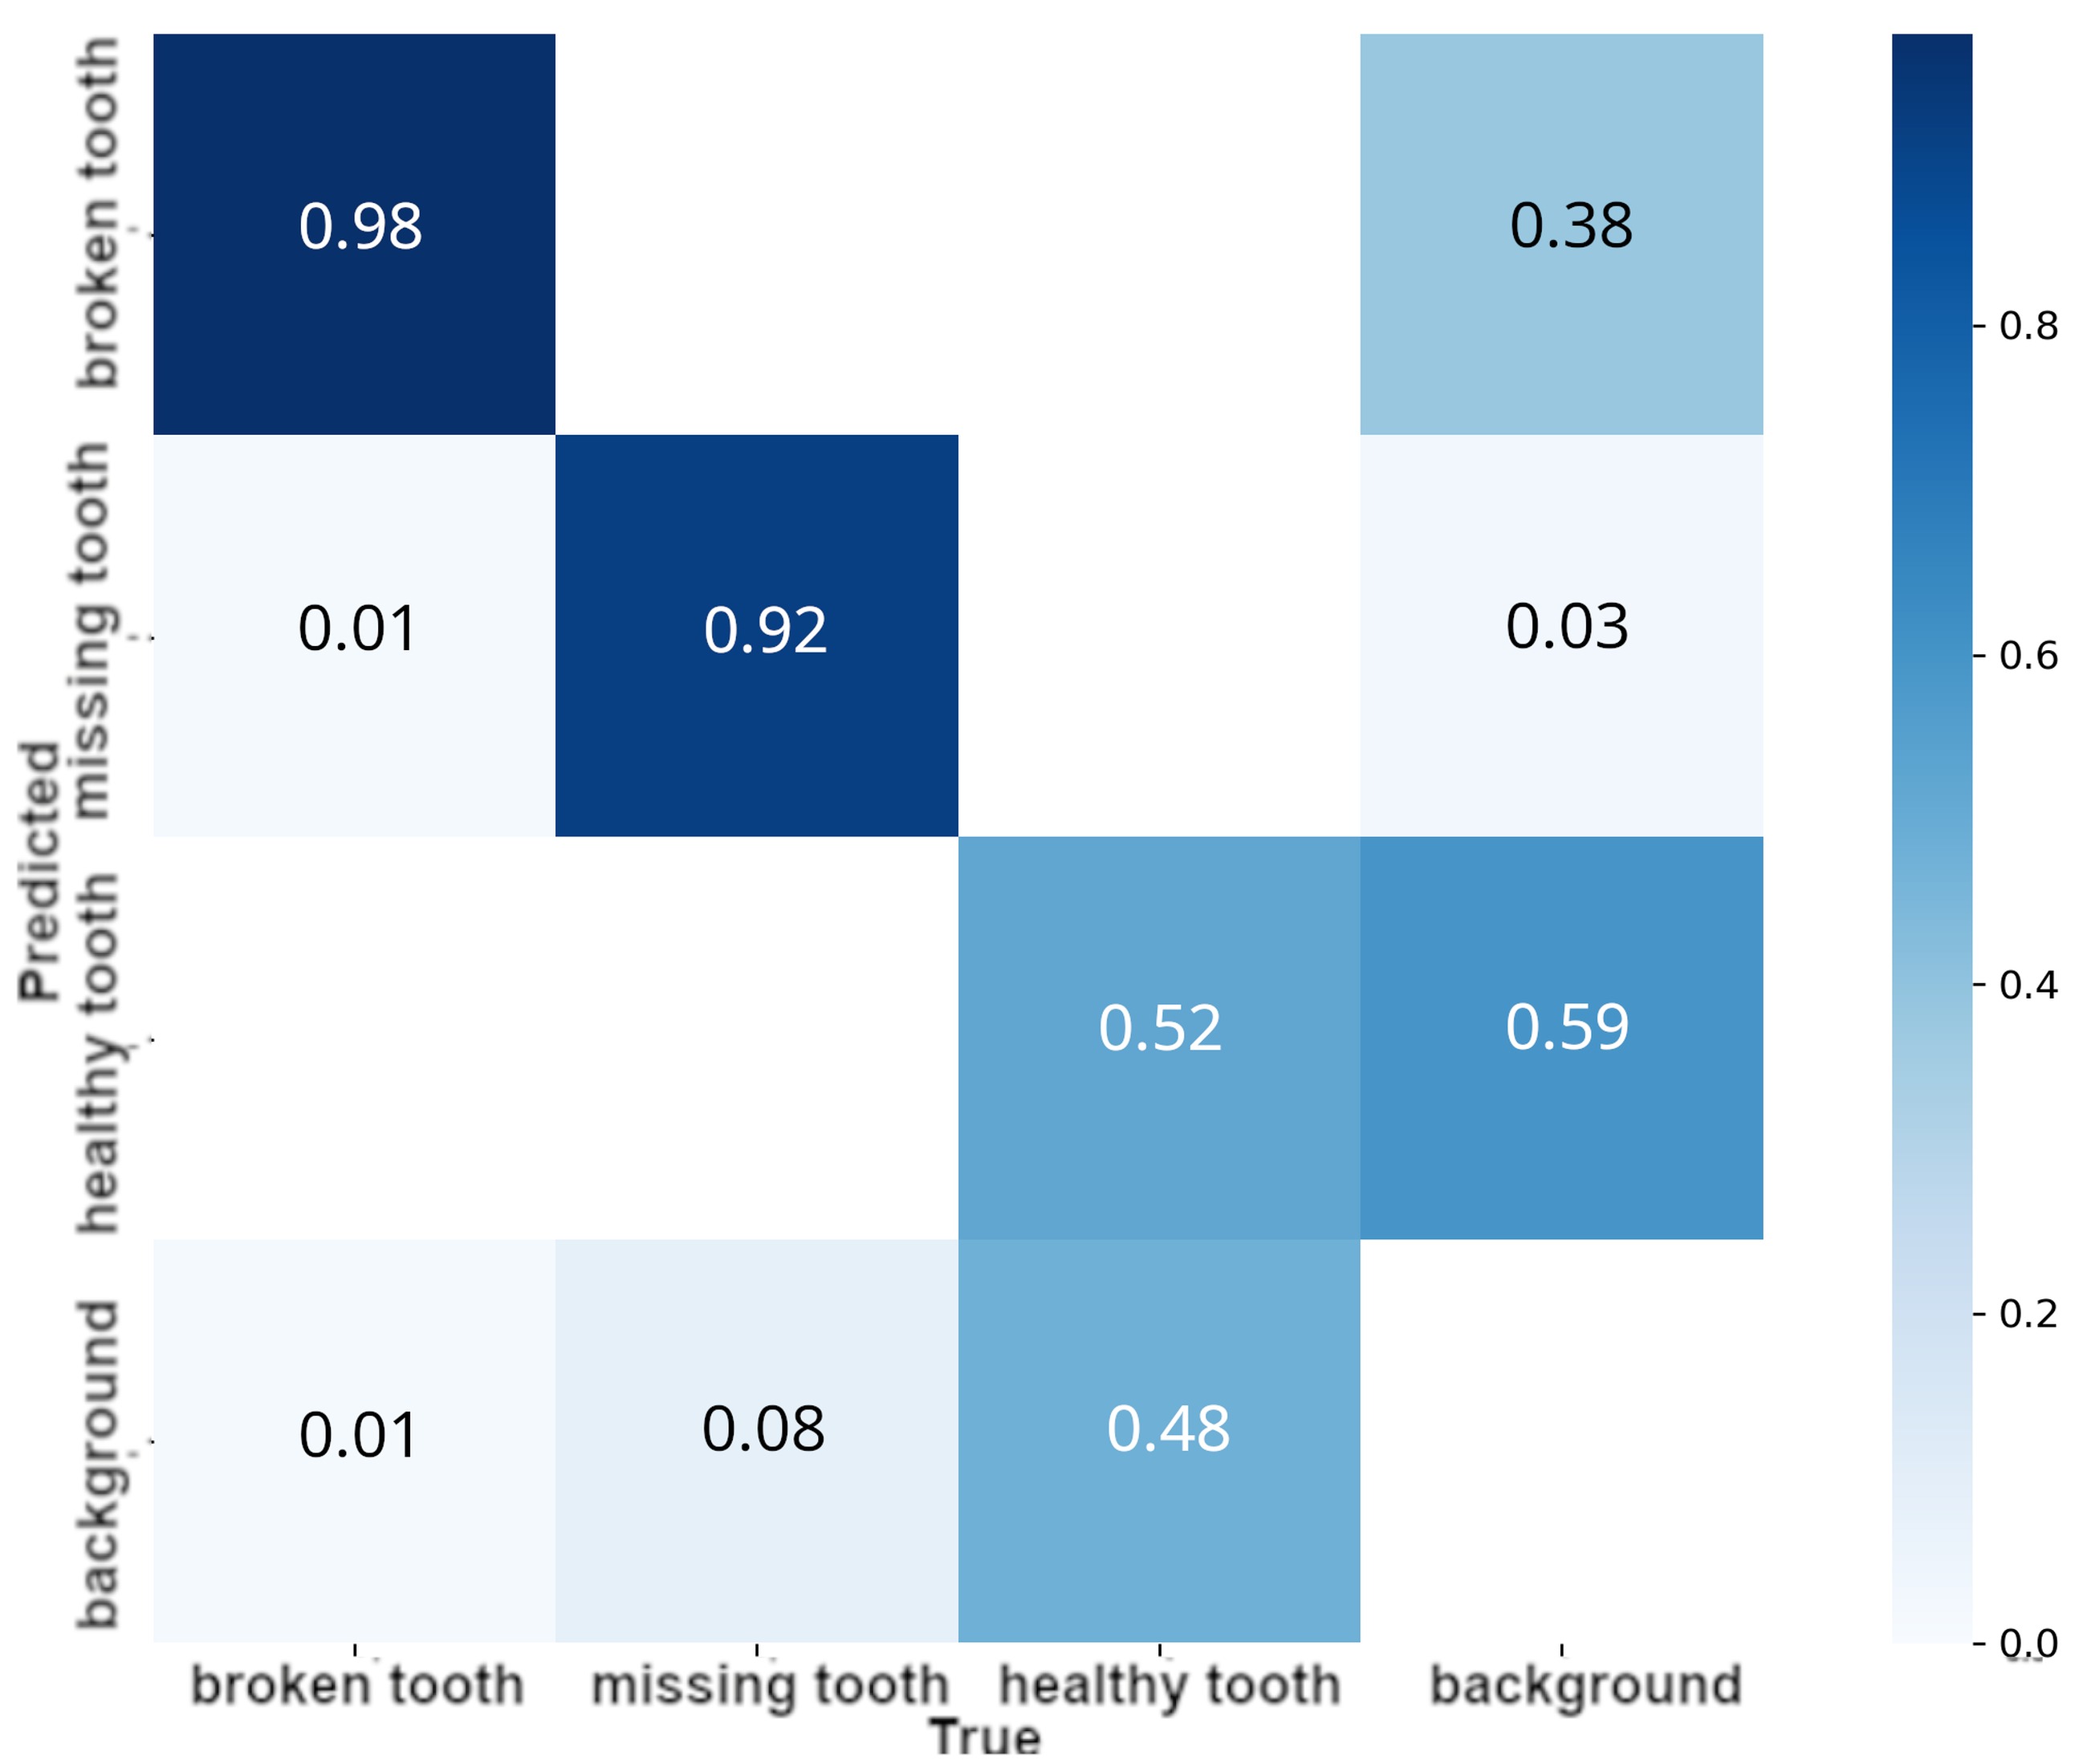
A comparative analysis of the confusion matrices for the YOLOv11x and YOLOv8x architectures Fig. 10-11, respectively elucidated specific challenges encountered during the training phase. The confusion matrix analysis reveals that both models encountered challenges regarding the healthy tooth class. Specifically, a significant tendency to misclassify background elements was observed 72% for the YOLOv11x model and 59% for YOLOv8x. While the YOLOv8x architecture exhibited a higher frequency of background-related issues, this margin did not exceed the comparison observed in the v11x model. These variations warrant further investigation in future work, particularly concerning their integration into real-world detection systems. Furthermore, the analysis of inter class confusion suggests that future research should explore more complex neural architectures or the modification of loss functions tailored to mitigate specific misclassification types.
Comparison of YOLOv8x and YOLOv11x
This chapter aims to directly compare the learning results of the YOLOv8x and YOLOv11x models achieved on three sets of data: Dataset V1, Dataset V2 and Dataset V3. This analysis will identify the impact of dataset characteristics on the performance of the two architectures and conclude their generalizability and specificity in fault detection. Using the results discussed in Sections 3.1–3.3, this section will present a comparison of the two models. The first property that was compared is the value of mAP0.5 for the two models using Datasets V1, V2 Tab. 16. The results show that Dataset V2 after applying additional effects to the materials extracted from the videos. They show an improvement in values in both cases of 15% for YOLOv8x and 12% for the YOLOv11x model. The Yolov8x model showed a better response to the modified database, with 3% over the Yolov11x model.
Tab. 16
Results of mAP0.5 values for Datasets
Model | Dataset V1 | Dataset V2 | Dataset V3 |
YOLOv8x | 62% | 77% | 82% |
YOLOv11x | 62% | 74% | 85% |
YOLOv8x overall mAP0.5 value for YOLOv8x was 0.625 on Dataset V1. On Dataset V2, there was an improvement of 3% when all classes were included. However, after excluding the problematic broken tooth class from the Dataset V2 analysis, a direct comparison of overall efficacy becomes more difficult without recalculating mAP0.5 for healthy tooth classes only. Nevertheless, the initial increase of 3% suggests that Dataset V2 may have been more favourable for overall detection before excluding broken teeth.
YOLOv11x, similarly to the YOLOv8x model achieved a mAP0.5 of 0.625 on Dataset V1. On Dataset V2, after excluding the broken tooth class, the model showed an overall detection efficiency of 62%, indicating no significant change in the overall metric compared to Dataset V1. Both models showed similar overall performance on both datasets, with a slight upward trend for YOLOv8x on DatasetV2 before excluding the missing tooth. This suggests that the overall complexity and characteristics of the three datasets may have been comparable in terms of detection difficulty. Class healthy tooth with YOLOv8x achieved mAP0.5 with higher precision for the class healthy tooth on Dataset V1 equalled 0.729 compared to Dataset V2 where YOLOv11x was better by 3%. YOLOv11x showed mAP0.5 lower precision for the healthy tooth class on Dataset V1 of 0.684, compared to Dataset V2 where it performed better than YOLOv8x. Dataset V1 provided the YOLOv8x model with better examples to learn the characteristics of normal teeth, while Dataset V2 was more favourable to YOLOv11x in detecting this class. The missing tooth class YOLOv11x showed significantly higher precision for the missing tooth class on Dataset V1 where mAP0.5 equals 0.670, compared to YOLOv8x where mAP0.5 equals 0.501. On Dataset V2, both architectures achieved very high precision. The models trained on Dataset V3 Tab.16, which incorporates supplementary photographic material, lead to a substantial improvement across all classes. The YOLOv11x model achieved an overall accuracy of 85%, slightly outperforming the YOLOv8x model at 82%. This enhanced performance is attributed to the inclusion of additional training data and a more refined class distribution between healthy and broken tooth. The results suggest that maintaining strict class balance in labelling and incorporating a wider variety of damage cases can significantly optimise the model training process and give better results.
Confusion matrix provided insight into the models ability to distinguish objects from the background on both datasets. On Dataset V1, both models showed problems distinguishing background, especially in the context of the healthy tooth class. On DatasetV2, the YOLOv11x model showed a significantly better distinction of background from healthy tooth class (33%) compared to YOLOv8x. In addition, YOLOv11x had a 37% lower rate of misclassifying background as missing tooth lesions. Dataset V2 appears to have posed greater challenges in distinguishing the background for YOLOv8x in the context of healthy tooth class, while YOLOv11x performed better on this dataset. YOLOv11x's better performance in distinguishing backgrounds on Dataset V2 may suggest that this dataset contained more complex or diverse examples of backgrounds.
A comparison of results on Dataset V1 and Dataset V2 reveals that dataset characteristics have a significant impact on the relative performance of both YOLO architectures. While the overall performance of mAP0.5 was similar, the precision of detection of individual classes and the ability to distinguish objects from background varied by dataset and model. Dataset V1 appears to be more diagnostic in differentiating the two models ability to detect particular types of damage, with a clear advantage for YOLOv11x in missing tooth detection. Dataset V2, despite an overall improvement for YOLOv8x before excluding the broken tooth, posed greater challenges in distinguishing the background for YOLOv8x. The high precision for the missing tooth class on this dataset requires careful interpretation.
The Dataset V3 demonstrated that rigorous collection and processing of photographic material are critical to enhancing the model training process. Notably, as data quality improved, the performance disparity between the models became significantly less pronounced compared to earlier iterations. However, the operational efficiency of these models must be validated in a real-world testing environment to confirm their practical viability. These results underscore the importance of careful selection and preparation of datasets in the process of learning object detection models. The differences in performance on different datasets suggest that generalizing models can be a challenge and that performance may be strongly related to the characteristics of the training data.
Conclusions And Future Work
In the above article, a comparative analysis of two neural network architectures, YOLOv8x and YOLOv11x, in the task of detecting damage to the teeth of an agricultural machine, using three separate datasets was carried out, providing important conclusions about their relative performance and the impact of training data characteristics. On Dataset V1, the two models achieved identical overall mAP0.5 performance of 0.625 (62%), but revealed differences in the detection precision of each class. YOLOv11x showed higher precision in detecting a missing tooth lesion of 0.670, 17% better than YOLOv8x with mAP0.5 score of 0.501. In contrast, YOLOv8x was more effective in identifying healthy tooth with a precision of 0.729, compared to 0.684 for YOLOv11x by 9% worse. Analysis of the confusion matrix indicated general difficulties with the broken tooth class and with distinguishing objects from the background. Analysis using Dataset V2 showed a slight improvement in the overall mAP0.5 value for YOLOv8x before excluding the problematic missing tooth class. After excluding this class due to suspected overfitting, achieving 99% precision in both models, However, YOLOv11x showed better overall detection statistics at 62% after excluding the missing tooth. The model also achieved better distinction of background from healthy tooth class by 33%. A comparison between the datasets revealed that Dataset V1 did a better job of differentiating between the two models' abilities to detect particular types of damage. Dataset V3 seemed to pose more promising results, achieving 82% and 86% accuracy, precision and recall. That tells us that improving datasets has a significant impact on the end result of models. This demonstrates the potential of implementing YOLO models for damage detection in our application.
In further work, it is planned to increase the sample size in the dataset for each class: healthy tooth, missing tooth, and broken tooth. In addition, it is anticipated that the database will be expanded to include new damage categories for SaMASZ P8-890 and P10-1100 rotary tedders. A key goal is to significantly improve object classification accuracy metrics. It is also necessary to implement methods to reduce visual artifacts from the background. The machine environment generates numerous distortions that negatively affect the visibility of analyzed objects. Effective segmentation of the background and identification of its components is a fundamental aspect of further research to improve the accuracy of damage detection in machine operating conditions. The deployment of the YOLOv11x and YOLOv8x architecture for high-speed applications necessitates a rigorous balance between spatial resolution and temporal frequency. In the interest of maintaining a high mean Average Precision mAP, it is recommended that, when detecting small or distant fast-moving targets, an input resolution of at least 1280x1280 pixels be considered, as lower densities result in feature degradation during down-sampling. While a standard temporal resolution of 30 FPS will be sufficient for static environments such as inspection in a diagnostic station, capturing high-velocity dynamics such as work in a field could require a high-speed acquisition rate of 60 to 120 FPS. It is thought that this increased frame rate is essential for reducing the displacement interval between successive frames, thereby enhancing the stability of object tracking algorithms. Furthermore, to mitigate the risk of motion blur, which can obscure edge gradients critical for neural network feature extraction, it is advisable to synchronise a short exposure time shutter speed of 1/1000s or faster with high-bandwidth interfaces to ensure data integrity at peak resolutions.
This research is supported by Ministry of Science and Higher Education, “VIA CARPATIA Universities of Technology Network named after the President of the Republic of Poland Lech Kaczyński” project no MEiN/2022/DPI/2575, as part of the action “ISKRA – building inter-university research teams”.