
Introduction
Condensation is a highly efficient heat transfer mechanism. This phase change phenomenon, ubiquitous in nature, occurs when vapor comes into contact with a cold surface and condenses, releasing a significant amount of latent heat. This mechanism makes it an effective process for heat exchange [1]. The condensed liquid forms a film that completely covers the surface before flowing under the effect of gravity [2]. Condensation in a stagnant pure vapor film, occurring on the external surface of a single tube or a tube bundle, is commonly encountered in engineering systems, petrochemical industries, and electricity generation. It is also implemented in various industrial equipment, including medium to large capacity refrigeration and air conditioning machines, energy conversion systems, as well as in the chemical and food industries [3, 4].
Smooth horizontal tubes are widely used in shell-and-tube condensers due to their many advantages, including resistance to high pressures, ease of cleaning, and low manufacturing cost [5]. This type of condenser consists of a shell, a fixed tube sheet, and a tube bundle, where vapor condenses on the external surface of the tubes while the cooling fluid, typically water, circulates inside. As a key component in heat transfer, the horizontal tube plays a crucial role in the overall performance of the condenser [6].
External condensation on smooth horizontal tubes is a frequently encountered configuration, particularly for heat recovery and cooling of industrial fluids. This process optimizes heat transfer by utilizing the formation of liquid films on the tube surfaces. However, the design and optimization of these condensers require precise data on the heat transfer coefficient to accurately assess the efficiency of the condensation processes [7]. A thorough understanding of these mechanisms is essential to improve energy efficiency and reduce operational costs in industrial systems.
Despite numerous studies on condensation, accurately modeling the heat transfer coefficient for external condensation on smooth horizontal tubes remains a challenge. This modeling is a key reference for comparing performance with enhanced tubes [8]. However, the variability of experimental conditions, the diversity of fluids used, and the complexity of the flows generated during condensation complicate its development. Although theoretical models provide valuable insights, they often have limitations when applied to real systems. It is therefore crucial to gather additional experimental data and refine existing models to improve understanding and prediction of condensation performance under specific conditions [9].
In-depth investigations have been conducted to characterize heat transfer during condensation [10-12]. Analysis of several correlations has highlighted the dependence of the heat transfer coefficient on various parameters, such as heat flux, saturation temperature, and the thermo physical properties of the working fluids. Additionally, it has been recommended to extend the development of these correlations by incorporating other factors, including the nature of the surface material in contact with the fluid.
Jaber and Webb [13] conducted experimental work comparing condensation on smooth horizontal tubes and enhanced tubes. Smooth tubes serve as a reference to quantify the thermal efficiency gains offered by enhanced tubes, particularly with regard to the heat transfer coefficient and overall thermal performance.
Chang and Tao [14] performed experimental studies on vapor film condensation on a smooth horizontal tube and three enhanced tubes. Comparisons were made based on experimental results obtained for several fluids. The heat transfer coefficients predicted by Nusselt’s theory align with experimental data within a 15% margin of error at a saturation temperature of 40°C.
The analysis presented in this work is based on the methodology adopted by Baki and Sahel [15] in analyzing boiling on the external surface of a horizontal tube. Experimental data were extracted from the literature and compared with theoretical values obtained from established correlations, allowing the determination of the heat transfer coefficient as a function of specific parameters.
Analysis Of The Collected Data
Correlations
Nusselt’s correlation (1916)
Physically, Nusselt’s correlation represents the fundamental model of laminar film condensation, derived from an analytical balance between gravity and viscous forces in a thin liquid film. The model assumes steady, laminar, and purely gravity driven flow, with heat transfer governed by conduction through the condensate layer. No shear at the vapor–liquid interface, subcooling, or convective effects are considered. It provides the theoretical baseline for most subsequent developments and remains a benchmark for smooth-tube condensation.
White’s correlation (1948) (2)
White extended Nusselt’s analysis by including a correction for viscous effects, acknowledging that internal viscous dissipation within the condensate can influence the heat transfer rate, particularly for small diameters or low-temperature differences. The added term modifies the coefficient to account for the resistance of the liquid film due to viscosity, refining the prediction under conditions where viscous forces are not negligible.
Bromley’s correlation (1952)
Bromley introduced the effect of condensate subcooling, considering that the liquid film may not remain exactly at saturation temperature. By including the sensible heat associated with the temperature difference between the liquid film and the vapor, this correlation more accurately captures the energy balance at the interface. It improves the estimation of the heat transfer coefficient when the temperature gradient within the film becomes significant.
Rohsenow’s correlation (1956)
Rohsenow incorporated the reduced vapor pressure (Pv/Pc) to represent the thermodynamic influence of the fluid state. This semi-empirical correction adjusts for variations in fluid properties with operating pressure, especially near the critical point. The model thus extends Nusselt’s theory to a broader range of fluids and conditions by accounting for property changes and partial subcooling effects.
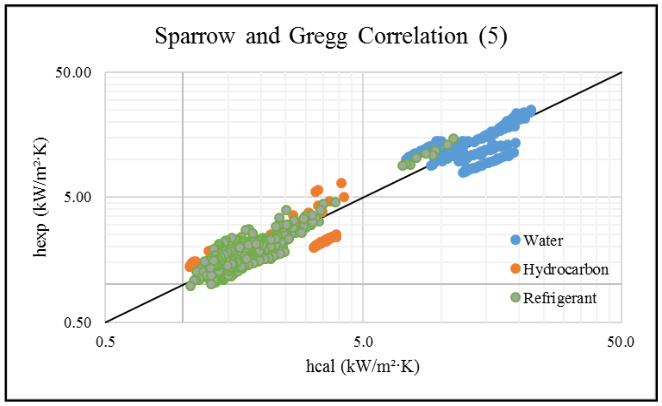
Sparrow and Gregg’s correlation (1959)
Sparrow and Gregg reformulated the Nusselt equation using kinematic viscosity instead of dynamic viscosity, highlighting the importance of momentum diffusion in the film flow. Their approach emphasizes the role of the balance between gravitational and viscous forces characterized by the film Reynolds number. The model retains the laminar assumption but simplifies the analytical form, improving usability in engineering calculations.
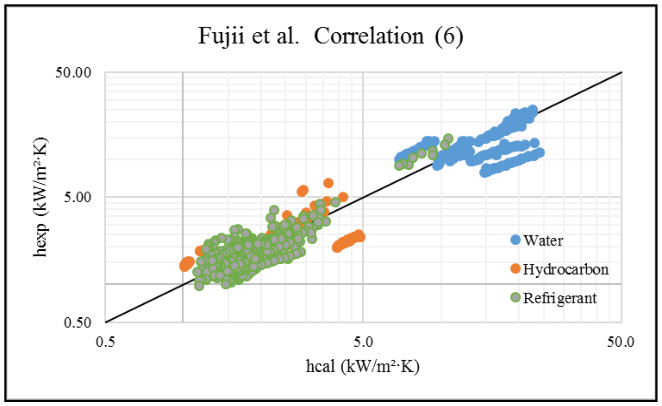
Fujiiet al.’s correlation (1972)
Fujii and co-workers proposed a physically distinct approach by expressing the correlation as a function of the heat flux rather than the temperature difference. The cubic-root dependence results from dimensional analysis that relates the film thickness directly to the imposed heat flux. This formulation captures the coupling between thermal and hydrodynamic fields, making it particularly relevant for non-isothermal surfaces or forced-flux conditions.
Sadasivan and Lienhard’s correlation (1987)
Sadasivan and Lienhard extended Nusselt’s theory by introducing corrections for both subcooling and the characteristic tube length. Their model accounts for the spatial development of the condensate film and the influence of internal conduction within the liquid. The correlation thereby refines the prediction of heat transfer for long tubes or partially developed condensation regimes, where the film thickness and local properties vary along the surface.
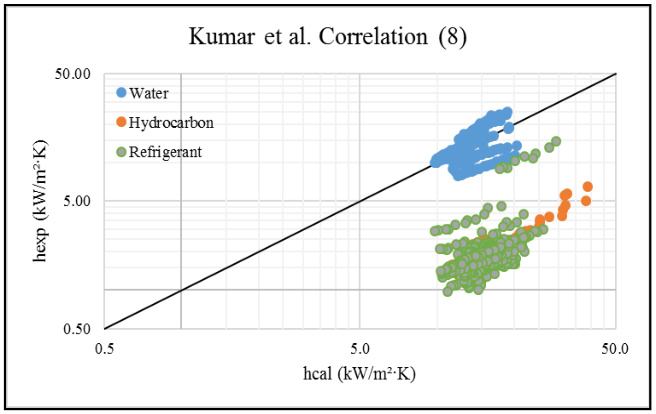
Kumar et al.’s correlation (1998)
Kumar et al. proposed a purely empirical correlation based on curve fitting to experimental data over a range of operating conditions. The relationship between h and ΔT implicitly includes the combined effects of thermophysical properties, pressure, and geometry. While physically less rigorous, it provides a convenient predictive tool for practical applications under conditions similar to those tested experimentally.
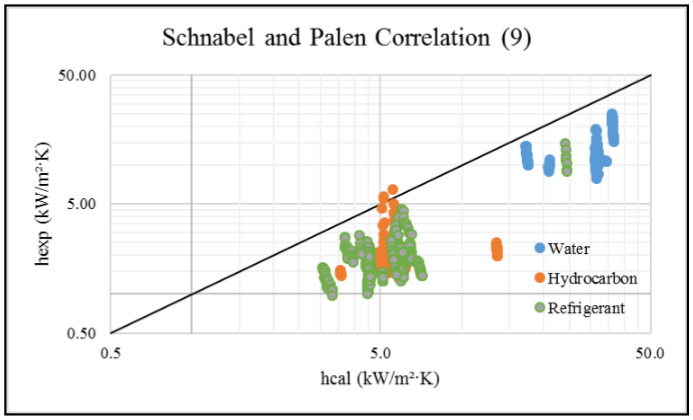
Schnabel and Palen’s correlation (1998)
Schnabel and Palen developed a semi-empirical model combining a Nusselt-type laminar term with corrective components that account for viscous and conductive effects within the film. The resulting formulation captures the transition between pure conduction and convection-dominated regimes, thus improving accuracy for high heat fluxes or low surface tension s. It provides a more realistic description of film dynamics under varying thermal loads.
Hashimoto and Kaminaga’s correlation (2002)
Hashimoto and Kaminaga proposed a modified Nusselt-based model including corrections for heat flux and density ratio effects. The exponential term adjusts the heat transfer coefficient for variations in the liquid-to-vapor density ratio, reflecting changes in film behavior with fluid type and operating pressure. This modernized form combines analytical foundations with empirical adjustments, enhancing applicability to contemporary refrigerants and high performance condensation systems.
Experimental data
A dataset of more than 1000 experimental points, extracted from the literature and presented in Tab.1, concerns the condensation of pure vapor on the external surface of a horizontal tube. Three categories of substances were studied: water (13-30), hydrocarbons (31-37), and refrigerants (38-61). The experiments were conducted with tube diameters ranging from 2.5 to 35 mm. Most cases used copper, followed by stainless steel, carbon steel, aluminum, and other materials.
The experimental pressure ranged between 0.02 and 6.66 MPa, while the saturation temperature of the fluids varied from 18.8 to 125.1°C. During the experiments, the heat flux values ranged from 1.5 to 395.77 KW/m², and the heat transfer coefficient varied between 0.98 and 275 KW/m²·K. The thermo physical properties of the various fluids were obtained from the NIST (National Institute of Standards and Technology) website.
Comparison methods
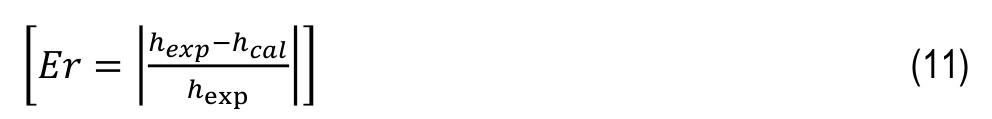
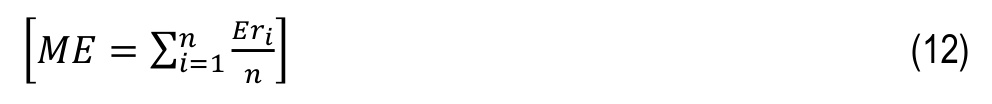
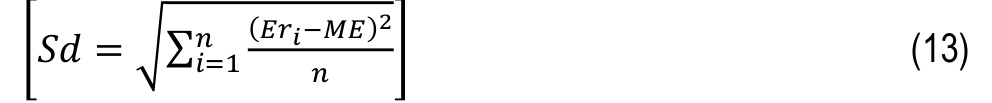
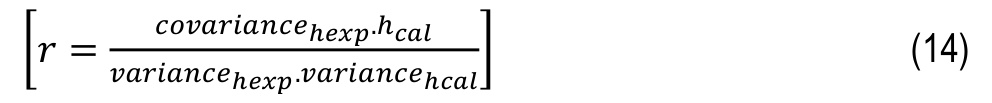
Both visual and statistical approaches are used to compare the values predicted by the correlations with those obtained experimentally. The visual approach involves evaluating the position of plotted points on the graphs relative to the median line. The statistical analysis, on the other hand, is based on the calculation of several error parameters: relative error (Er), mean error (ME), standard deviation of error (Sd), and correlation coefficient (𝑟), whose definitions are provided below:
Evaluation of the correlations
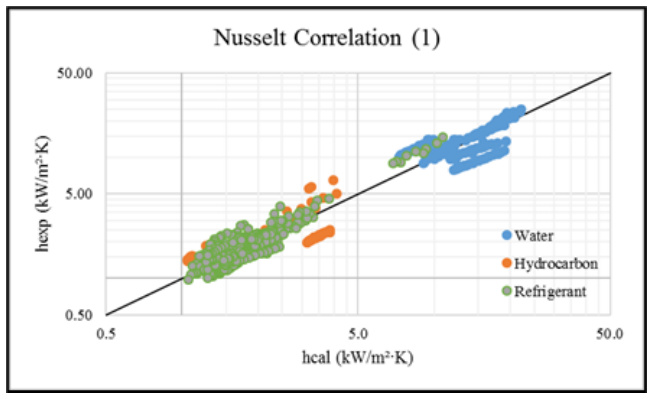
The graphical analyses in Fig.1a highlight a general trend that is consistently aligned around the median line, with small deviations between predictions and measured data for a series of hydrocarbon points and two series of water points. The correlation coefficient r=0.96 indicates a strong agreement between predictions and data, while a low average error (14.46%) confirms the accuracy of this correlation under the study conditions. Therefore, this correlation is reliable for predicting the heat transfer coefficient.
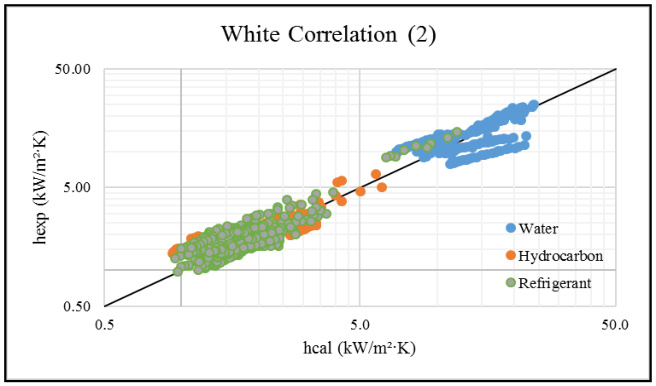
The predictions generally follow the experimental trends in Fig.1b, but with slightly more pronounced deviations water data series. Although r=0.96, the higher average error (17.10%) may reflect a limitation for specific conditions. This correlation is acceptable but slightly less precise than Nusselt's (1).
The predicted values show excellent agreement with the experimental data in Fig.1c, although more pronounced deviations are observed for some data series. With r=0.96and a low average error (14.11%), this correlation is highly reliable for the collected data. It is almost equivalent to Nusselt’s (1).
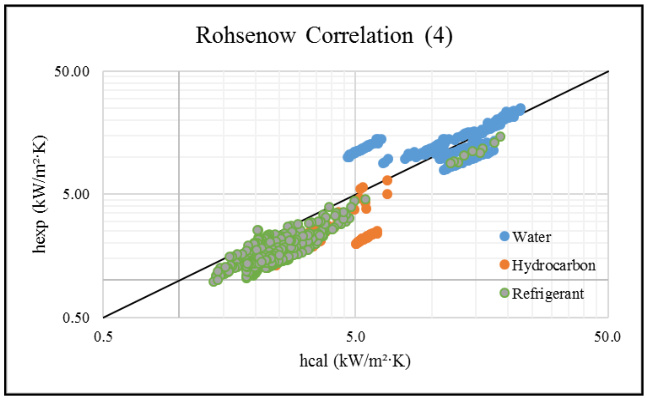
The Fig.1d presents a greater dispersion of points, with significant deviations from the experimental data. It is observed that all points lie below the median line, suggesting that the predicted values are higher than the experimental values. Additionally, a series of points corresponding to low-pressure data (below atmospheric pressure) is located above the median line, indicating that the predicted values are lower than the experimental values in these cases. The correlation coefficient (r=0.93) is slightly lower, and a high average error (31.85%) indicates a lack of precision. Therefore, this correlation seems less suitable for the collected data conditions. In calculating the heat transfer coefficient, the thermo physical properties of the fluid should be considered for a fluid temperature of Tf=Ts-0.69∆TTf=Ts-0.69∆T for each experimental point. However, given the large number of data points and the small difference between Tf and Ts, we opted to use the same value, Tf=Ts .
The Fig.1e shows a very good agreement between predictions and experimental measurements. With r=0.96 and an average error of 14.07%, this correlation is among the most reliable and comparable to those of Nusselt (1) and Bromley (3).
The discrepancies between predictions and experimental data are moderate in Fig.1f, suggesting a greater dispersion around the median line. With r =0.93 and an average error of 18.28%, this correlation is acceptable but less effective than the best ones. It remains usable, but with certain reservations.
The predictions exhibit excellent agreement with experimental data in Fig.1g, where the points are well concentrated around the median line. A strong correlation (r=0.96) and a low average error (14.21%) confirm that this correlation is reliable and well suited to the experimental conditions collected from the literature.
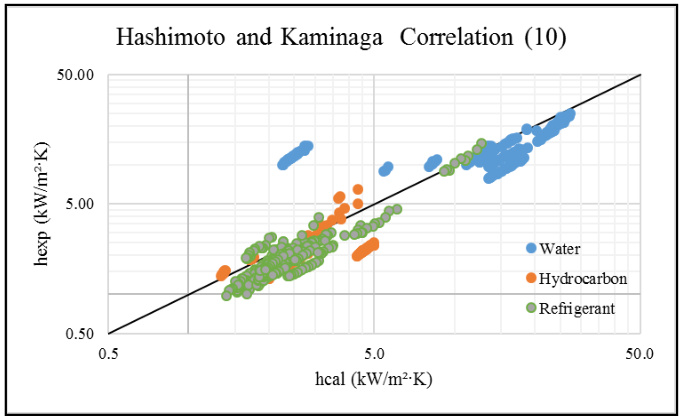
The Fig.1h shows data points divided into two groups: the first, associated with water data, is located around the median line, while the second is above it, indicating that the predicted values are higher than the experimental values. This correlation appears suitable for water but less so for other fluids. A null or negative correlation coefficient (r=−0.04) and a very high average error (70.77%) make this correlation inapplicable to the overall dataset. Although the correlation shows an average agreement with the data, the deviations are significant over certain ranges, with some data series not following the median line trend, see Fig.1i. The predicted values are overestimated and do not match the experimental data. Despite a correlation coefficient r=0.92 and an average error of 63.73%, this correlation proves unsuitable for the present study. Finally, Fig.1j shows significant deviations between predicted and measured values, along with a large dispersion of data points. Although r=0.92, a very high mean error (35.38%) indicates overall poor results for the collected experimental conditions.


Tab. 2
Comparison of the correlations’ results
The correlations (2, 3, 5 and 7) are closely related to Nusselt’s correlation (1) and provide good results (see tab.2.) with a correlation coefficient of r=0.96 and average errors ranging between 14.07% and 17.10%. Nusselt’s correlation remains the reference, although the correlations of White (2), Sparrow, and Gregg (5) show improved results, with lower average errors and a standard deviation equal to or lower than that of Nusselt (1). Conversely, the correlations of Rohsenow (4) and Fujii et al. (6) exhibit lower performance, with a lower r coefficient and higher average errors. The remaining correlations, namely those of Kumar et al. (8), Schnabel and Palen (9), and Hashimoto and Kaminaga (10), are not suitable for our study, which focuses on determining the heat transfer coefficient during the condensation of stagnant pure vapor on the exterior of a horizontal tube.
Proposal For New Correlation
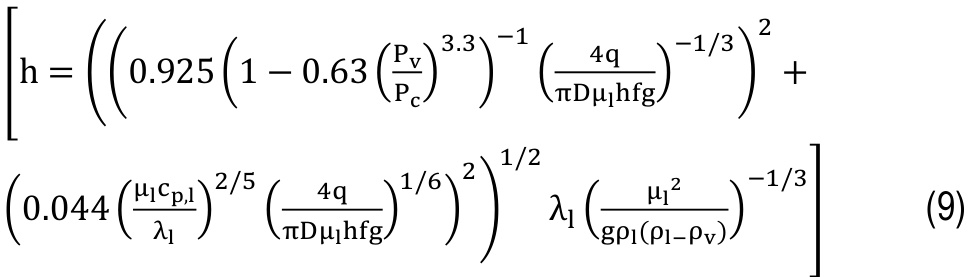
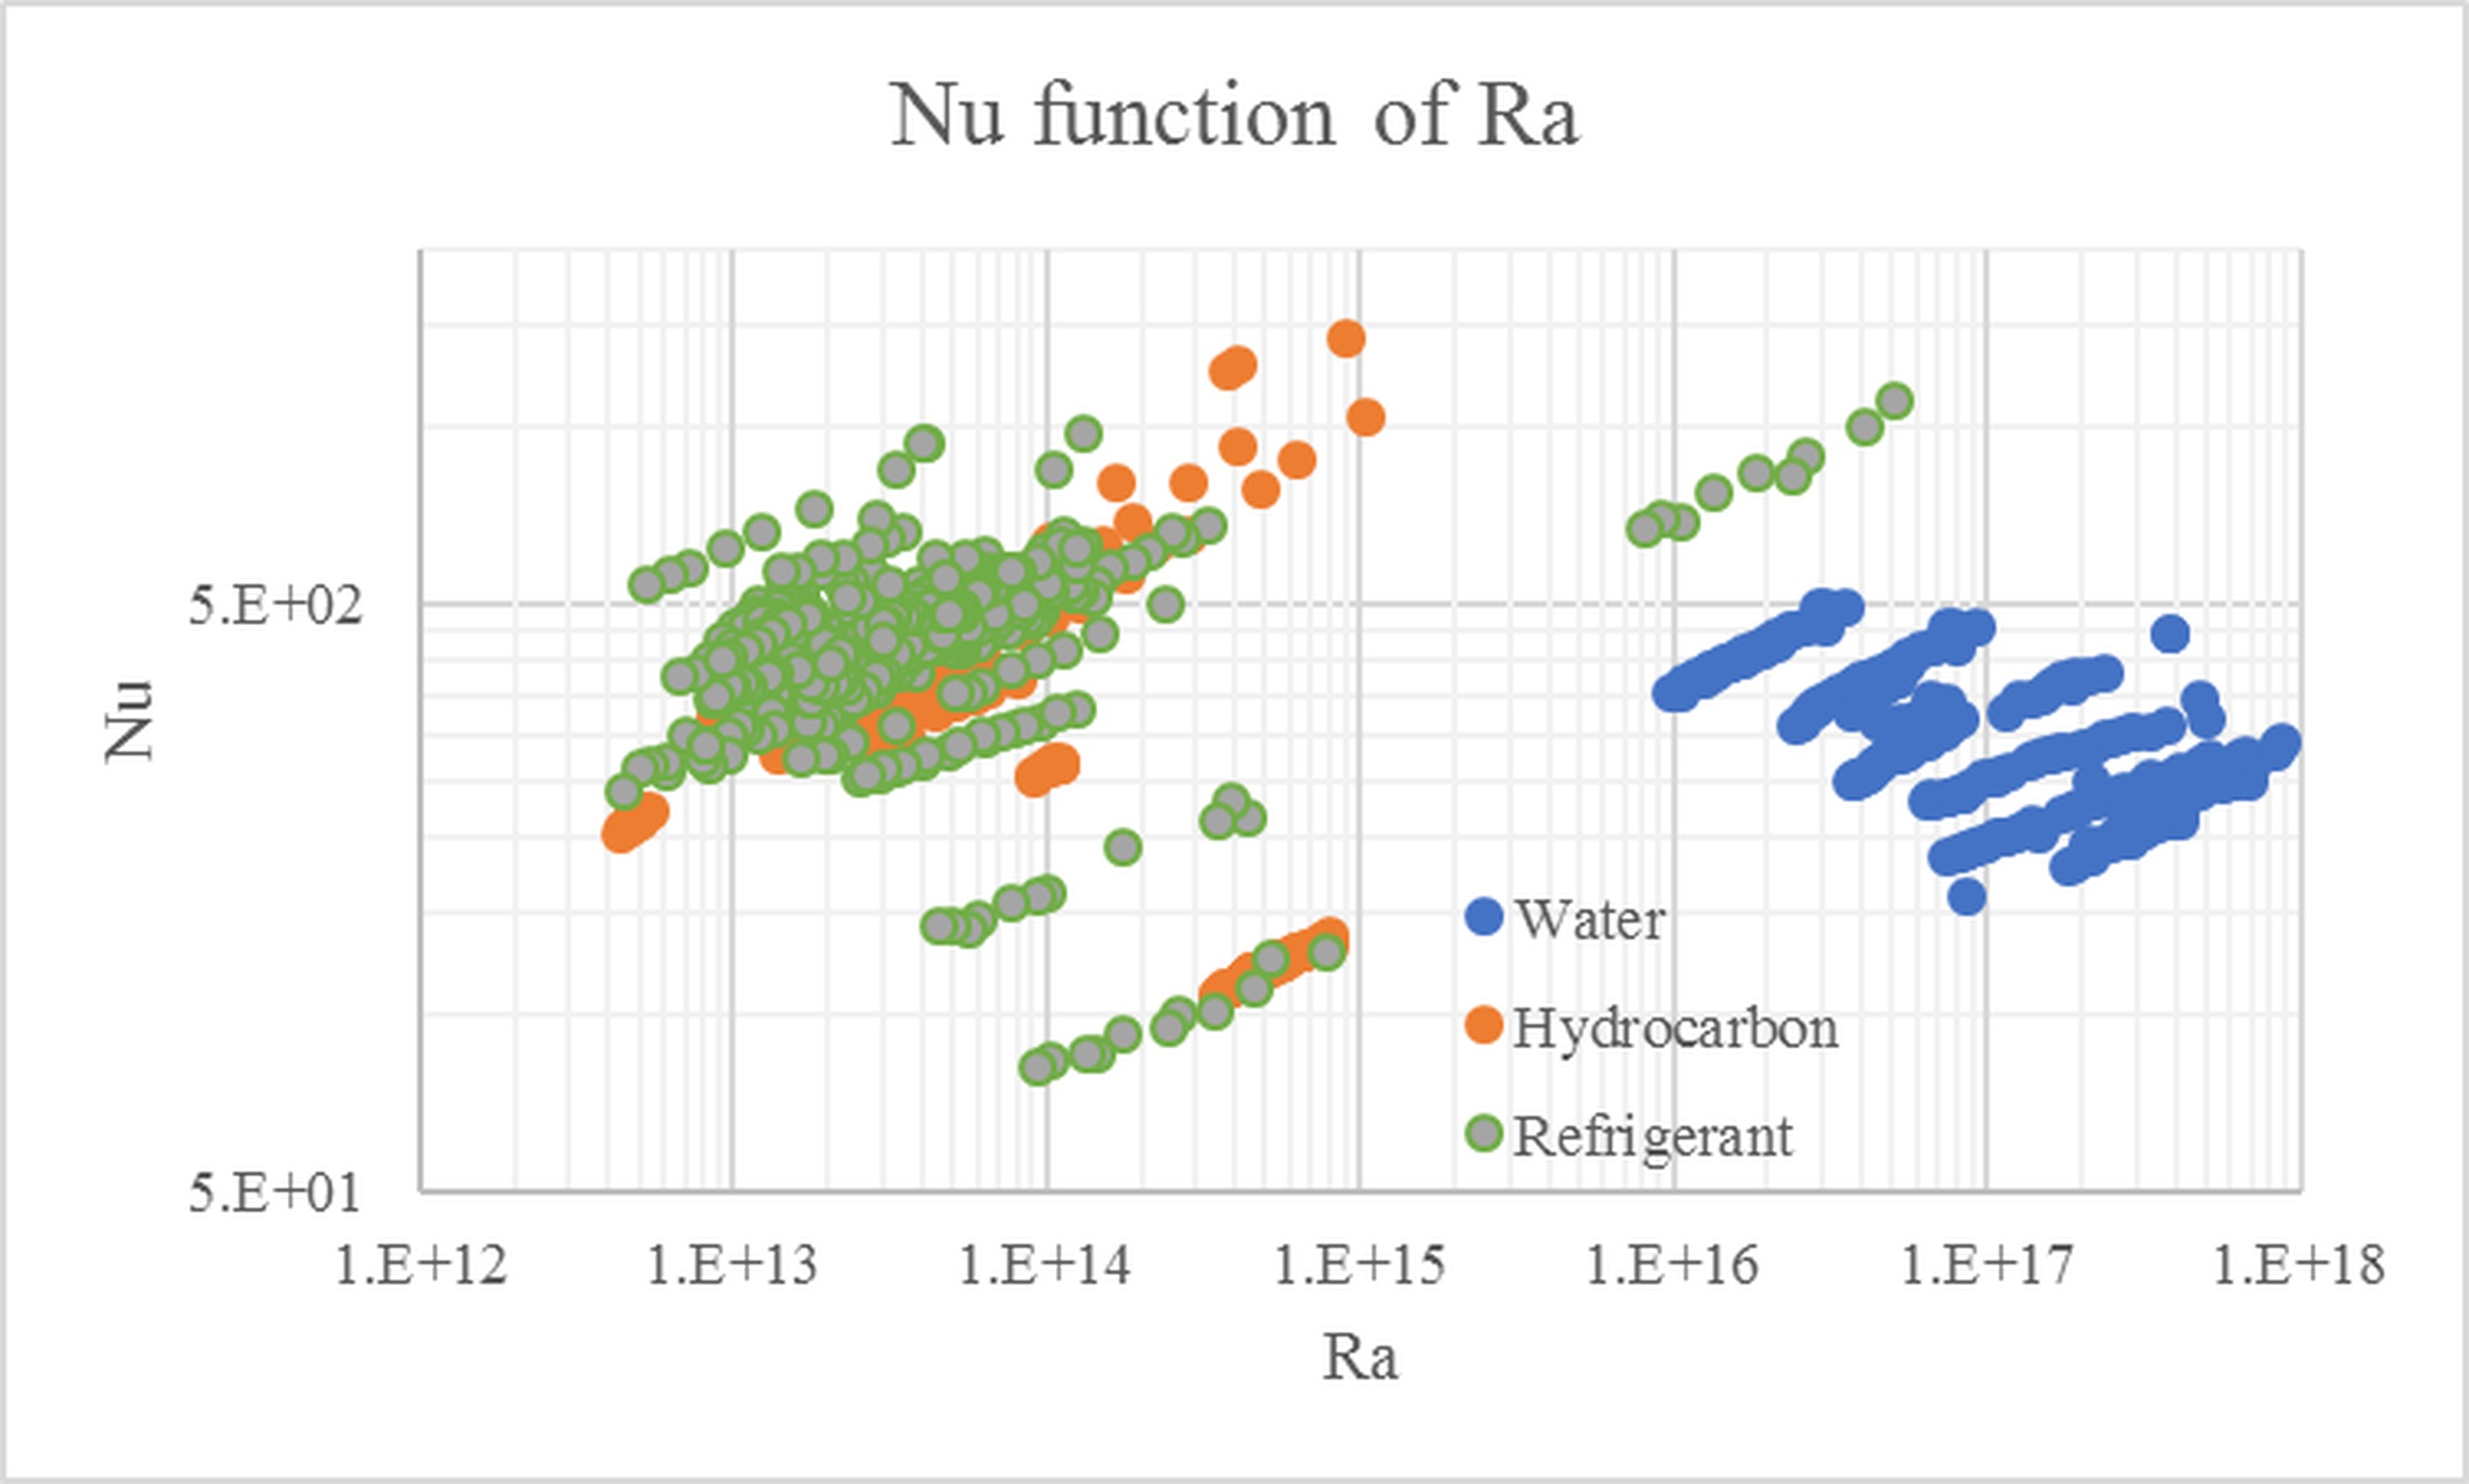
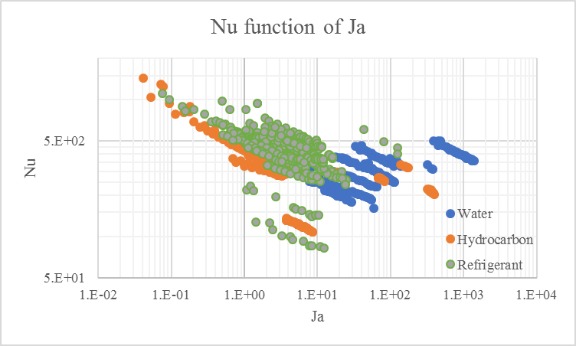
The figures Fig. 2a and Fig. 2b illustrate a direct relationship between the dimensionless Nusselt, Rayleigh, and Jacobs’s numbers. In Fig.2a, the data points follow an overall positive trend, indicating a relationship of the form Nu=CRanNu=CRan. When plotting the trends for each data series, it was observed that the coefficient n varies between 0.121 and 0.403, with some series showing values lower than or even negative, but the majority of points fall within this range and converge around 0.25. Fig.2b presents the relationship in the form Nu=C.JamNu=CJam, with a small negative slope. This leads to the derivation of a correlation for calculating the heat transfer coefficient on the exterior of a horizontal tube, expressed as follows:
By imposing the value of the exponent n = 0.25, the relationship is rewritten as follows:
An iterative approach is used to determine the coefficient C and the exponent m. The newly derived correlation is:
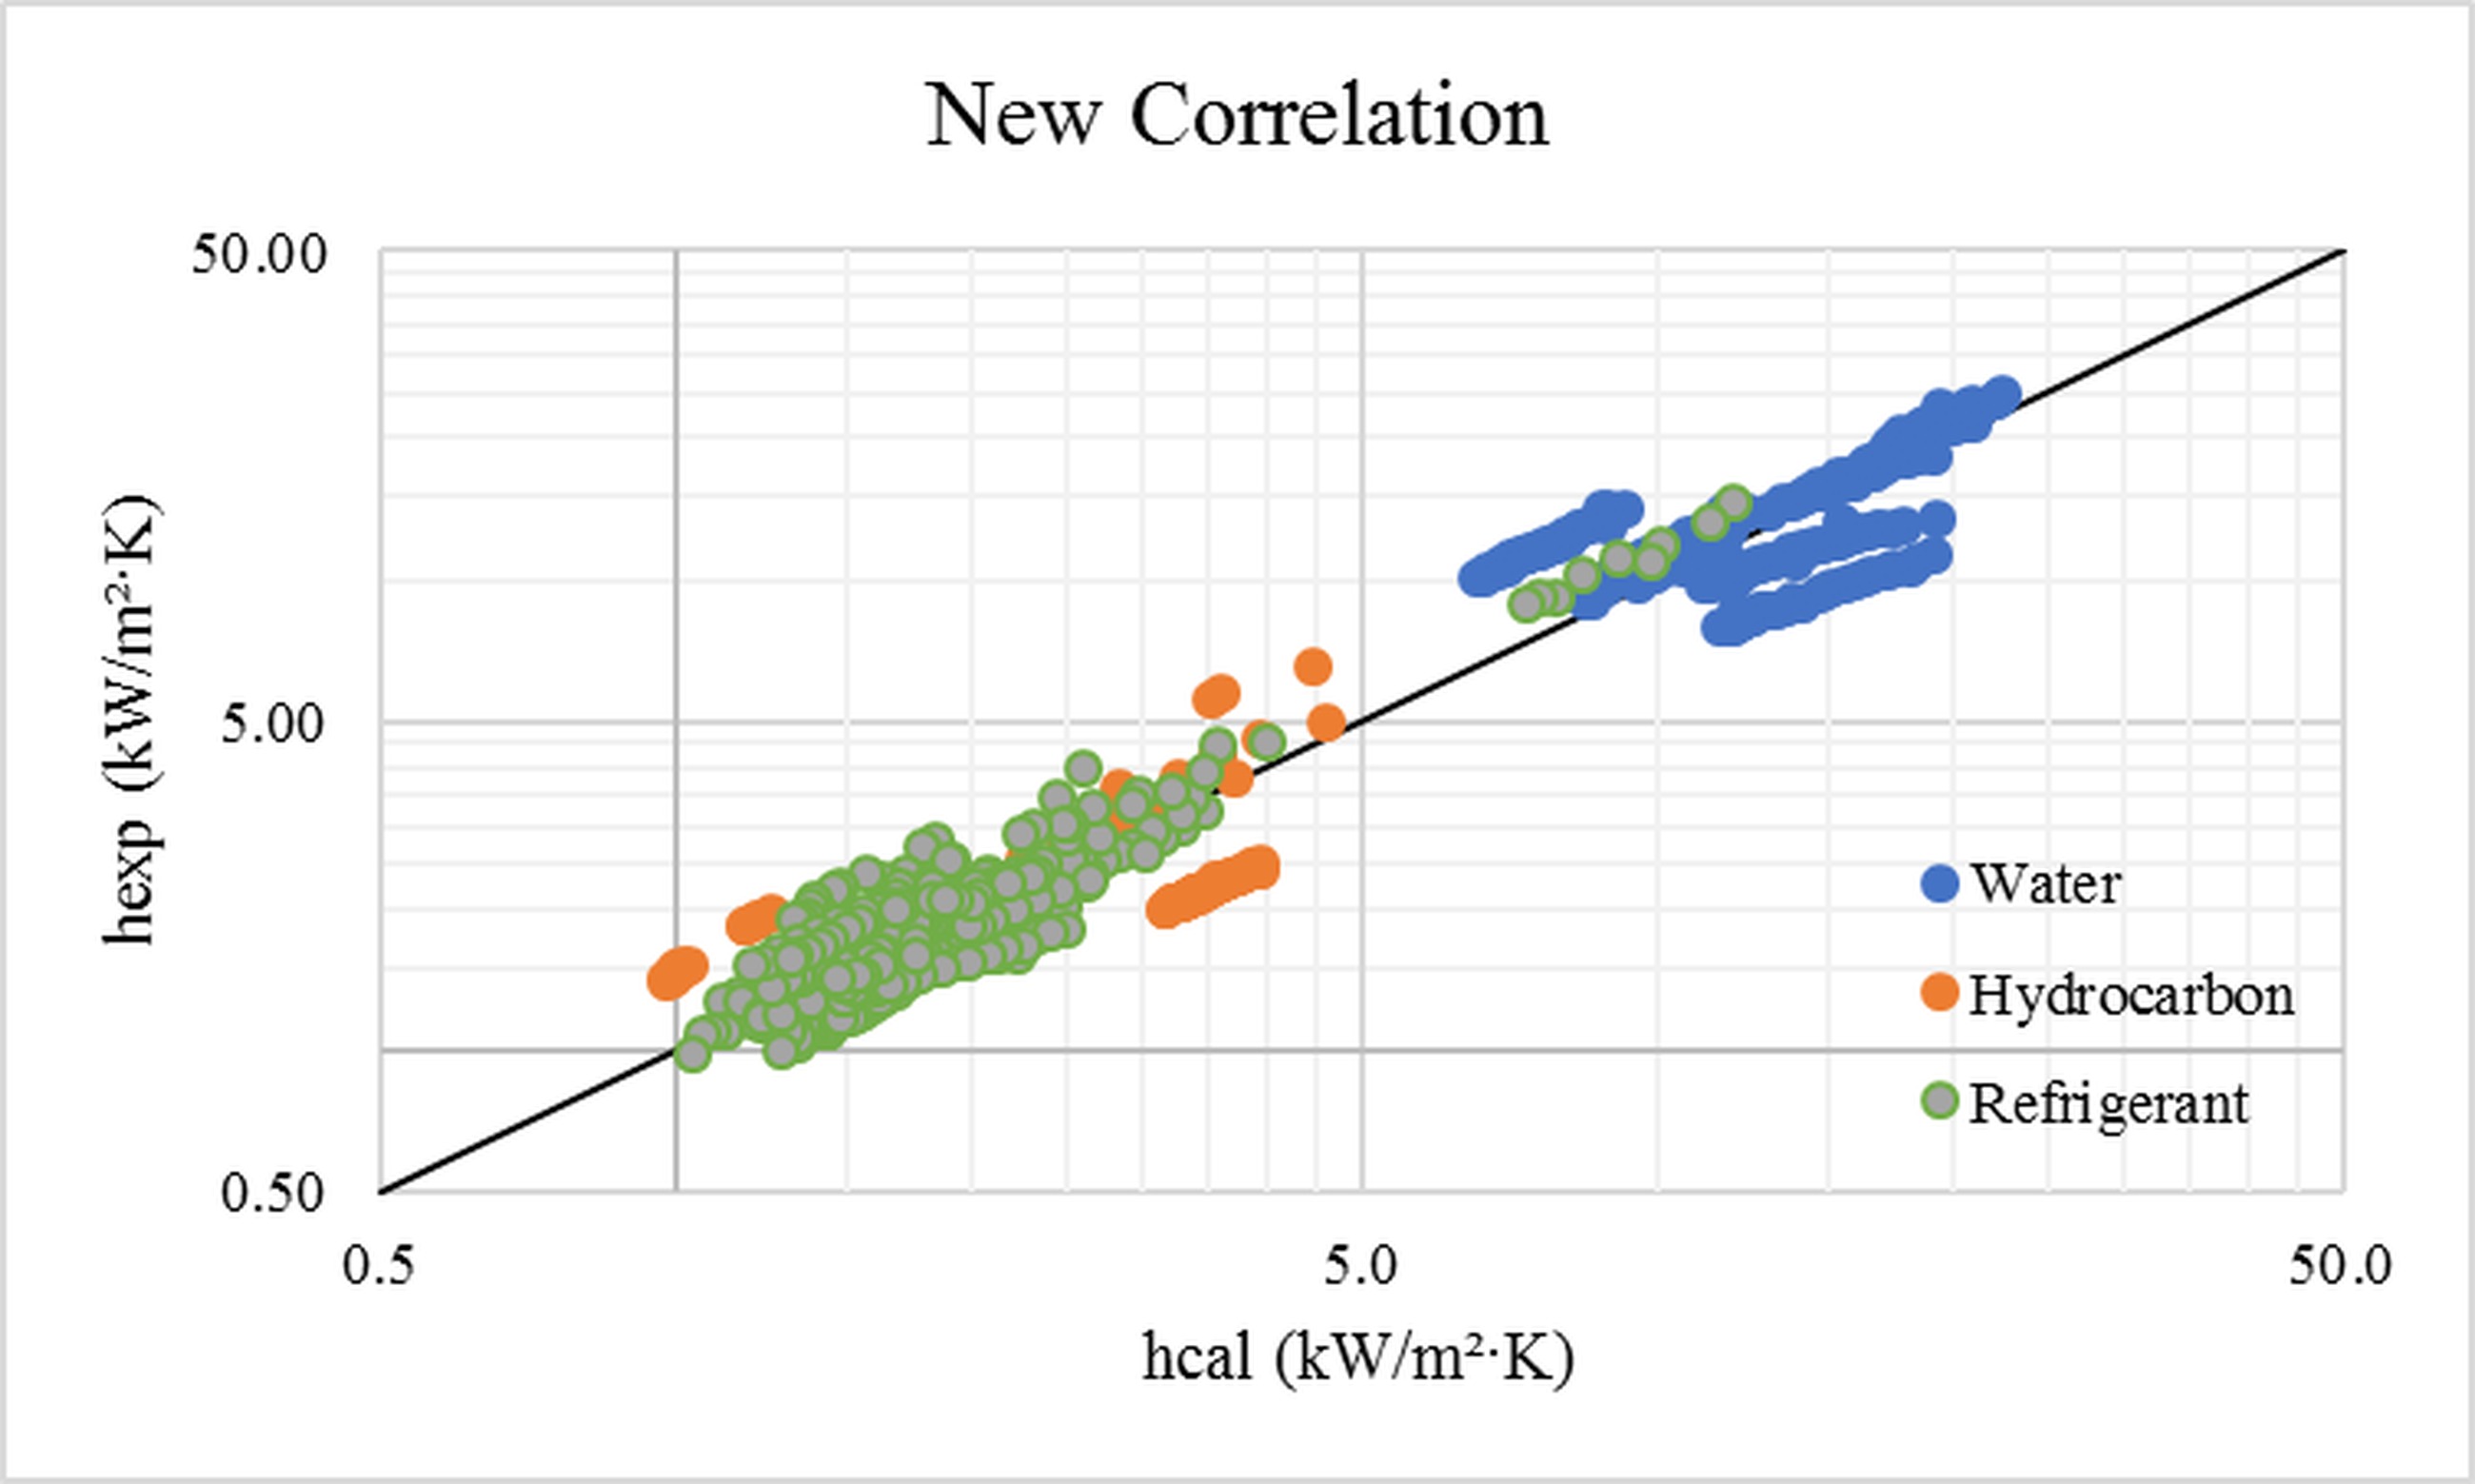
The Fig. 3 presents the evaluation of the new correlation, highlighting a concentration of data points around the median line, with predicted values closely matching the experimental values. A correlation coefficient of r = 0.96 and an average error of 14.66% are obtained. The new correlation proves to be as effective as those of Nusselt (1), Bromley (3), or Sadasivan and Lienhard (7).
Conclusion
Ten well-established correlations have been extracted from the literature and systematically listed in Tab.1. A comprehensive dataset consisting of over 1000 experimental data points from 38 publications has been compiled, which is also presented in Tab.1.
Comparisons between the predicted values of each of the ten correlations and the experimental data were conducted and visually illustrated in Figure 1. A statistical analysis, detailed in Tab.2, enabled the identification of the most reliable correlations.
The correlations by Nusselt (1), Bromley (3), Sparrow and Gregg (5), and Sadasivan and Lienhard (7) demonstrated very satisfactory results, with errors on the order of 14%. In contrast, the correlations by White (2) and Fujii et al. (6) yielded more moderate results, with errors ranging between 17% and 18%. The correlations by Rohsenow (4) and Hashimoto and Kaminaga (10) exhibited significant errors, exceeding 30%, while those by Kumar et al. (8) and Schnabel and Palen (9) showed very high errors, surpassing 60%.
A new semi-empirical correlation (17) has been proposed, which provides very satisfactory results with a mean error of approximately 14% and a high correlation coefficient of 0.96. The newly developed correlation incorporates a refined functional dependence on the Jacob number, enhancing its predictive accuracy across diverse working fluids. This modification yields superior conformity with experimental observations, thereby underscoring the model’s robustness and its potential applicability as a reliable predictive framework for condensation heat transfer in engineering systems. Future work could further refine this model by incorporating additional factors such as the effects of surface material or mixed-mode condensation, which would increase its applicability to broader industrial scenarios, including condenser design and thermal system simulation tools. Moreover, the new correlation could be integrated into computational fluid dynamics (CFD) models to improve their predictive accuracy for practical applications.