
INTRODUCTION
3D fabrication is a growing field of science and industry and is finding more and more applications, especially in the context of medicine and aeronautics. However, as many studies have shown, it is important to ensure the quality of the products often even at the expense of additional labor time and increased costs. This article proposes a relatively inexpensive processing solution consisting of a combination of precipitation hardening and shot peening (SP). Using these processes separately makes it possible to control the roughness parameters, mechanical properties and corrosion resistance of the steel components. This makes it possible to quickly produce particularly cost-effective low-volume parts from material with high mechanical properties, with the possibility of selecting the appropriate mechanical parameters, roughness and corrosion resistance. However, according to the authors' knowledge, none of the current literature studies investigates the combination of shot peening and heat treatment of additively manufactured 17-4PH steel on corrosion resistance.
Additive manufacturing (AM) with Direct Metal Laser Sintering (DMLS) technology consists of successive sintering of successive thin layers of powder from a bed using a laser. This layer has the shape of a cross-section obtained from a CAD model. The use of DMLS makes it possible to obtain products with relatively high dimensional shape accuracy. In addition, DMLS achieves high strength and repeatability compared to other additive methods [1]. Steel 17-4PH (AISI630), is a material with high mechanical strength and can be classified as austenitic steel [2], semi-austenitic [3] or martensitic [4]. The phase composition depends on the treatment the steel grade is intended for, i.e. precipitation hardening, and thus, the phase composition can be modified with appropriate heat treatment [5]. The phase composition, combined with the formation of precipitates at different temperatures and times of precipitation hardening and ageing processes, determines the mechanical properties. The most commonly used treatments are those described in the ASTM standards for finished products from this steel grade, corresponding to classifications H900 to H1150M [6]. The requirements for the precipitation hardening process described above are designed for steels produced by conventional methods, although they are also employed for AM steels. However, based on previous research, more favorable processing conditions have been selected to protect the surface layer [7]. The next stage was the selection of the medium and the parameters of the SP process, which further increased the hardness and improved some of the parameters of the processed material [8]. Those multiple process parameters involved in SP have a complex and interdependent impact on the SP effects, including surface roughness and compressive residual stress distribution [9]. Finally, this paper focuses on the synergistic effect of these treatments.
In a previous study [7], under the same conditions, the following proportions of α-martensite 23% and γ-austenite 77% were obtained for the AP specimen, thus corresponding to the RD heat treatment. Specimen ST1040, corresponding in this case to the RD specimen, contained α-martensite 49% and y-austenite 51 %, while specimen PH450, corresponding to the PHD specimen, was characterised by an α-martensite content of 46% γ-austenite 54%.
Improving corrosion properties is a problem of great interest, especially in medical applications [10]. Corrosion resistance is largely a synergy of the three components of phase composition of surface roughness and grain size [11]. As studies have also shown, the induction of residual stresses in the surface area as occurs during SP may also have a positive [12] or negative [13] effect on corrosion resistance depending upon whether the stresses are compressive or tensile.
One of the most frequently studied parameters characterising surfaces are roughness parameters [12,13]. It is also worth mentioning here that important, but not usual, surface features are structure defects, e.g. those created in the AM process or during further processing. Such defects reduce the cohesion of the structure, which may be associated with impaired resistance to fatigue and corrosion processes in the case of 17-4PH steel [14,15]. Yu investigated the corrosion resistance of 17-4PH steel after laser surface melting in a 3.5% NaCl environment. In that study, the corrosion failure model of 17-4PH material in NaCl environment was presented, and a significant effect of grain size and stress on the corrosion resistance of steel was found [16].
The aim of this study is to evaluate the effect of precipitation hardening combined with SP on the corrosion resistance of 17-4PH steel. Results obtained for steel produced using DMLS technology were compared with conventionally fabricated 17-4PH steel. After a previous literature analysis, it was found that there is no detailed comparison of the effect of heat treatment and SP on the corrosion resistance of 17-4PH steel in a 3.5 % NaCl solution environment. This type of material, due to its proven non-cytotoxicity and the aforementioned high mechanical properties, has great potential for use on medical instrumentation. But it is not only the comparison between conventional and DMLS steels that can contribute to the knowledge base, e.g. for rapid prototyping and small batch production, which has lower costs compared to conventional manufacturing and machining methods, such as turning or grinding. This also allows greater freedom with regard to the shape of the component to be produced [17]. Further novelty is the use of SP after the precipitation hardening process for 17-4PH steels, where, as far as the authors' knowledge goes, there are even descriptions of the SP process after ageing [7]. There are no descriptions in the literature so far of the effects of combining the two processes i.e. heat treatment and shot peening of 17-4PH additive manufactured steel.
Material and Methods
. Material
The test object was X5CrNiCuNb16-4 (17-4PH) steel samples both conventional and additively manufactured (DMLS). The specimens of 17-4PH steel were in the shape of disks with dimensions of 30 mm in diameter and height of 6 mm. The first part was conventional, and the second part was printed from GP1 metal powder produced by EOS. The particles of the powder used are mainly spherical in shape and had an average size of 10-50 μm. Nitrogen was used as a shielding gas for fabrication. The 3D metal printing process was carried out through DMLS technology. The EOSINT M280 device (from EOS GmbH) was used, using the optimal printing parameters from the closed license of EOS software, including the laser power of 200 W, the laser spot size of 0.1 mm, and the sinter thickness of 0.02 mm. Scanning speed was 1000 mm/s, and hatch spacing at 0.1 mm. A parallel scanning strategy with alternate scanning direction was adopted, and for subsequent layers the scanning direction was rotated by 90° relative to the previous layer. The fabricated specimens were built horizontally orientated. Once the samples were obtained, their surface was prepared by abrading on papers of decreasing gradation. The processes listed below in in Table 1 were then applied. At the same time, however, it should be noted that precipitation hardening was applied first and the next step was peening of the prepared and cleaned surface. Cooling after the solution treatment process was carried out in oil, while after the aging process, the cooling was carried out in air.
Tab. 1.
Post-manufacture heat treatment and shot peening conditions
It should also be noted that only the top surface of the specimens was treated by SP. Three different peening media was used, namely glass, steel and ceramic. Glass beads (Marbad) with a diameter of 200-300μm, steel shots (Amacast 30) with a diameter of 150-500μm and Ceramic (Marbad, CERAM 350) (250-425 μm). Distance from the nozzle was constant at 20 mm.
. Methods
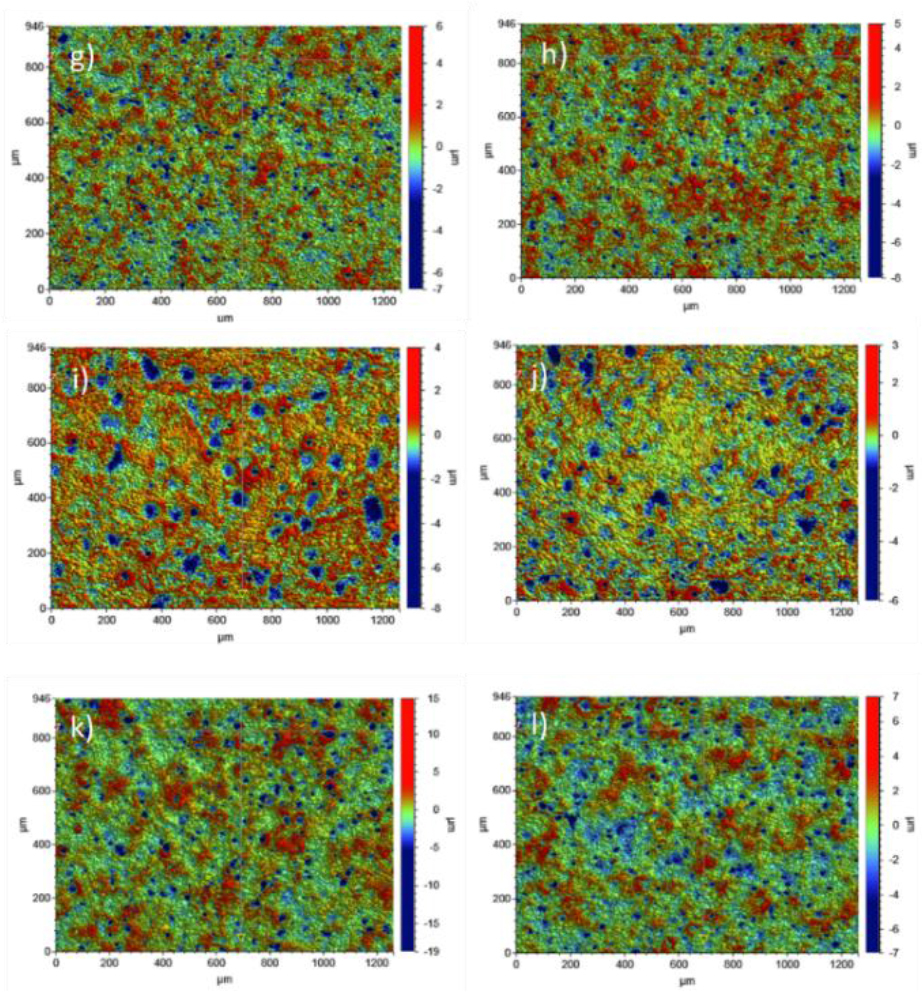
The chemical composition was tested using with a Magellan Q8 spark emission spectrometer from Bruker (Billerica, MA, USA). Five spark burns were performed for each specimen to calculate average values. Roughness parameters were calculated thru optical profilometry on Contour Countour GT-K1 (Veeco, USA) based on the VXI technique with the 5× magnification lens. Surface microgeometry maps were examined in the area of 1,26 mm × 0.946 mm. Obtained arithmetic mean deviation (Ra), root mean square deviation (Rq), maximum peak to valley (Rt) parameters from the maps were then tabularised and mean value was calculated. For each specimen, 8 measurements were taken. Measurements were taken according to ISO 4287 standard recommendations.
Hardness tests were carried out on a Future-Tech FM-800 microhardness tester at a load of 1,961 N and a dwell time of 15 s. Ten indentations were made for each sample on the top surface.
The structural characteristics of the surface were identified using a Phenom World ProX SEM microscope. In addition, an EDS attachment was also used to determine the surface's composition after shot peening. Above this, surface images were also taken in topographic mode at 1000x magnification.
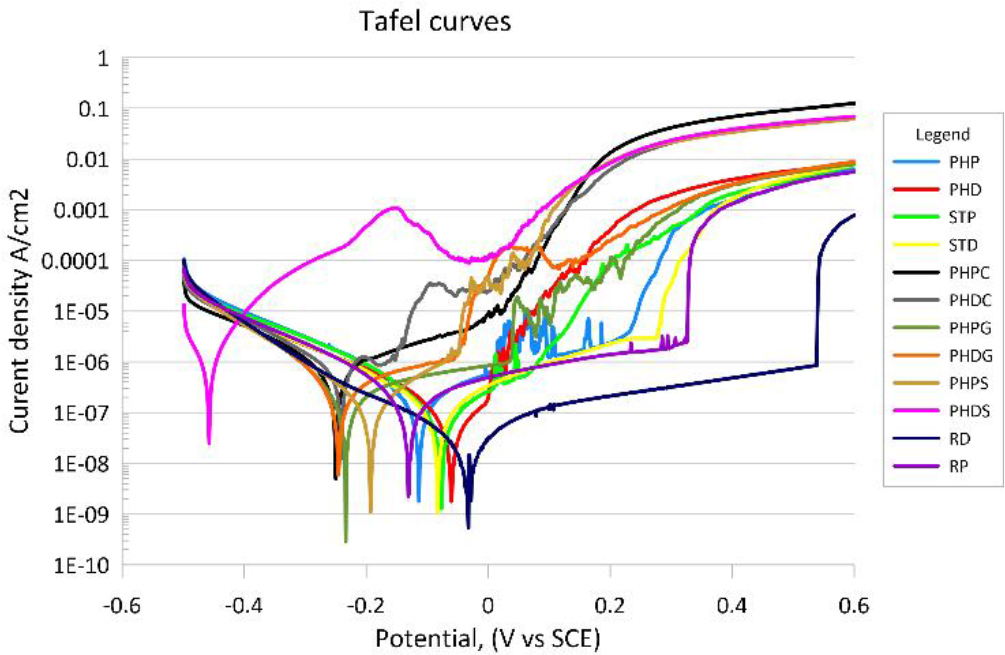
Electrochemical tests were carried out on an ATLAS 0531 potentiostat system in a 3.5% NaCl solution at 22°C. A three-electrode electrochemical tank was used; the test area was 0.5 cm2. The control electrode was a platinum electrode, the saturated calomel electrode (SCE) was the reference electrode. Polarisation curves were recorded with an automatic potential shift of 1 mV/s between -500 mV and +600 mV. Corrosion current density Icorr and corrosion potential Ecorr were determined from Tafel curves by analysing potentiodynamic curves in AtlasLab from -25 mV to +25 mV. The corrosion rate was calculated based on ASTM G 102-89 according to the formulas 1 and 2 given below.
where: K – 3,27*10-3[mm*g*μA-1*cm-1*rok-1], icorr – corrosion current density [μA*cm-2], ρ – alloy density [g*cm-3], EW – equivalent weight, ni – valence of the i-th element in the alloy,fi – mass fraction of the i-th element in the alloy, Mi – atomic mass of the i-th element in the alloy [g*mol-1]
RESULTS
. Chemical composition
The chemical composition did not differ from that declared by the manufacturer and was in accordance with the requirements presented in ASTM and ISO standards. It is also in line with previous results as well as other relevant literature [18,19].
Tab. 2.
Chemical composition of reference 17-4PH after DMLS fabrication
. SEM-EDS Analysis
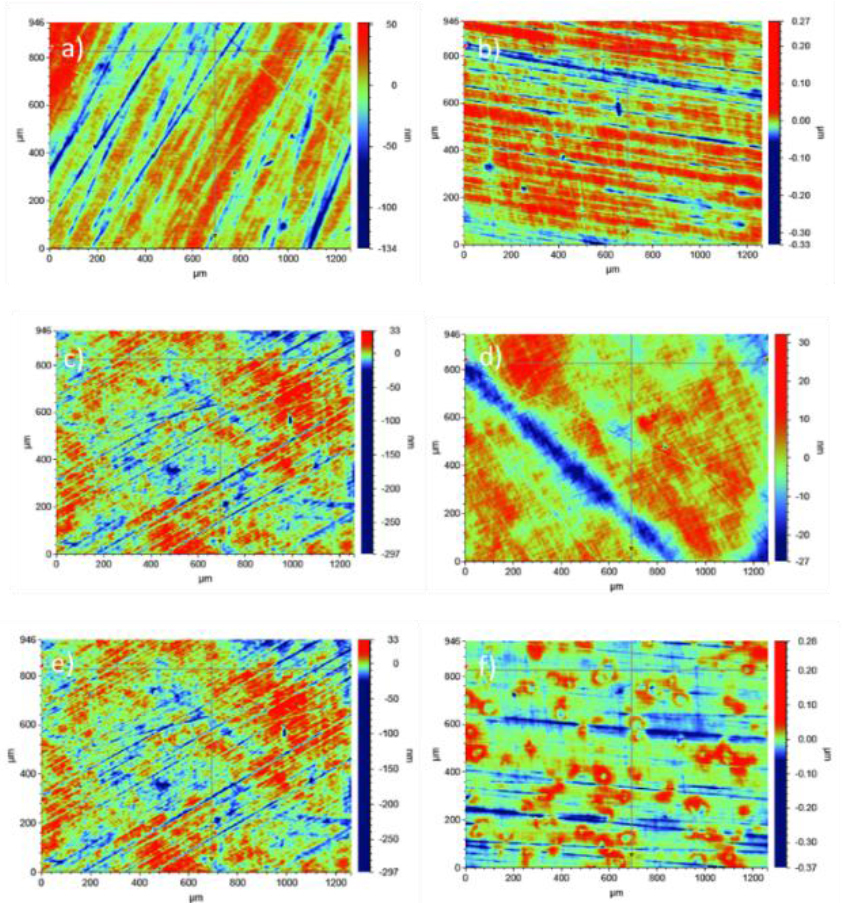
Surface of analysed referenced material showed visible grooves after grinding process (see Fig. 1 a, b). As can be seen in the Fig. 1 and Fig. 2, differences were evident between the groups depending on the pressing medium used. The PHPG and PHDG samples were characterised by visible grooves originating from fragmentation of the medium.
Fig. 1.
a) RP topographic mode, b) RD c) PHPG, d) PHDG, e) PHPS, f) PHDS topographic mode - SEM micrographs
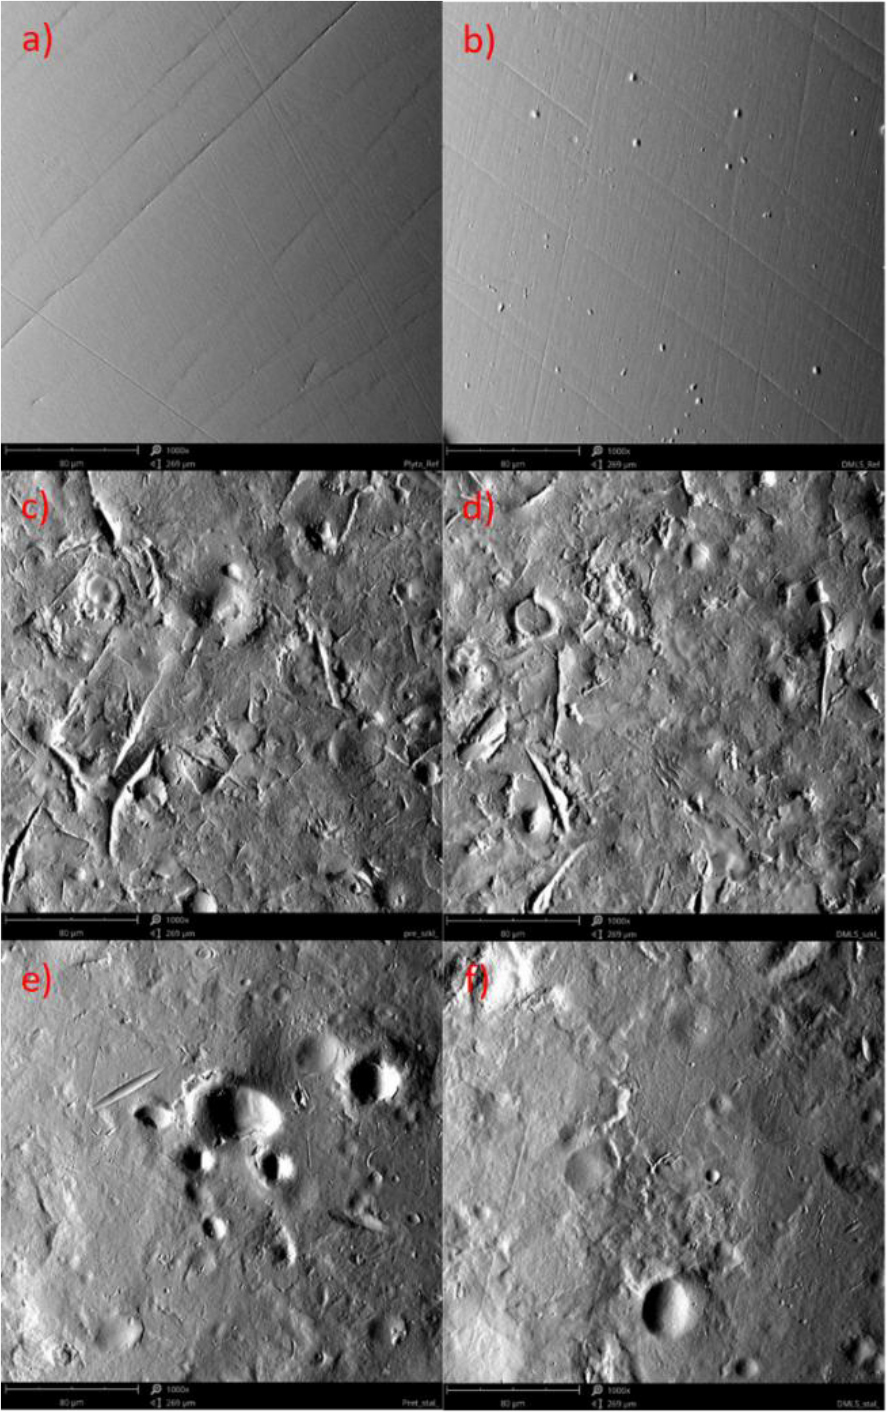
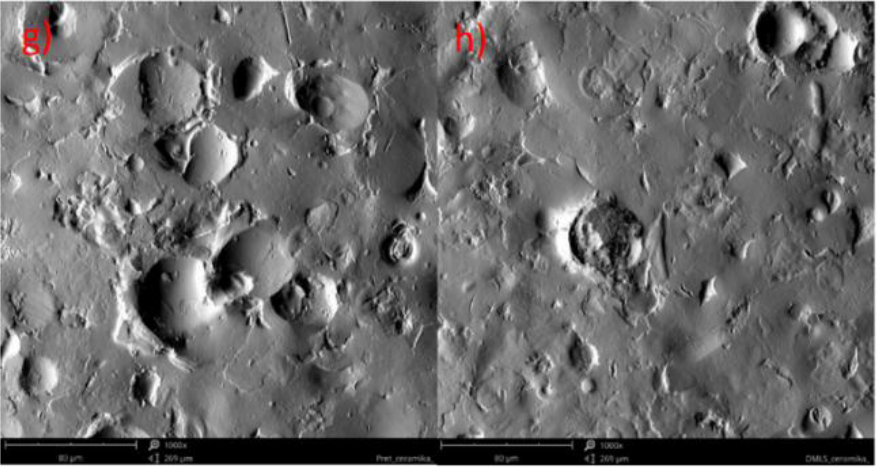
The next group, PHPS and PHDS samples, are characterised by a smoother surface with visible, in places oval-shaped craters resulting from the impact of the spherical medium. This is also visible in the first group, but to a lesser extent. However, the greatest number of spherical craters are visible in the last group, the ceramic-impacted spherical craters (PHPC and PHDC). SEM-EDS analysis showed the presence of SP medium particles stuck on the surface of the tested materials. The presence of both glass and ceramic ball particles was verified. The presence of steel beads has not been detected using the EDS method due to the similar composition. Comparable results are reported in the previous authors papers [20] related to the shot peening of the different types of stainless steels.
. Hardness
The analysis of the hardness plots given in fig. 3 indicates that precipitation hardening process increased surface hardness for the DMLS-produced 17-4PH steel of approximately 53% from 255 HV0.2 for the reference material to 389 HV0.2. Equally significant improvements were observed for the conventional 17-4PH steel (40%) from 322 HV0.2 for the reference material to 421 HV0.2. Precipitation hardening combined with shot peening with glass contributed to the same increase in surface hardness in both cases (596 HV0.2) corresponding to increases of 85% (PHPG) and 134% (PHDG), respectively, compared to the reference material. The use of precipitation hardening combined with steel peening increased the hardness of the conventional material by 65% and that of 174PH DMLS steel by 92%, while ceramic peening contributed to increases in surface hardness of 64% (PHPC) and 136% (PHDC).
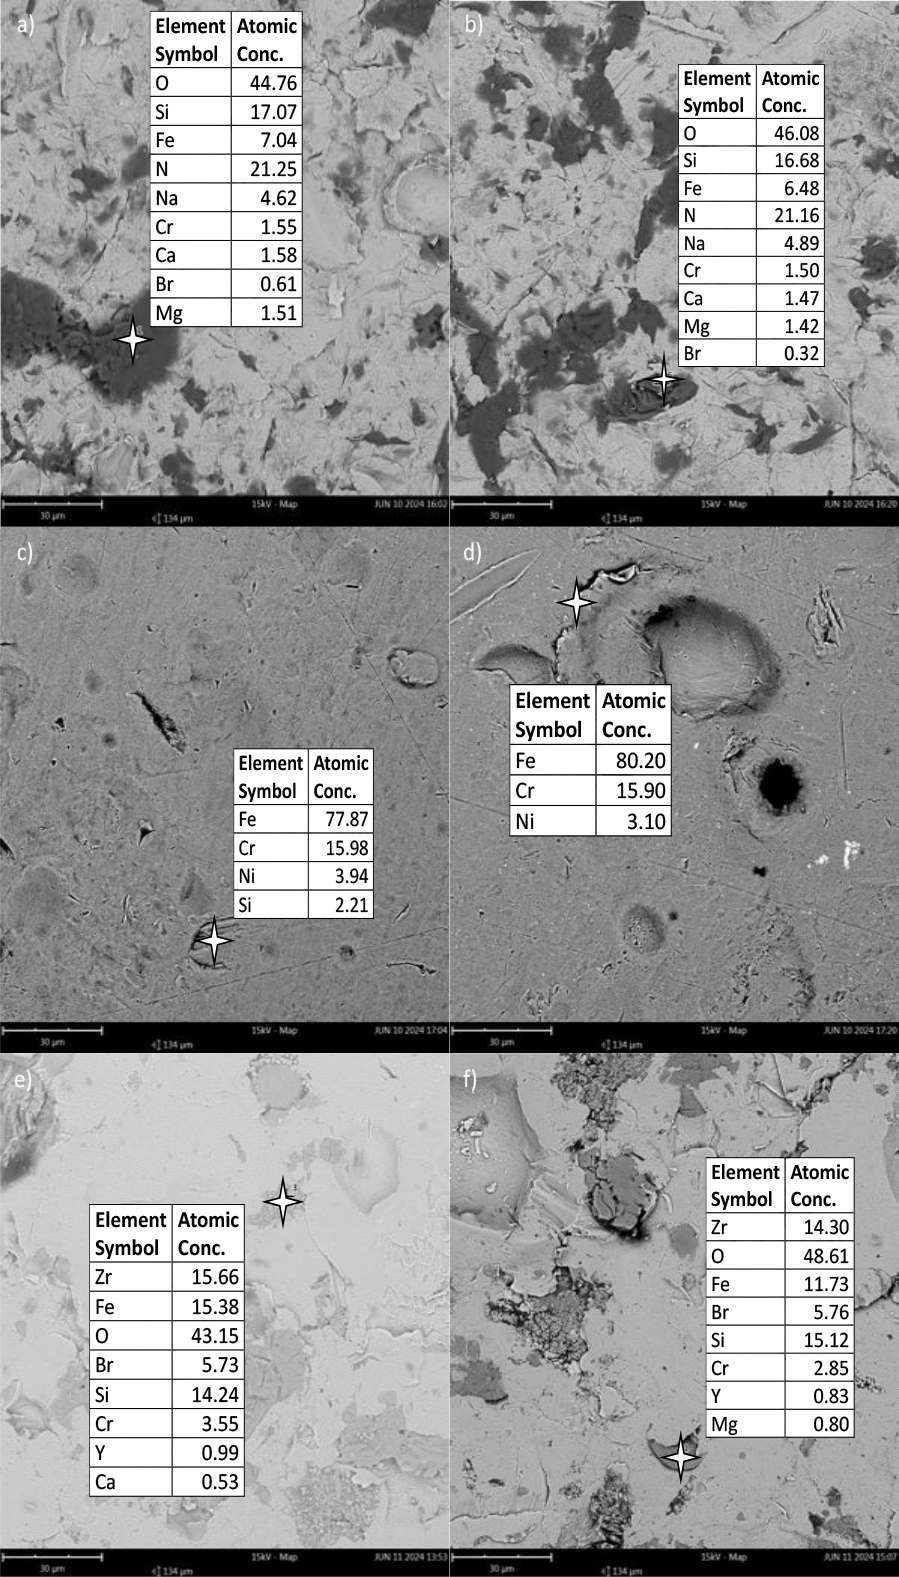
In summary, the greatest increase in surface hardness was obtained for the material after additive manufacturing subjected to precipitation hardening and ceramic bead peening from 255 HV0.2 to 599 HV0.2. After supersaturation, the hardness decreased for the conventional material, while it increased for the DMLS material, a fact that underlines the importance of research in this area. However, these results obtained are in line with other studies in this area for both 17-4PH conventional steel [21] and AM steel [22,23]. The greatest increase in hardness may have also been due to the size of the ceramic particles and their hardness because, at constant pressure and the highest density, theoretically, it is the steel shot that should provide the greatest energy during impact on the surface significantly increasing hardness through deformation and the introduction of favourable compressive residual stress (CRS) [24].
. Roughness
The surface roughness increased significantly in all cases of surface peening analysed (Fig. 5-7). The smallest increase in roughness Ra was observed in the case of surface peening with steel beads. This can be explained by the higher ductility of steel compared to ceramic materials, including glass beads. By changing part of the energy into plastic deformation of the steel pellets, part of the energy that should deform the peened surface is lost.
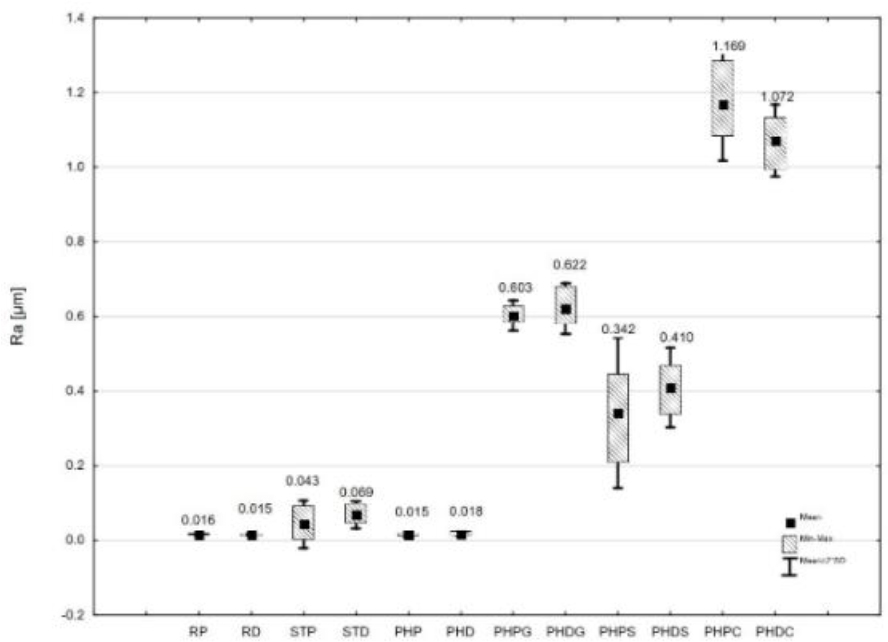
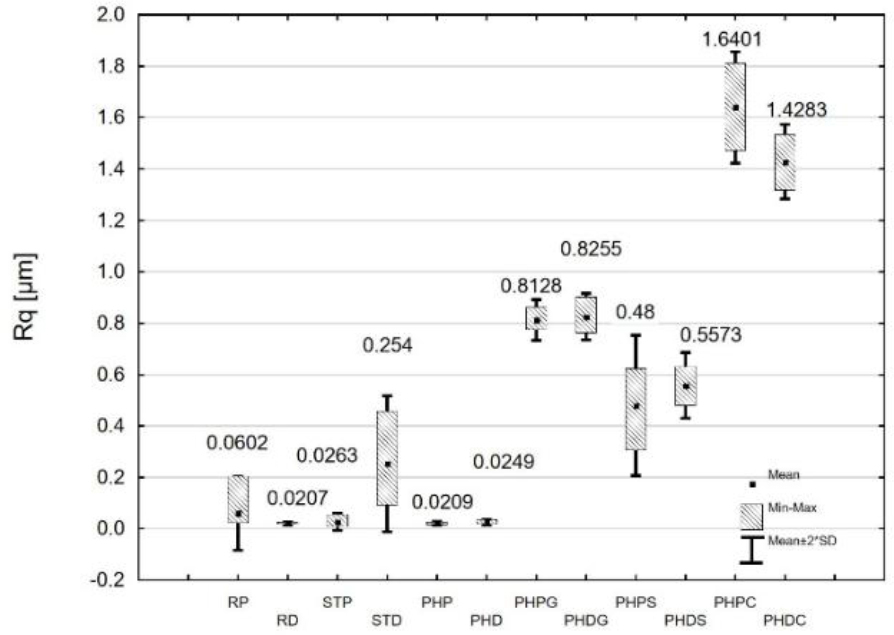
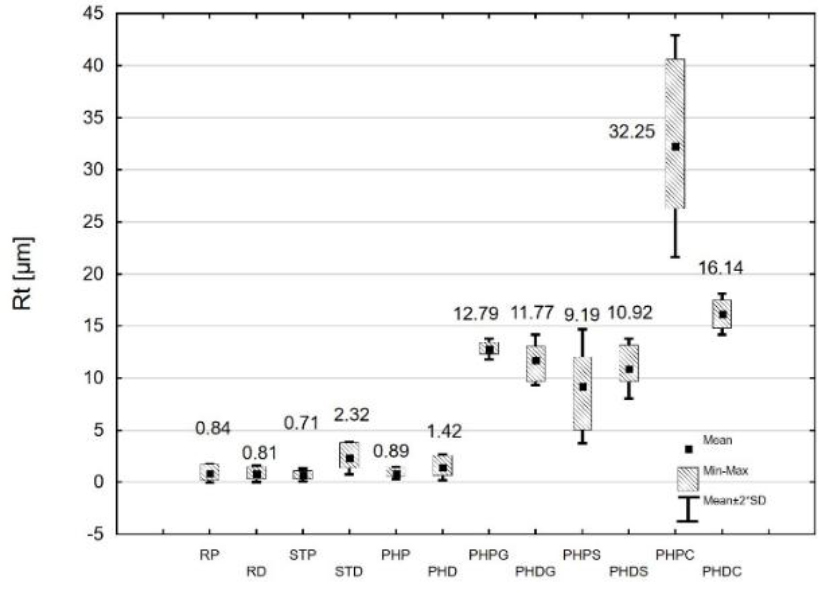
This phenomenon may also explain the lower increase in hardness after peening compared to other materials. Most studies suggest that the bead material does not deform significantly. However, this is possible if only because of the high hardness of the shot peened substrate (389 HV0.2, 421 HV0.2) and the low hardness of the steel shots of 200 HV.
Significantly lower roughness was achieved when compared to 17-4PH DMLS steel without preparation by grinding that achieved Ra 4.5-5.5 μm, Rq 5.8-7 μm, Rt 22-28 μm some differences can be noted [8]. Similar condition Ra 5.04±0.56 μm for reference material, for SP with steel shots Ra 5.71±0.26 μm and 4.39±1.43 μm for ceramic is described in [25].
. Corrosion resistance
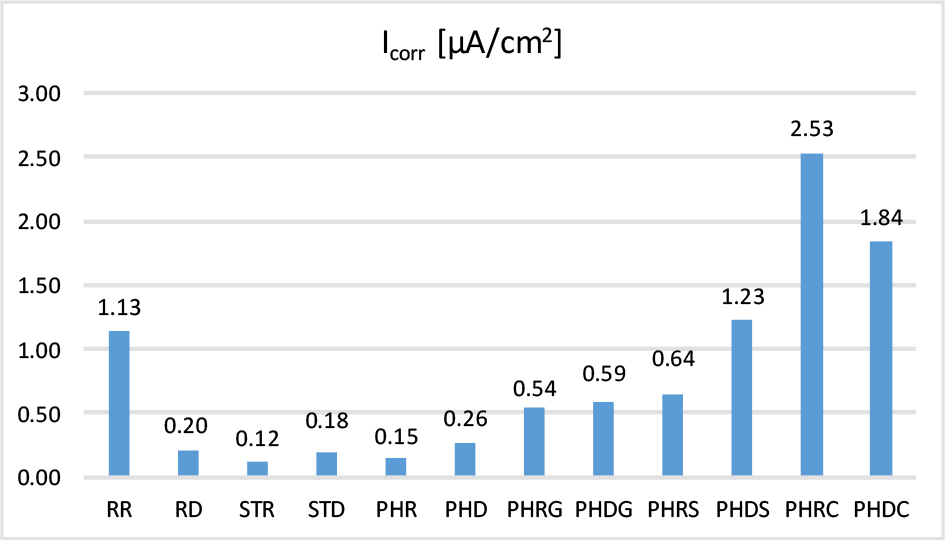
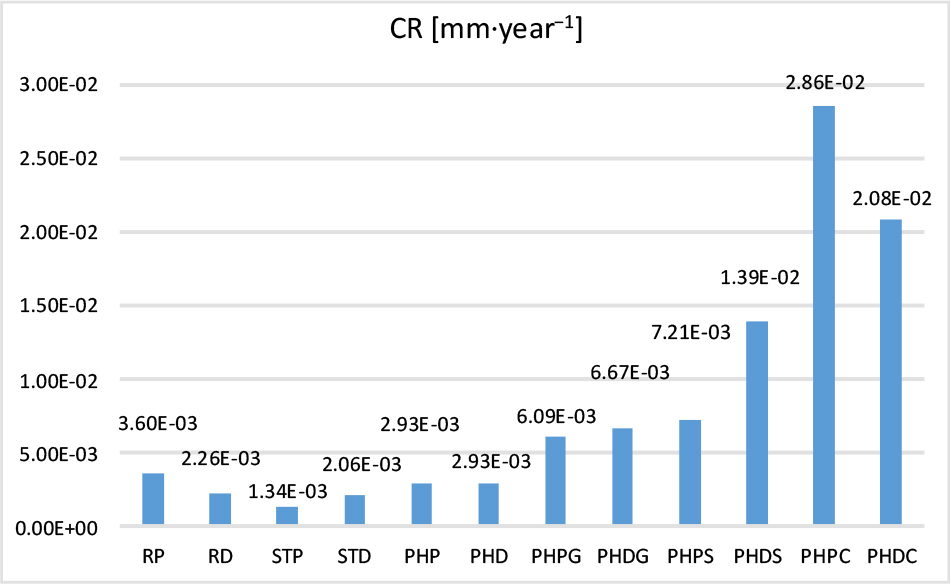
As previously noted, corrosion resistance in this case study results from the three main factors of grain size, chemical and phase composition and development, and, therefore, surface roughness. A link was noted between roughness and corrosion current density, which can be identified as a decisive parameter giving information on corrosion resistance. In the analysed case, the best coefficient for assessing corrosion resistance is CR (see Fig. 14) directly related to Icorr (Corrosion current density). In the case of the RP to PHD specimens, disregarding the STD with obtained a low roughness after surface grinding. However, the STD sample deviates slightly, and this translates into a significantly worse corrosion resistance. In the case of the RP sample, the influence of the microstructure is mainly visible, compared to the rest of the samples it is a material that has not been heat treated or mechanically processed.
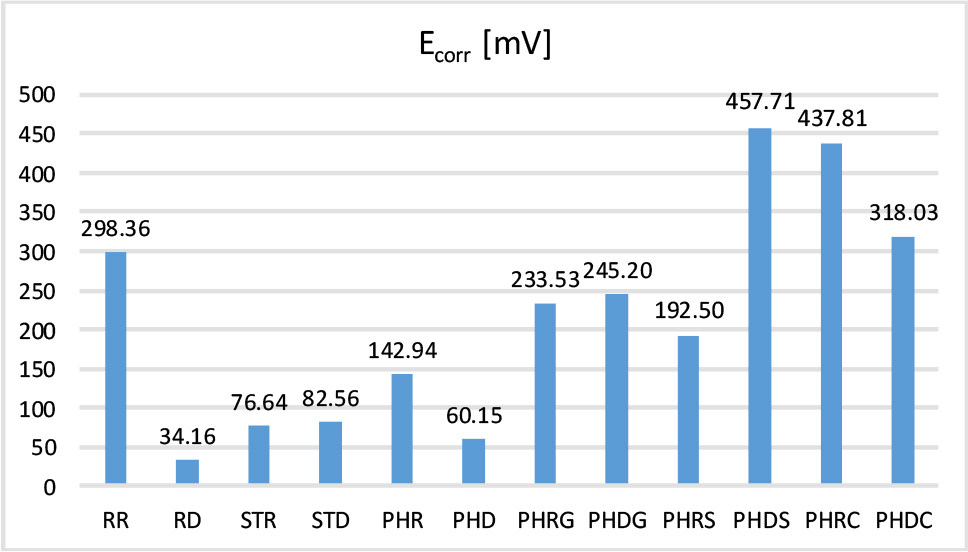
In addition, it differs from the DMLS-made material in terms of its thermal history, as compared to the DMLS reference material it was only heated once while the RD went through a cycle of remelting and sintering successive layers while heating the material around it. The corrosion resistance of the glass-peened materials (PHRG and PHDG) is also related to the roughness. An increase in roughness resulted in a decrease in corrosion resistance in this group and a slight difference between the PHRG and PHDG samples tested was also evident in the Icorr parameter (see Fig. 11). Its increase led to a decrease in corrosion resistance in this group and a slight difference between the PHRG and PHDG samples tested was also seen in the Icorr parameter. The situation is similar for the next group of steel specimens, but in this case, the effect of the medium on the corrosion resistance is also shown by the present and previous studies and the model proposed by Kameyama and Komotori [26]. While the presence of steel particles located on the surface is sometimes difficult to confirm using, for example, EDS, the presence of glass and ceramic particles is easy to verify. Again, however, the difference between PHRS and PHDS is apparent due to the small difference in roughness. Reference specimen made using DMLS was characterised by smallest Ecorr on the other hand the highest Ecorr was observed for PHDS. As can be seen corrosion potential seam to generally lower after treatment for conventional material and increase for DMSL (see Fig. 12). Discontinuities or irregularities in the surface resulting from SP indentations cause local variations in surface morphology and roughness.Differences in the Ecorr can be correlated to spots where corrosion attack start to create usually in the top of SP inducted dents [27].
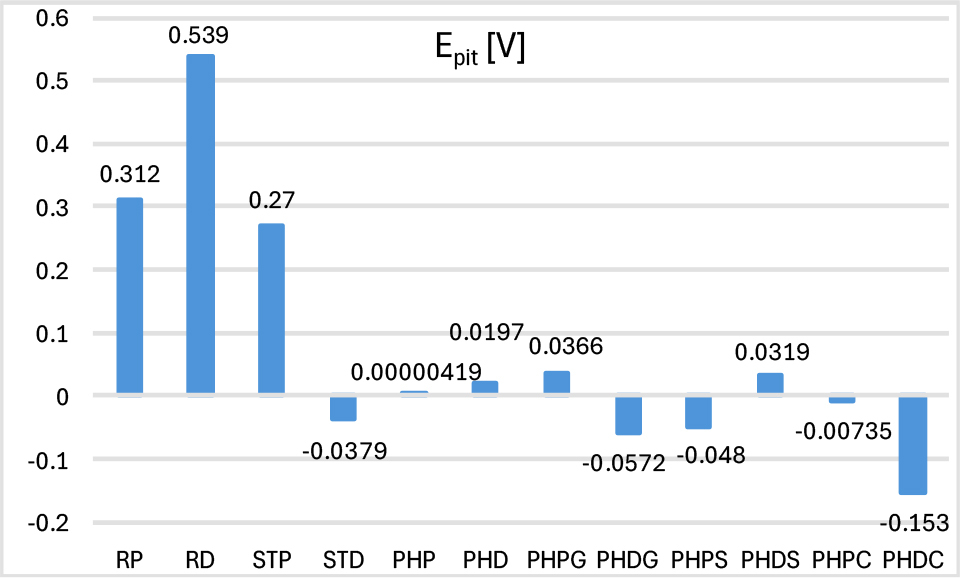
An important parameter in the context of corrosion protection is Epit (see Fig. 13). The highest Epit value and at the same time the most favourable one was RD (0.539 V). The lowest Epit value and, at the same time, the material with the greatest potential for pitting corrosion was PHDC (-0.153 V). As can be seen in Fig. 13, there is a visible decrease in pitting corrosion resistance after the precipitation hardening process. However, it is not possible to clearly indicate whether conventional steel or DMLS is more resistant. In the group of materials that underwent SP, the highest Epit value was found in PHPG (0.0366 V).
CONCLUSIONS
The effect of precipitation hardening combined with SP on the corrosion resistance of 17-4PH steel have been evaluated. Results obtained for steel produced using DMLS technology were compared with conventionally fabricated 17-4PH steel. In conclusion, it was found that SP produced similar or sometimes even better results for 17-4PH DMLS steel compared to conventional material. Roughness has the greatest impact on the corrosion resistance proving that it the most significant factor influencing corrosion resistance. The highest corrosion resistance was obtained for STP (1.34*10-3). The lowest corrosion resistance was found in PHPC (2.86*10-2). Reference DMLS material (RD) has the lowest pitting corrosion potential (0.539 V). Heat treatment contributed to a greater increase in hardness for the DMLS made steel. The use of shot peening after heat treatment (precipitation hardening) appears to be effective and well-justified. The result was a significant increase in hardness for both conventional and DMLS steel from 255 HV0.2, 322 HV0.2 with increase of 40-136%. The best choice and compromise appear to be the use of glass bead peening, which achieved high hardness in both PHPG and PHDG up to around 597 HV0.2, while maintaining average roughness (Ra at around 0.6 μm) and the best corrosion resistance in the group of peened materials. However, if hardness is the most important parameter, ceramic ball shot peening is the most suitable alternative.