
INTRODUCTION
Respect for energy resource [1] is associated with the application of new energy technologies [2] that are environmentally friendly [3] and enable cooperation with renewable energy sources (RES) [4]. Organic Rankine cycle (ORC) systems [5], which can, for example, be powered by waste heat [6], fit into this idea. ORC systems can also work with air storage systems [7], nuclear power engineering systems [8], trilateral flash cycles (TFCs) [9], organic Rankine cycle–vapour compression cycle (ORC-VCC) systems [10], thermal systems [11], or direct-fired hot water boilers [12]. Hence, research is continually being carried out [13] on ORC systems [14] and their subassemblies [15, 16], including circulating pumps [17]. ORC systems use volume expanders [18, 19] and flow expanders [20, 21, 22]. Due to their design, single- or multi-stage turbines [23] are built to operate with partial admission of the working fluid [24, 25]. To improve the efficiency of turbine sets, research [26] and optimisation work are being carried out [27]. In ORC systems, both scroll [28] and vane [29] expanders are used as volume expanders.
It should be noted that working fluids [30] have a fundamental impact on the cycle’s efficiency, and in ORC systems they are also the subject of analyses and studies [31]. Similarly, expander tests aim to determine the mechanical and/or electrical performance [32]. For example, Sun et al. [33] carried out studies on an axial microturbine in an ORC system, using R1233zde fluid. The tests show that, at a rotational speed of approximately 8,000 rpm, the microturbine achieved a power output of 812 W and an efficiency of 36%. In contrast, the cycle’s maximum thermal efficiency was 2.15%.
According to a study by Kaczmarczyk et al. [34], a scroll expander powered by HFE-7100 fluid achieved an electrical output of approximately 980 W. In contrast, the expander efficiency and the cycle’s thermal efficiency were 49.3% and approximately 3%, respectively. This means that as the power of ORC systems increases, both the efficiency of the expansion units and the thermal efficiency of the cycle also increase. This is also confirmed by the study by Sun et al. [35], which was conducted on a scroll expander in an ORC system using R245fa fluid. These results show that, at a power output of approximately 1,800 W, the thermal efficiency was approximately 6.4%.
This paper presents the research findings of a prototype microturbogenerator with a rated power of 1 kW. The research was conducted on an ORC microsystem using the low-boiling medium HFE-7100, under varying heat source power levels, working medium flow rates, and microturbine generator loads. The aim of the study was to determine the effect of the microturbine generator load on the electrical power output of the ORC system, the isentropic efficiency of the microturbine, the ORC efficiency, and the Carnot efficiency. The study shows that the maximum electrical output of the ORC system, approximately 625 We, was achieved at a heat source power of 18 kWt and the highest flow rate of HFE-7100, 60 g/s. In contrast, the maximum isentropic efficiency of the microturbine, approximately 70%, was achieved at a heat source power of 14 kWt and the lowest flow rate of the working fluid, 30 g/s. It was determined that the maximum efficiency of the ORC system, approximately 4.0%, was achieved at a heat source power of 14 kWt and an HFE-7100 flow rate of 60 g/s. In contrast, a maximum Carnot efficiency of 45.7% was achieved at an HFE-7100 flow rate of 50 g/s and a heat source power of 20 kWt.
Vibration measurements showed that the microturbine operated correctly across the range of rotational speeds tested and at the preset thermal and electrical loads. It was determined that the maximum vibration velocity recorded on the microturbine casing was 0.418 mm/s, occurring at 43,200 rpm.
TEST RIG
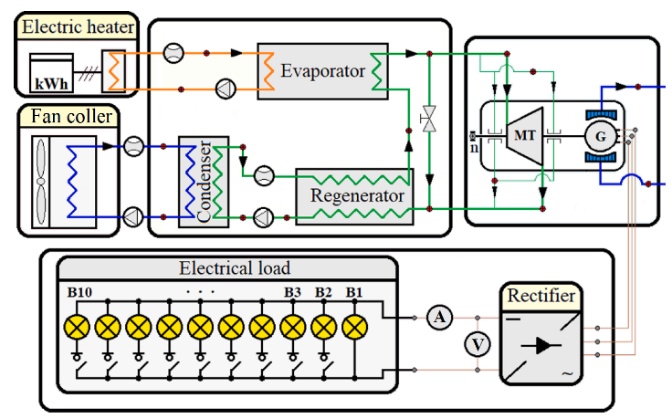
Fig. 1 shows a diagram of the test rig. The ORC system used a prototype two-module induction electric flow heater with a rated power of 2 × 24 kWe as the heat source, simulating a low-temperature heat source. The power of the heat source could be adjusted in increments of 0.1 kWe. In contrast, using a PID controller, the temperature of the thermal oil could be regulated from ambient to 400 °C in 1 °C increments. The heat carrier was Shell Thermia B thermal oil, which transferred heat to the working medium in the evaporator. The low-boiling fluid HFE-7100 was used as the working medium, and its selected properties are listed in Table 1. After being heated in the evaporator, the working medium was directed to the regenerator via a bypass and then to the condenser. Heat from the condenser was dissipated in a fan cooler with a rated power of 50 kWt, in which an ethylene glycol solution was used as the coolant.
Control of the flow rates of the working media (thermal oil, HFE-7100, and glycol solution) was realised by means of frequency converters mounted on the drives of the circulating pumps.
Tab. 1.
Properties of HFE-7100 fluid at 25 °C
After liquefaction, the HFE-7100 medium was directed into a tank and then, by means of a pump, to the regenerator and evaporator, respectively.
The working medium was circulated within the cycle until the appropriate vapour pressure was reached at the preset flow rate. Once the appropriate operating parameters had been achieved, the HFE-7100 medium was directed to the blade system of the microturbogenerator. The three-phase synchronous generator of the microturbogenerator was cooled using mains water. The generator was connected to a prototype AC/DC rectifier circuit. The load on the microturbogenerator’s generator consisted of ten DC bulbs, each rated at 200 We (Fig. 1). Load control of the generator was achieved by means of disconnectors (switches) fitted to each bulb. The minimum load required to prevent the microturbine generator from overspeeding was a single bulb.
Measuring apparatus and measurement error
A list of the measuring apparatus and sensors installed in the working medium cycle is provided in Table 2. Pressure transducers with maximum operating pressures of 16 bar and 10 bar were fitted to the microturbine inlet and outlet, respectively.
Tab. 2.
Measuring apparatus and sensors in the HFE-7100 cycle
Table 2 shows that, for a minimum heat source power of 12 kWt, the measurement uncertainty was ±3.0%, and for a maximum heat source power of 20 kWt, it was approximately ±1.8%. Based on the manufacturer’s data for the Coriolis flowmeter, the uncertainty in measuring the working medium flow rate over the range of 30–60 g/s was calculated to be ±0.5 g/s.
In contrast, the combined uncertainty of the electrical power at the output of the AC/DC converter system of the ORC system was calculated using the quadratic error propagation rule, according to the following relationship:
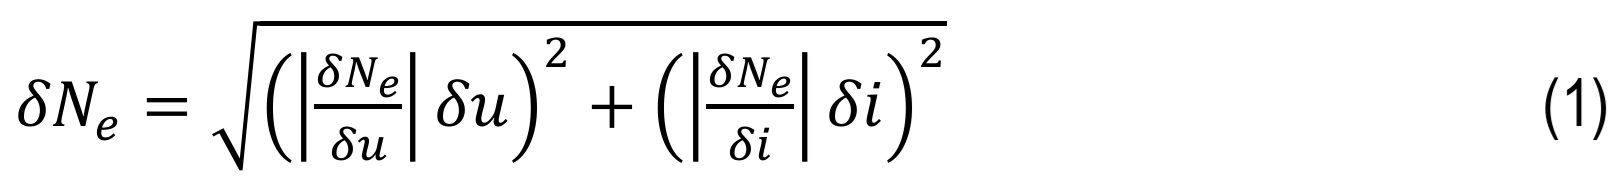
As calculated from equation (1), the uncertainty in the electrical power at the output of the ORC system was ±1.8% MV.
High-speed microturbogenerator
A photograph of the microturbogenerator, with a rated power of 1 kWe, mounted on the test rig, is shown in Fig. 2. The microturbogenerator has a hermetic design, with a single-stage axial-flow microturbine, a high-speed generator, and gas bearings—supplied with the working medium—mounted within a single casing. The microturbine and generator were mounted on a single shaft.
The three-phase 1.7 kWe permanent magnet synchronous generator used had a maximum rotational speed of 120,000 rpm. The stator of the generator was of insulation class F, with a maximum operating temperature of 155 °C. In contrast, the maximum temperature of the working medium in transient states can exceed 195 °C. Hence, the microturbogenerator design incorporates a shell-and-tube heat exchanger supplied with tap water.
In contrast, the microturbine was designed with partial admission due to the high operating pressure required in the ORC system and the low flow rate of the HFE-7100 working medium. The microturbine had a partial admission ratio of 29%. The rotor disc of the microturbine had an outer diameter of 36.2 mm and 35 blades, each with a height of 3.3 mm. In contrast, the stator of the microturbine had three blades, each with a height of 2.9 mm.
Research procedure
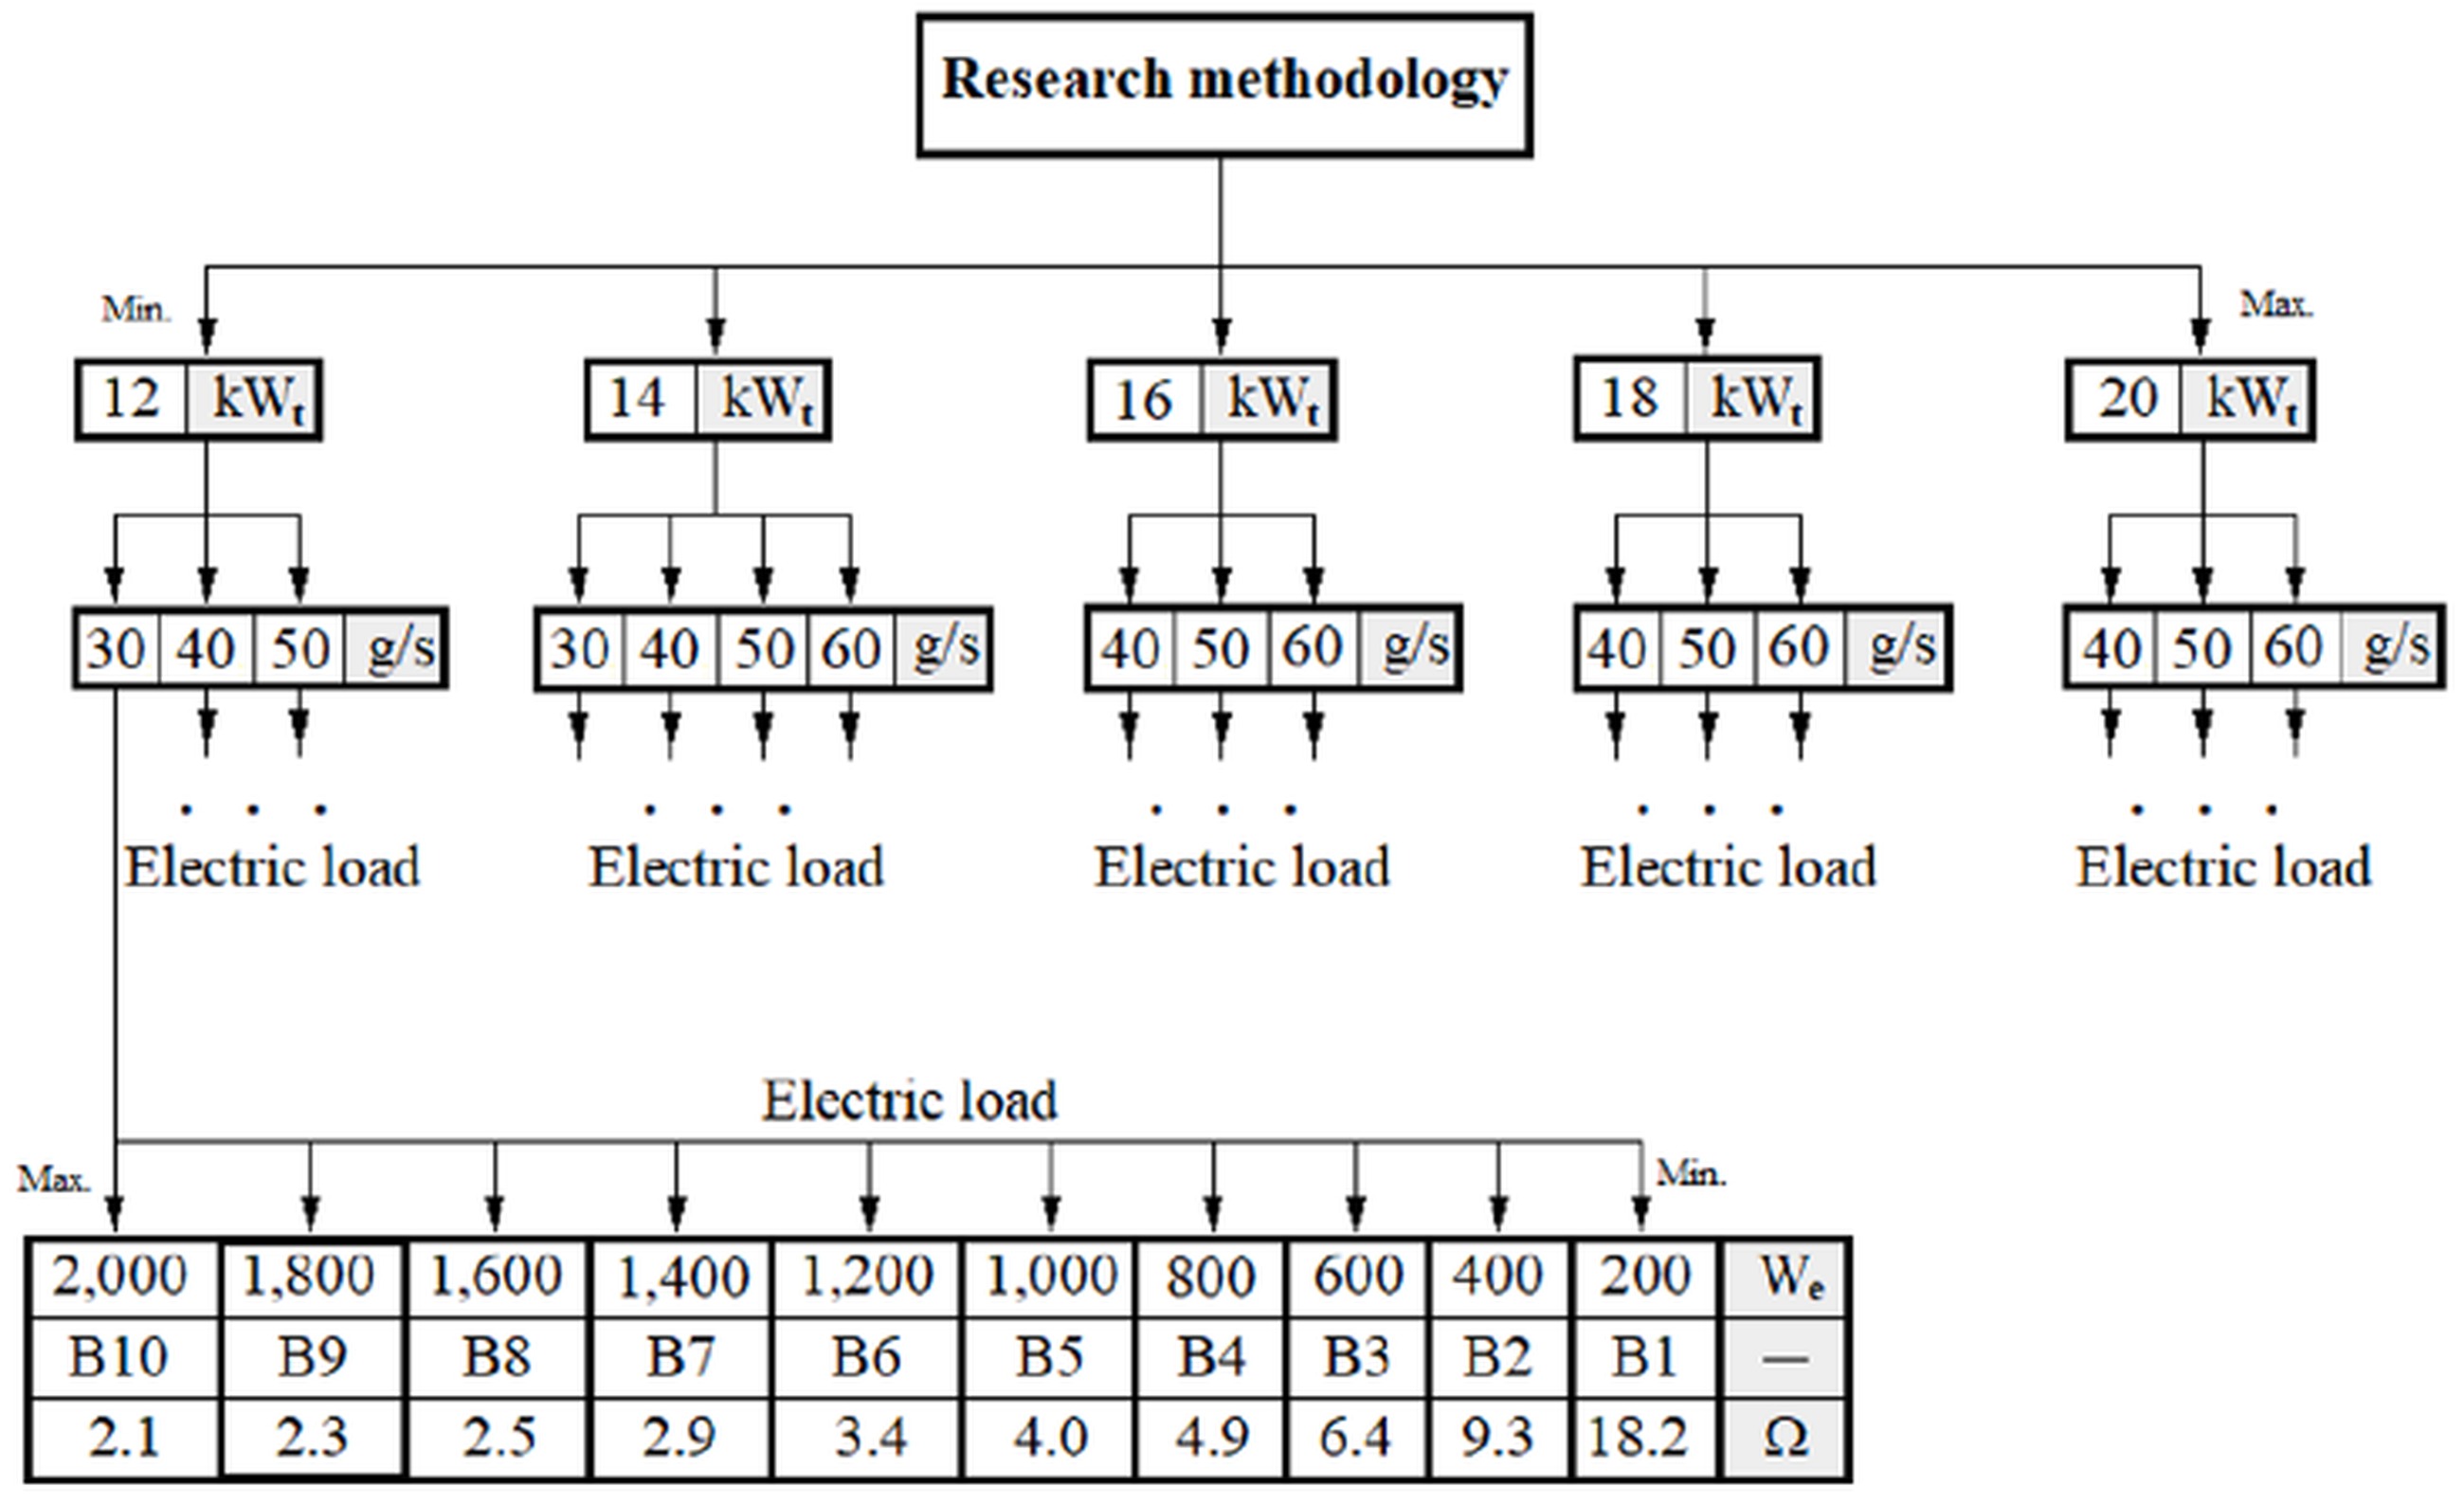
The research procedure is shown in Fig. 3. In the first stage of the work, the heat source power was set, and the thermal oil cycle was started. The required working medium flow rate was then preset, and both the working medium cycle and the cooling system (condenser heat removal system) were activated. During the heating and evaporation process, the working medium was directed through a bypass to the microturbine. The cooling system for the microturbogenerator’s generator was then started. Before start-up, the generator was connected to a load with a total rated power of 2,000 W for all electrical receivers (bulbs) (Fig. 3). Once stable operation of the ORC system had been achieved at a constant heat source power and flow rate, the HFE-7100 medium was directed to the bearing system (with the valves supplying the microturbine blade system closed), and the microturbine casing was heated.
Once the casing was heated, the blade system was supplied, while the vibration level and rotational speed of the microturbogenerator were monitored. Once it had been determined that the dynamic state of the machine and the thermodynamic parameters of the working medium were correct, the actual tests commenced. With a constant, preset heat source power level and working fluid flow rate, the generator loads were reduced in accordance with the research procedure shown in Fig. 3.
Method
The electrical power at the output of the ORC system, that is, after the AC/DC frequency converter, was calculated using the following relationship:

where: U – voltage [V]; I – current [A].
The isentropic efficiency of the microturbine was calculated using the following relationship:

where:
h1 – enthalpy of the working fluid at the microturbine inlet [J/kg],
h2 – enthalpy of the working fluid at the microturbine outlet [J/kg],
h2s – enthalpy of the working fluid at the outlet of the scroll expander under isentropic expansion [J/kg].
The Carnot efficiency was calculated using the following relationship:

where:
Tmin – minimum temperature of the working medium (after the condenser) [K],
Tmax – maximum temperature of the HFE-7100 medium (after the evaporator) [K].
The efficiency of the ORC system was calculated using the following relationship:

where:
Ne – electrical power output of the ORC system [W],
Ns – heat source power [W].
RESEARCH RESULTS AND DISCUSSION
The research results, showing the effect of generator load on the electrical power output, Carnot efficiency, isentropic efficiency of the microturbine, and the overall efficiency of the ORC system for different thermal power levels of the heat source and preset constant flow rates of the HFE-7100 working medium, are presented below. The research on the microturbogenerator was conducted for five predetermined heat source power levels (Fig. 3). For a heat source with a power of 12 kWe, the average thermal oil temperatures measured at the outlet of the electric heater, for HFE-7100 flow rates of 30 g/s, 40 g/s, and 50 g/s, were 181 °C, 181 °C, and 166 °C, respectively. In contrast, for a heat source with a power of 14 kWe, the average thermal oil temperatures for working fluid flow rates of 30 g/s, 40 g/s, 50 g/s, and 60 g/s were 197 °C, 205 °C, 197 °C, and 178 °C, respectively. When the heat source power was 16 kWe, the average thermal oil temperatures at the heater outlet for low-boiling medium flow rates of 40 g/s, 50 g/s, and 60 g/s were 193 °C, 200 °C, and 191 °C, respectively. For a heat source with a power of 18 kWe, the average thermal oil temperatures at the heater outlet for HFE-7100 flow rates of 40 g/s, 50 g/s, and 60 g/s were 221 °C, 210 °C, and 179 °C, respectively. In contrast, for a maximum power of 20 kWe, the average thermal oil temperatures measured at the outlet of the electric oil heater for HFE-7100 flow rates of 40 g/s, 50 g/s, and 60 g/s were 216 °C, 235 °C, and 231 °C, respectively.
Effect of generator load on electrical power
Example characteristics illustrating the effect of generator load on the electrical power output of the ORC system at heat source powers of 12 kWt, 16 kWt, and 20 kWt are presented in Figs. 4–6. The study shows that, irrespective of the heat source power, the electrical power output of the ORC system increased with the flow rate of the HFE-7100 medium. It was observed that, at a constant heat source power and maximum electrical output, the optimum load resistance decreased as the HFE-7100 medium flow rate increased, with the optimum load line (L) sloping to the left.
For example, for a heat source power of 12 kWt, the maximum electrical powers for working medium flow rates of 30 g/s, 40 g/s, and 50 g/s were 210 We, 335 We, and 415 We, respectively. These were obtained with load resistances (i.e. the resistances of the electrical receivers) of 4.5 Ω, 3.5 Ω, and 2.8 Ω, respectively (Table 3). In contrast, for the maximum heat source power, the maximum electrical powers were 350 We, 490 We, and 625 We, respectively, obtained at loads of 4.2 Ω, 3.3 Ω, and 2.6 Ω.
It was observed that, irrespective of the power level of the heat source, the relative increase in electrical power, ΔNe, decreased as the flow rate of the working medium increased.
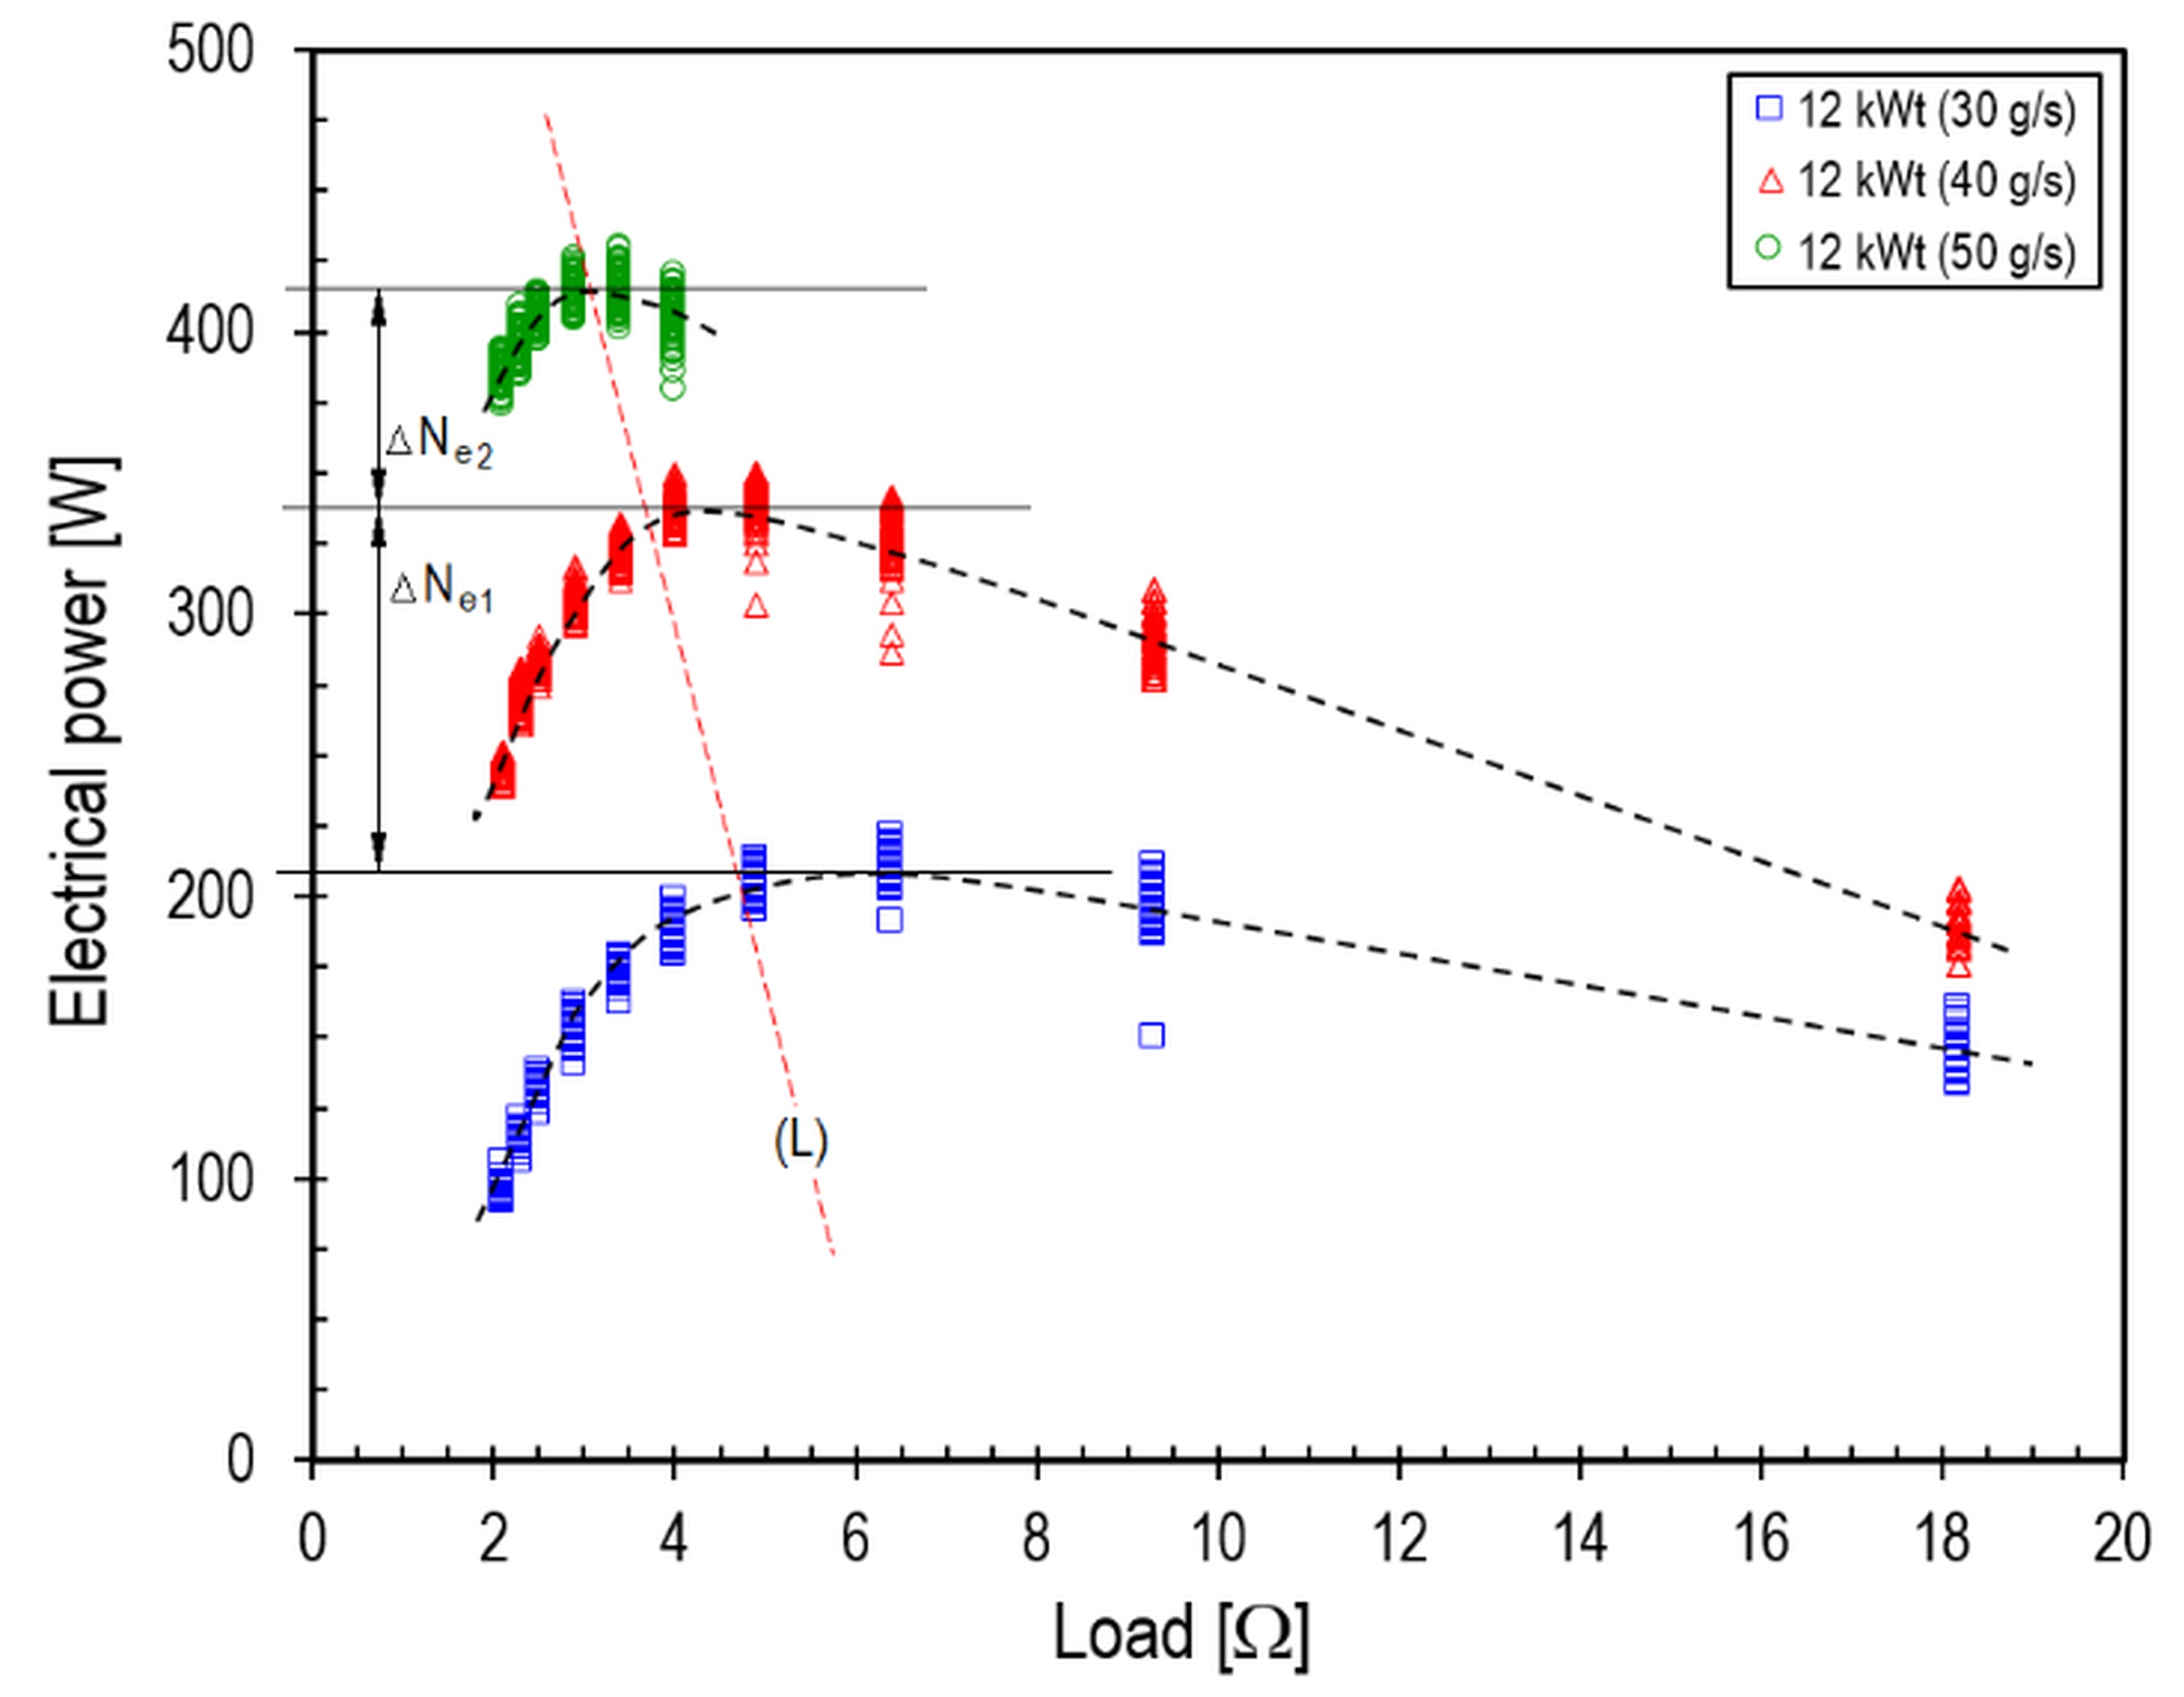
Fig. 4. Effect of generator load on the electrical power of the ORC system at a heat source power of 12 kWt: L – line of optimal load
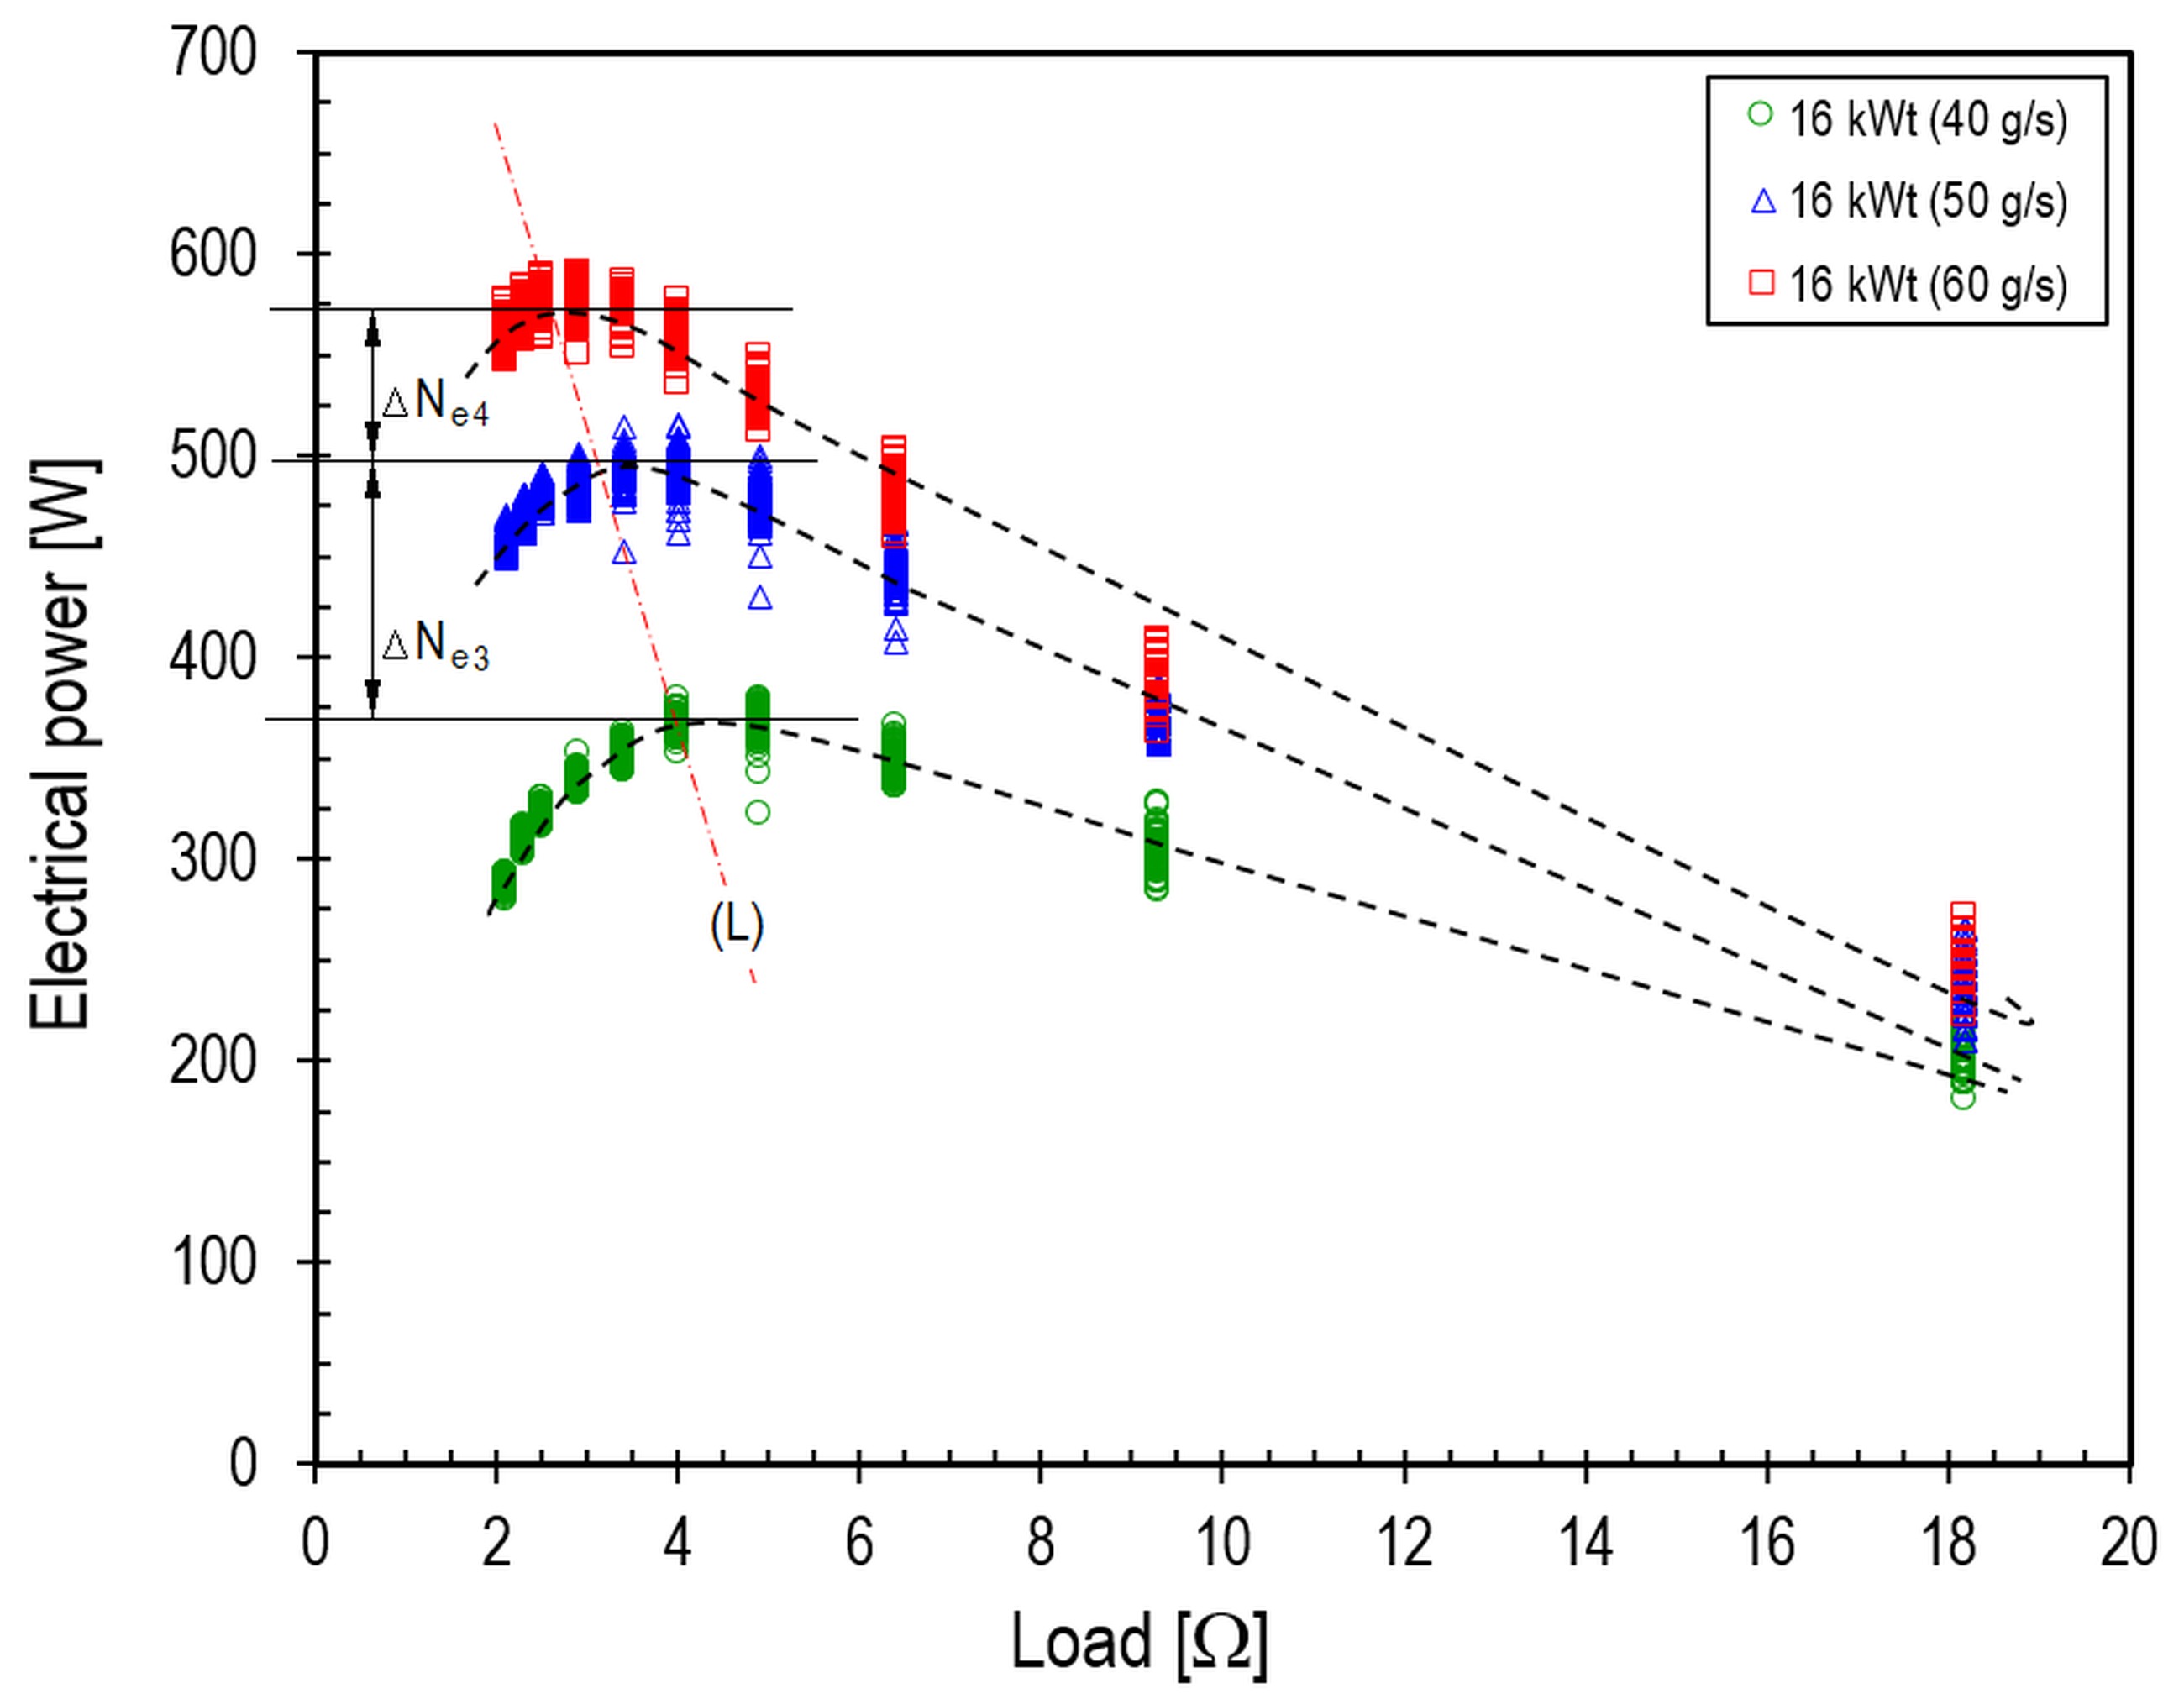
Fig. 5. Effect of generator load on the electrical power of the ORC system at a heat source power of 16 kWt
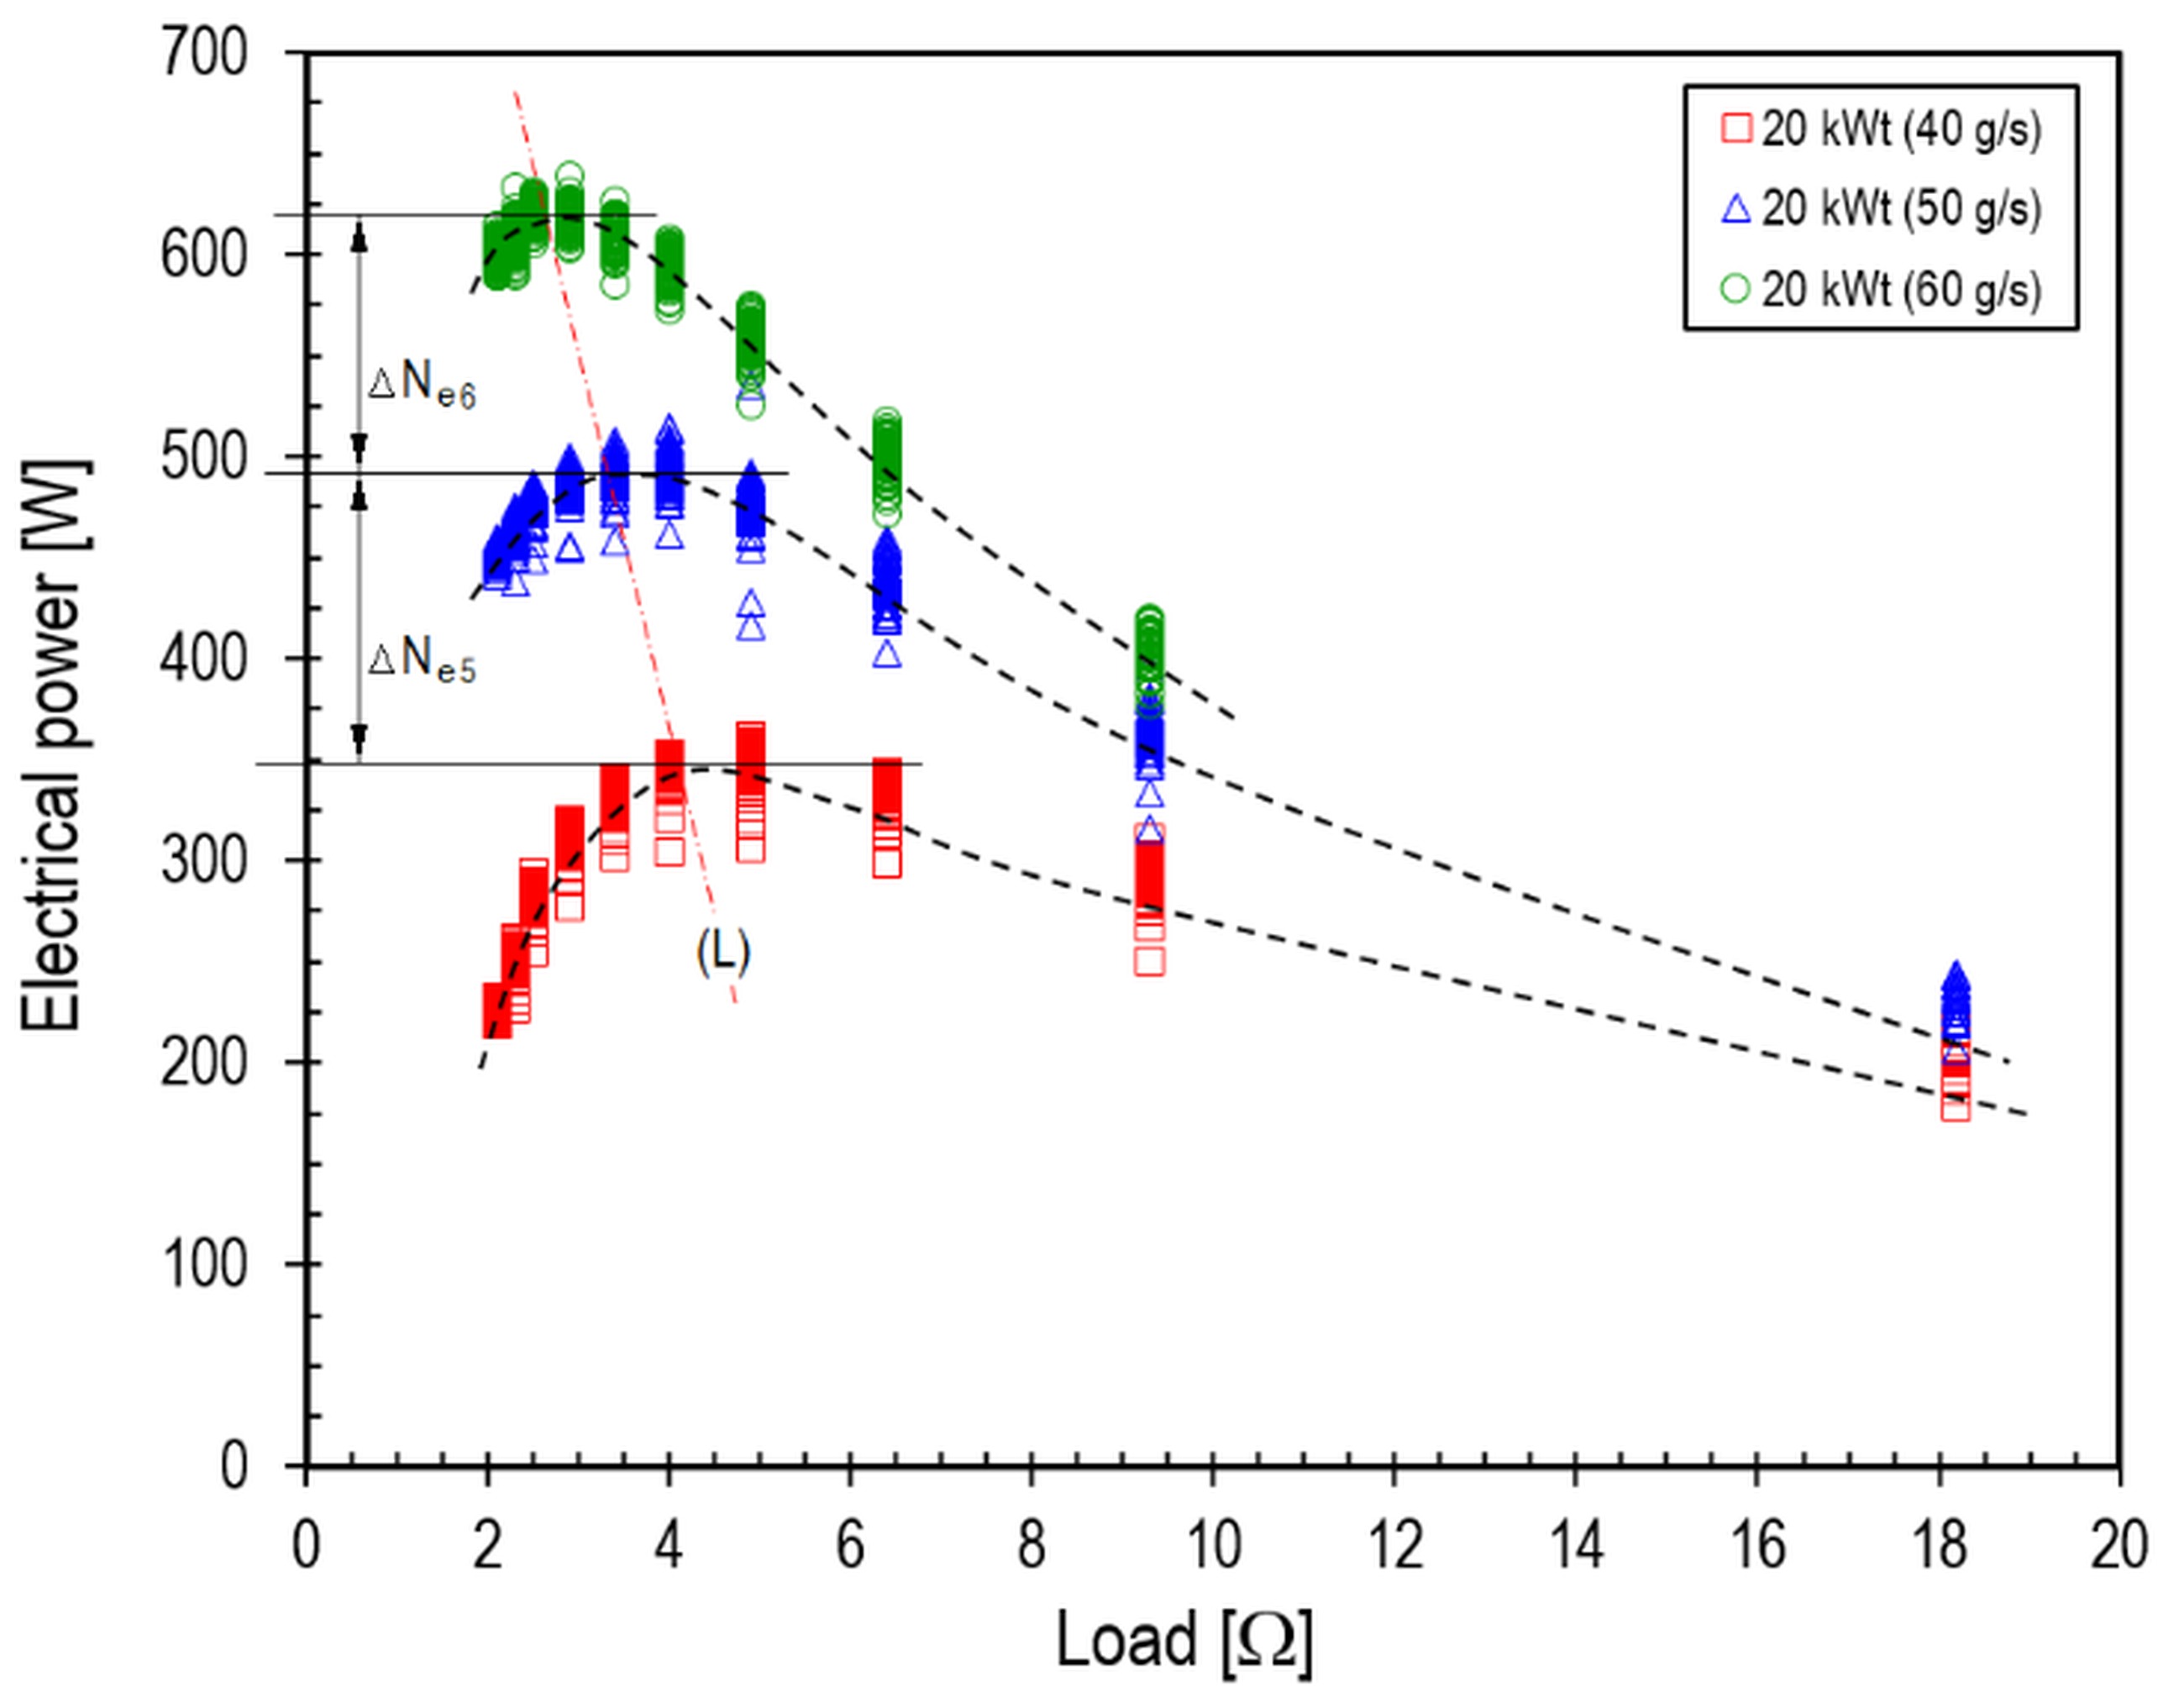
Fig. 6. Effect of generator load on the electrical power of the ORC system at a heat source power of 20 kWt
For a thermal power of 12 kWt, the electrical power increases, ΔNe1 and ΔNe2, were approximately 125 We and 80 We, respectively. In contrast, for heat source powers of 16 kWt (Fig. 5) and 20 kWt (Fig. 6), the increases in electrical power, ΔNe3, ΔNe4, ΔNe5, and ΔNe6, were 130 We, 75 We, 140 We, and 135 We, respectively. The maximum electrical power output of the ORC system, approximately 625 We, was achieved at a heat source power of 18 kWt. At a heat source power of 20 kWt, the electrical output was lower than at 18 kWt (Table 3).
From the above, it can be concluded, firstly, that for a given thermal power of the heat source, there exists an optimum value of the working fluid flow rate at which the electrical power output of the ORC system is maximised. Secondly, for each level of thermal power and preset working fluid flow rate, there is an optimum generator load at which the electrical power output of the ORC system is maximised.
Tab. 3.
Electrical power output maxima of the ORC system
Thirdly, it was determined that, for heat source powers in the range of 12–20 kWt and HFE-7100 flow rates between 30 and 60 g/s, the optimum generator load at which the electrical power output of the ORC system was maximised lay within the range of 2.6–5.1 Ω.
Effect of load on isentropic efficiency
Selected characteristics illustrating the effect of generator load on the isentropic efficiency of the microturbine are shown in Figs. 7–9.
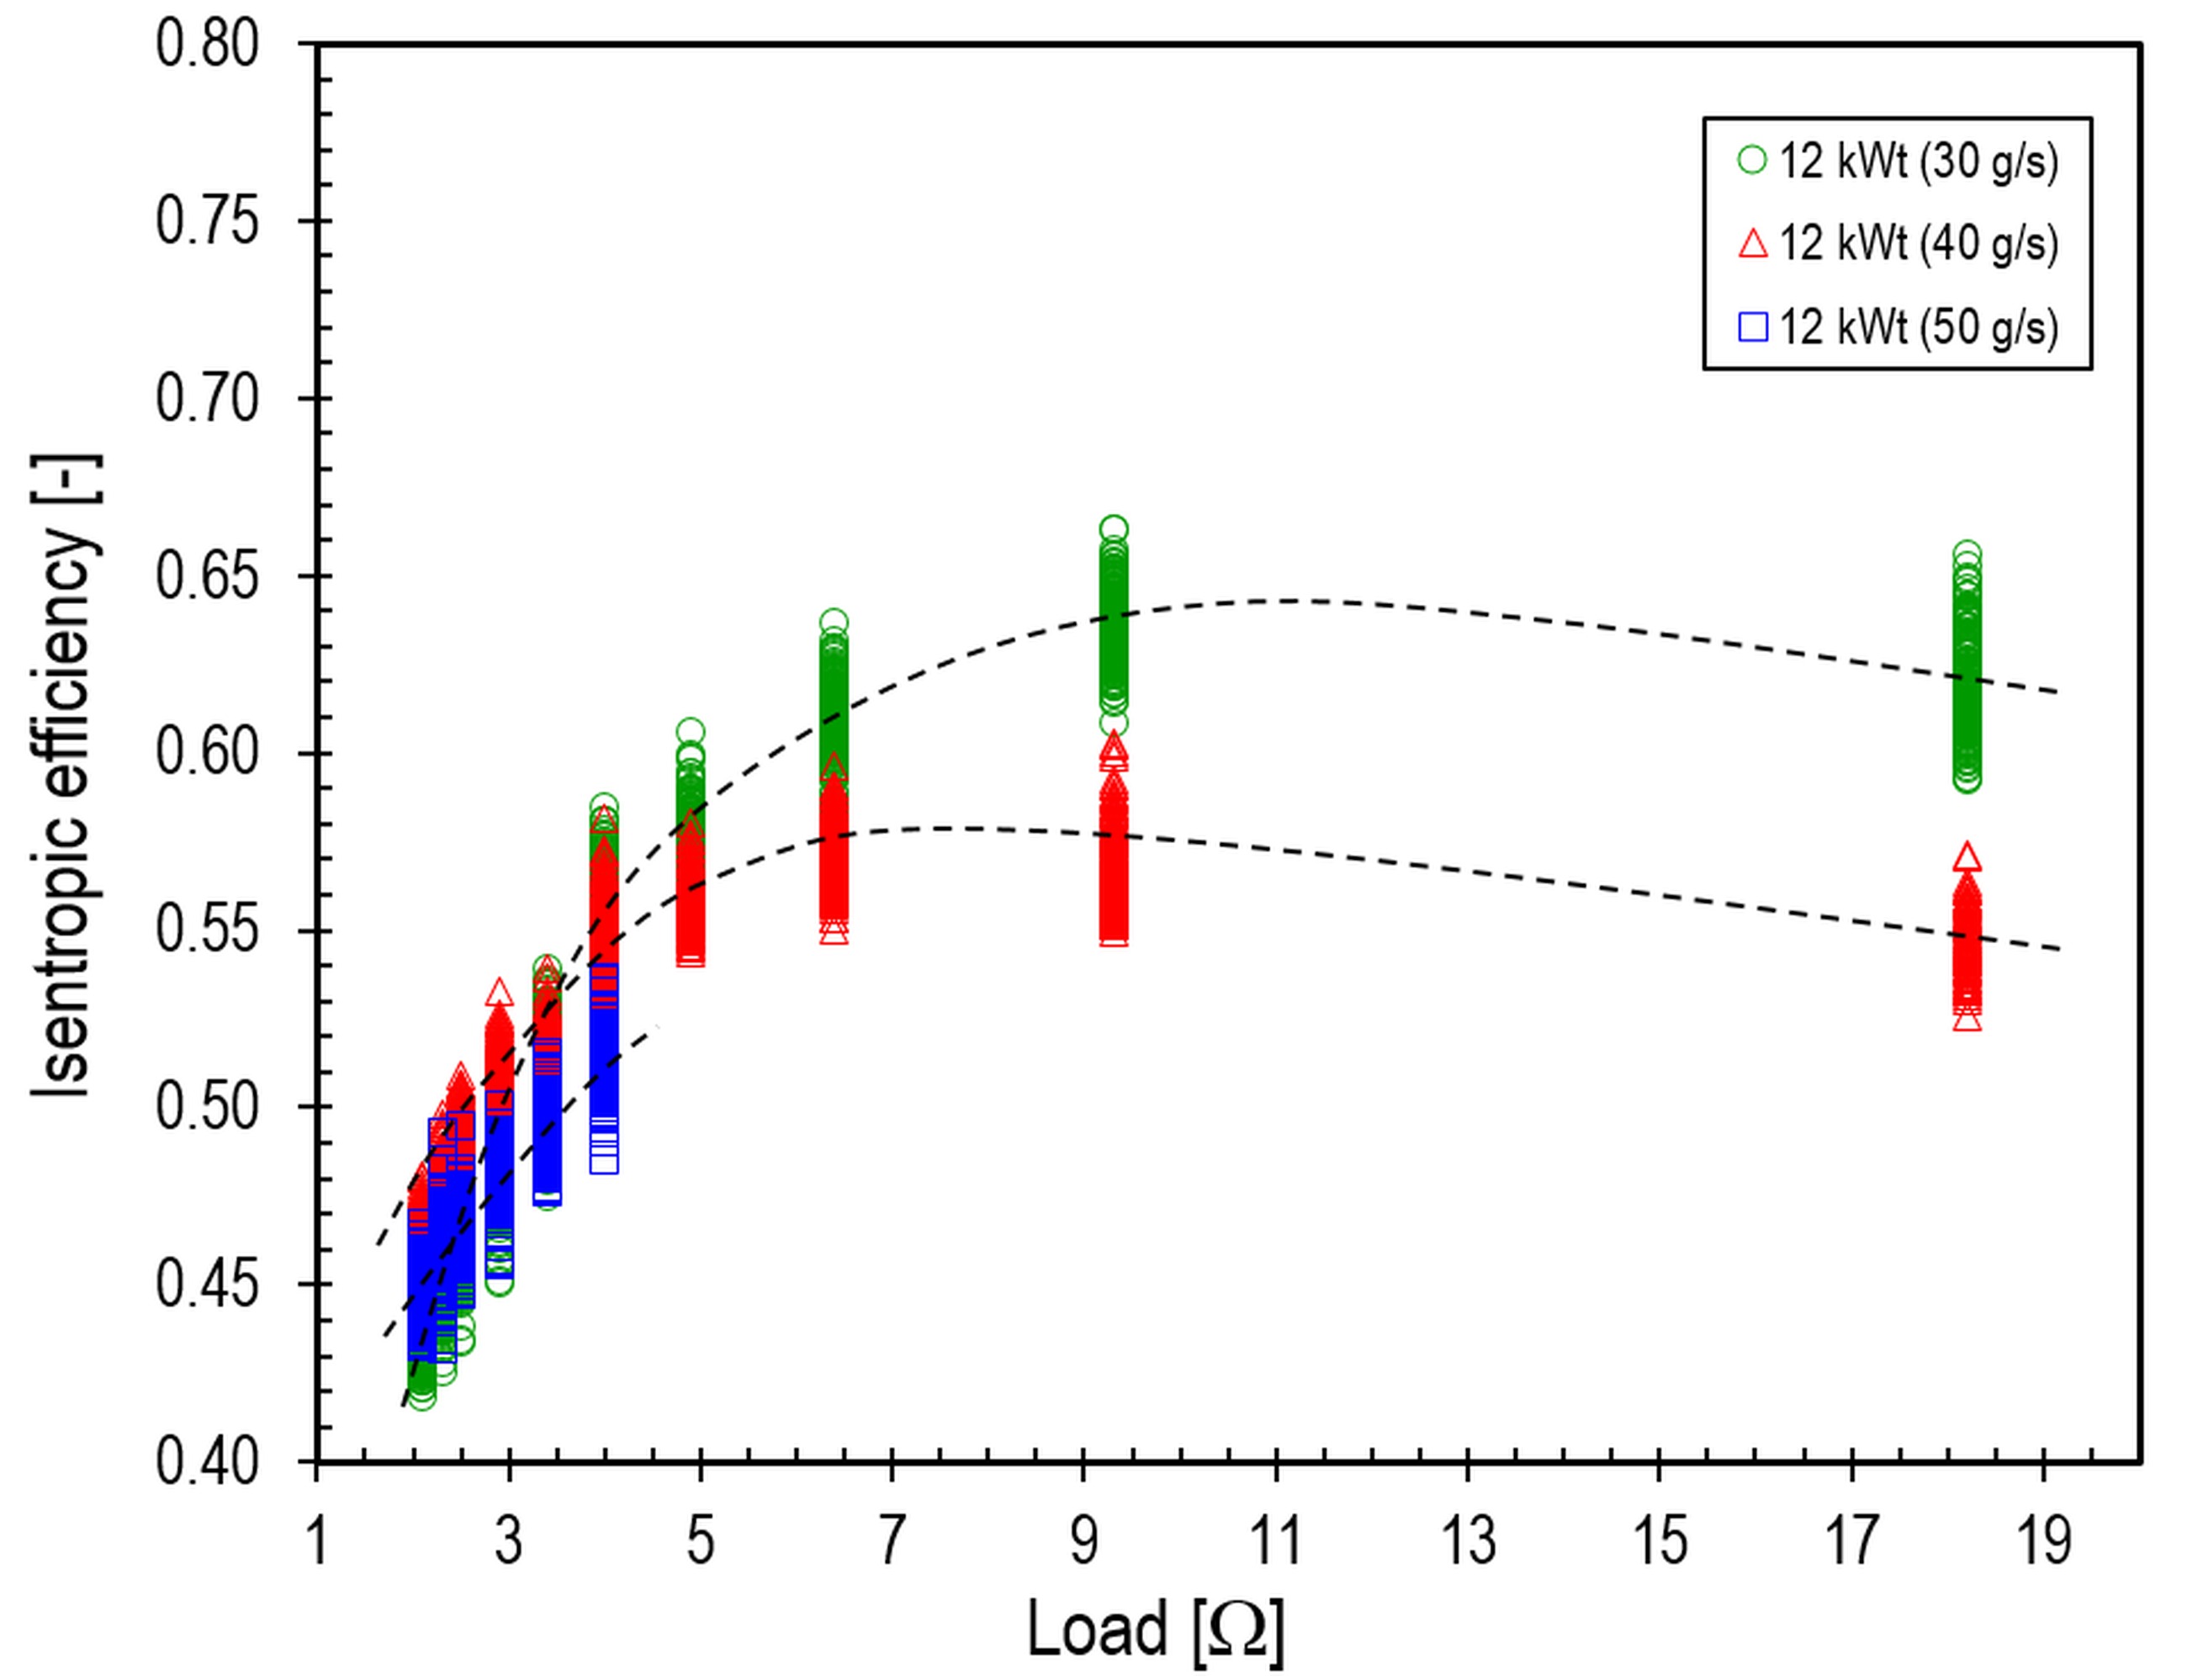
Fig. 7. Effect of generator load on the microturbine’s isentropic efficiency at a heat source power of 12 kWt
It was determined that, regardless of the heat source power, the isentropic efficiency of the microturbine decreased with increasing flow rate of the HFE-7100 medium.The study shows that, at constant heat source power, the optimum load resistance corresponding to the maximum electrical power increased as the flow rate of the HFE-7100 medium increased. For a heat source power of 12 kWt and working medium flow rates of 30 g/s, 40 g/s, and 50 g/s, the maximum isentropic efficiencies of the microturbine were 64%, 58%, and 51%, respectively, achieved at loads of 11.0 Ω, 7.5 Ω, and 4.0 Ω, respectively (Table 4).
The study shows that, at a heat source power of 14 kWt, the microturbine achieved a maximum isentropic efficiency of approximately 70%.
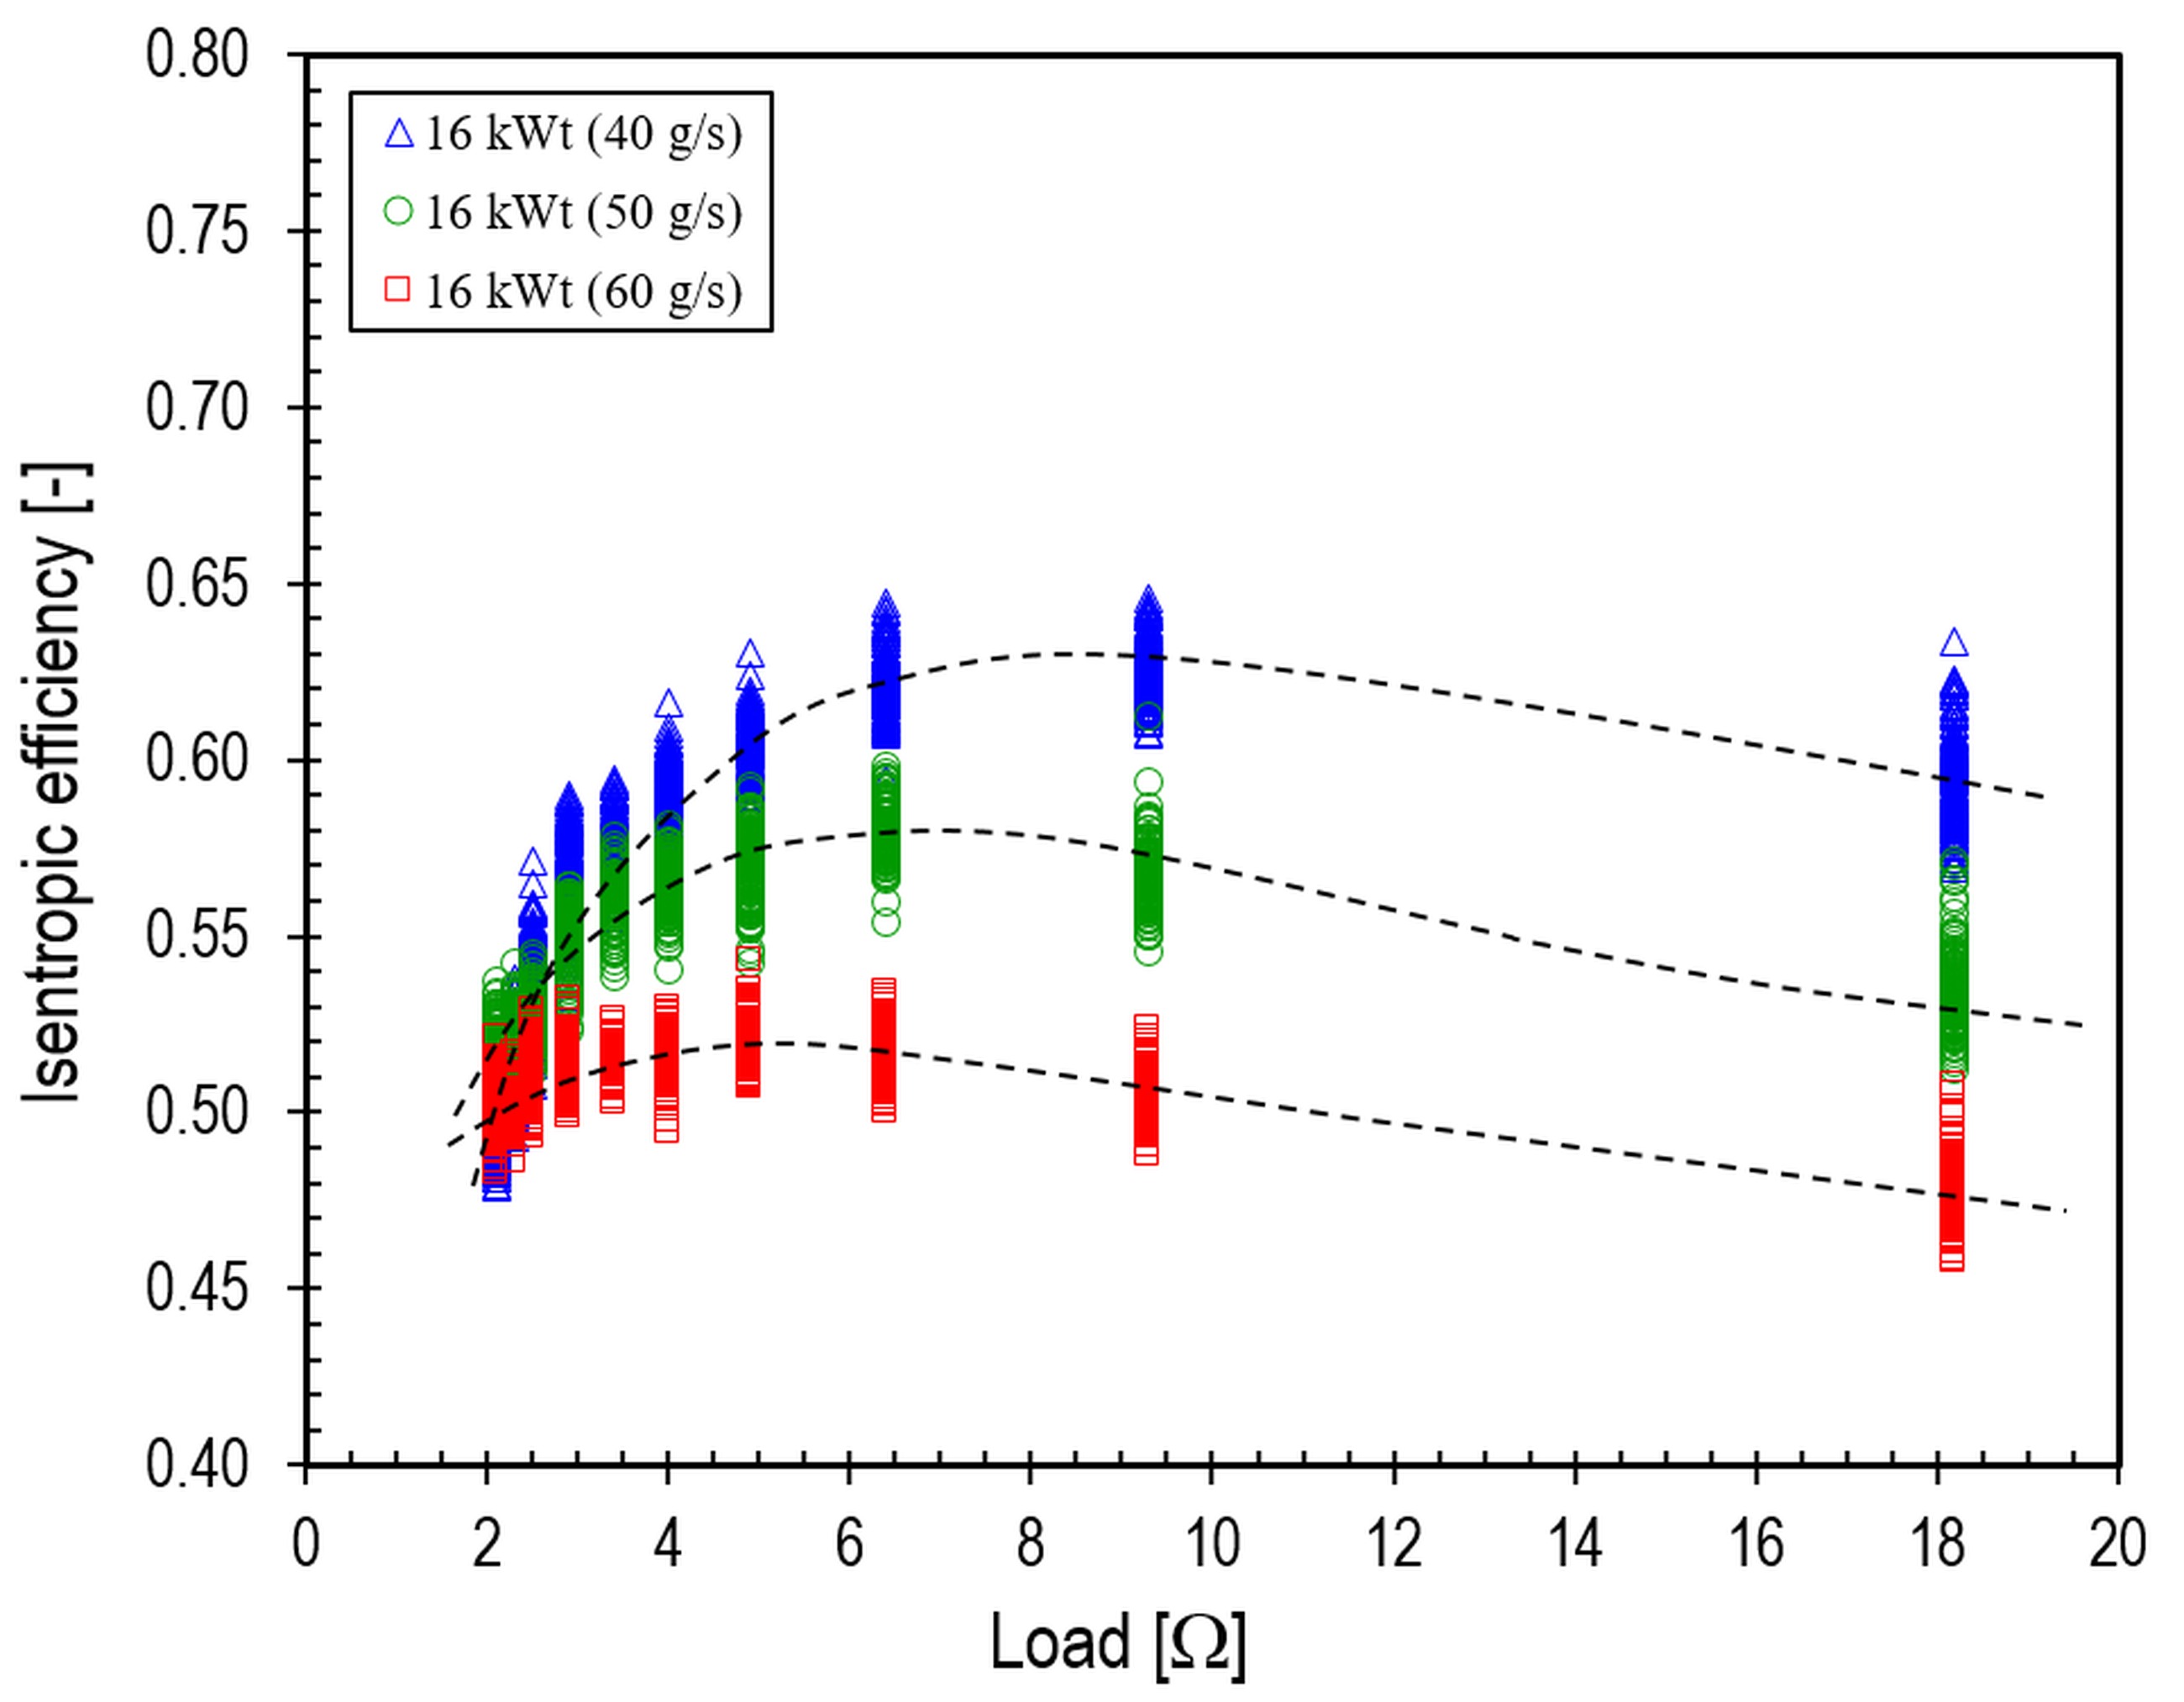
Fig. 8. Effect of generator load on the microturbine’s isentropic efficiency at a heat source power of 16 kWt
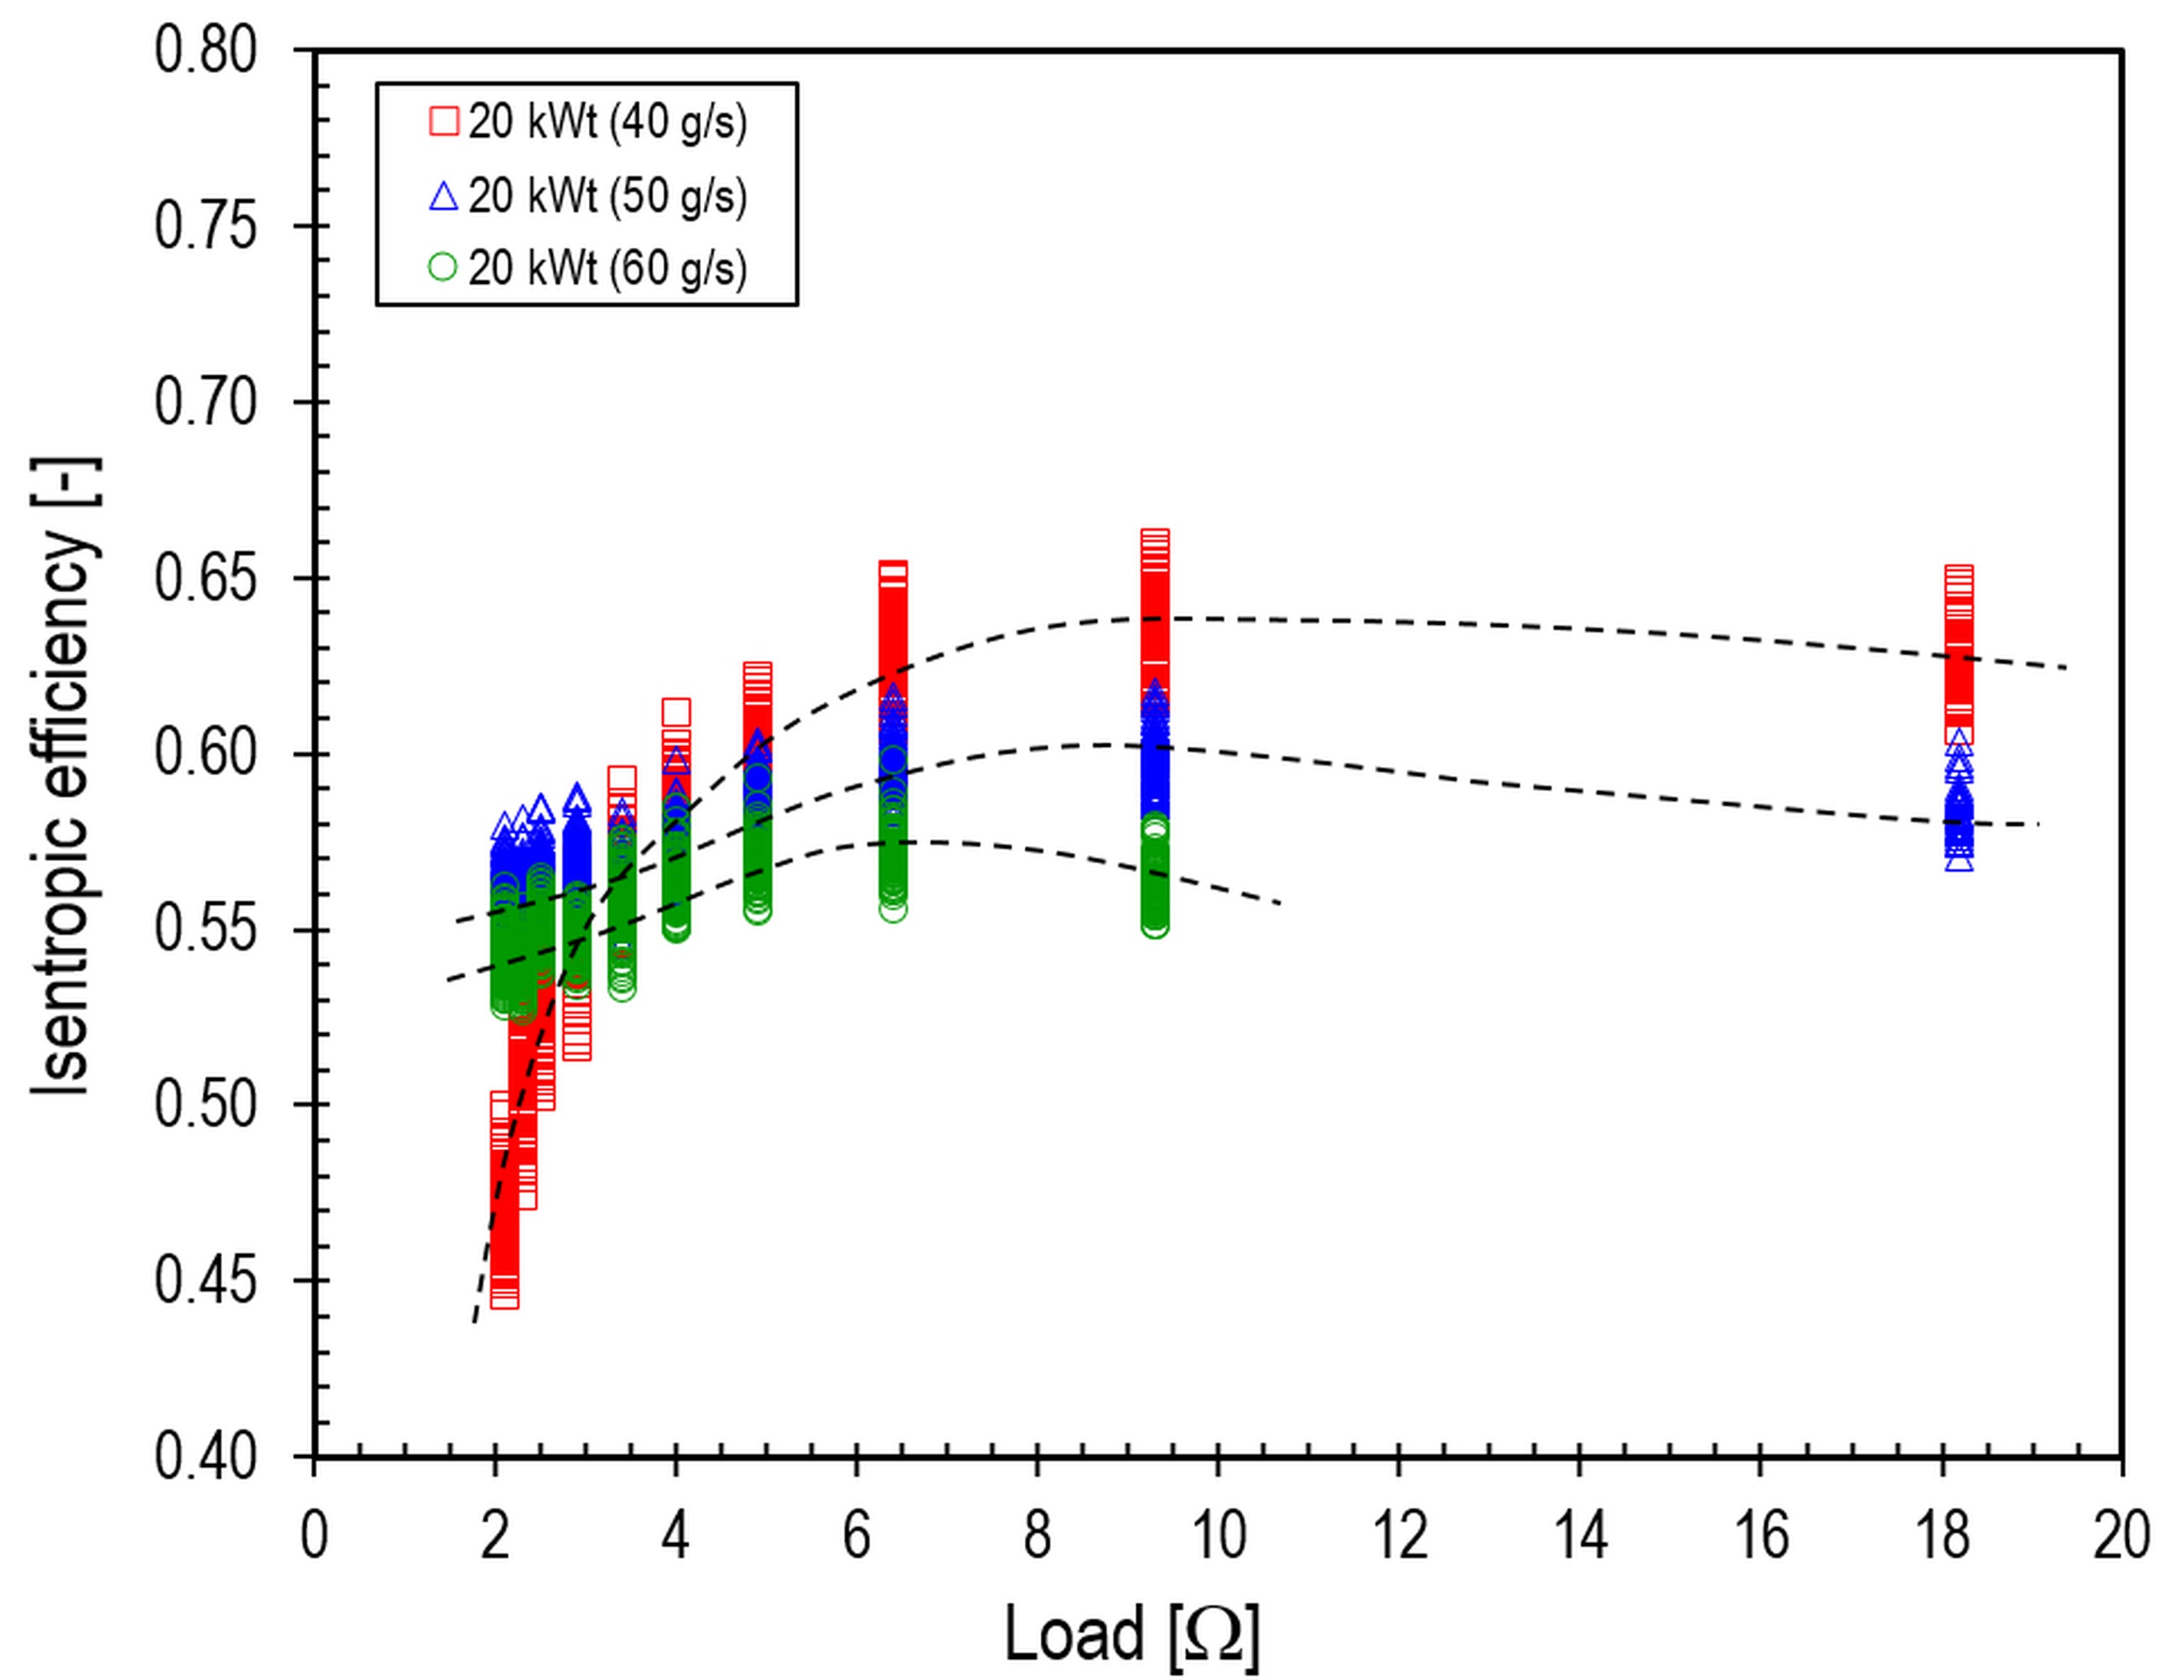
Fig. 9. Effect of generator load on the microturbine’s isentropic efficiency at a heat source power of 20 kWt
From the above, it follows, firstly, that for a given thermal power of the heat source, there is an optimum value of the working medium flow rate at which the isentropic efficiency of the microturbine is maximised.
Secondly, for each thermal power level and preset working medium flow rate, there is an optimum generator load at which the isentropic efficiency of the microturbine is maximised.
Tab. 4.
Isentropic efficiency maxima of the microturbine
Thirdly, it was determined that, for a heat source power in the range of 12–20 kWt and an HFE-7100 flow rate between 30 and 60 g/s, the maximum isentropic efficiency of the microturbine ranged from 50% to 70%, achieved at a load between 3.5 and 10.5 Ω.
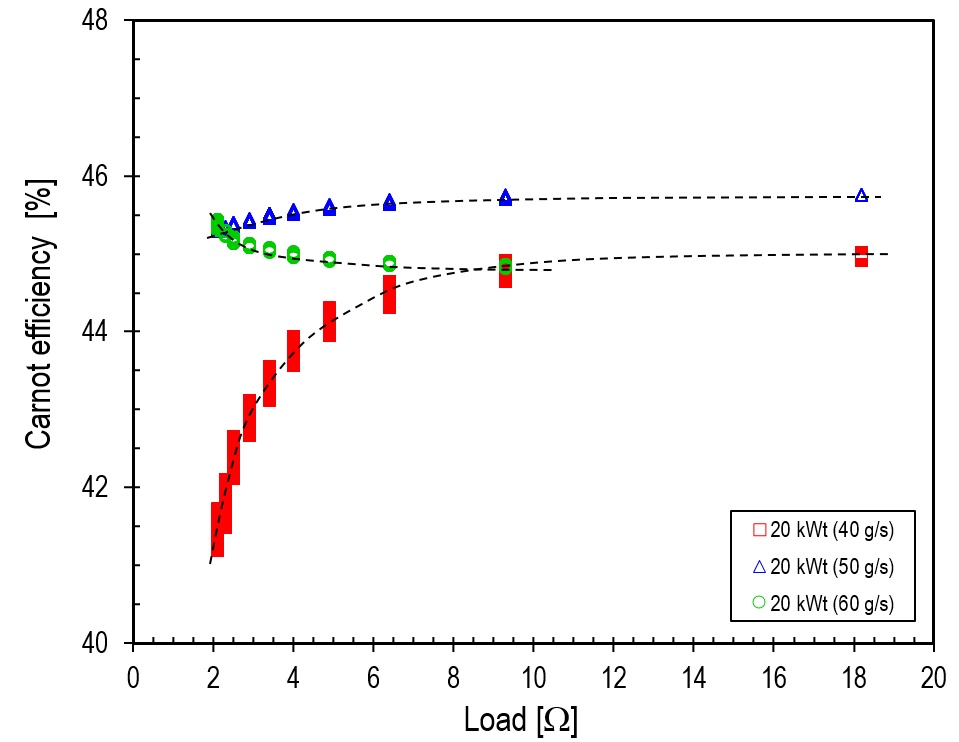
Effect of load on Carnot efficiency
Fig. 10 shows that, at a working medium flow rate of 30 g/s, the Carnot efficiency increased as the load resistance of the microturbine generator rose from 2.1 Ω to 9.3 Ω.
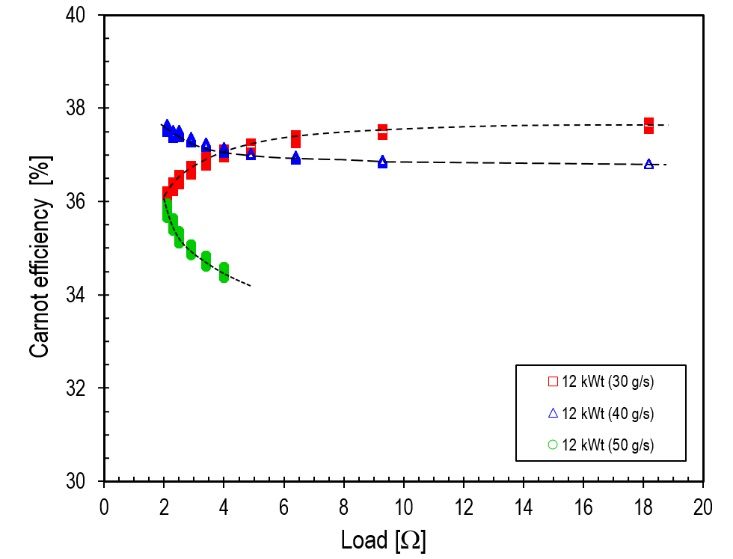
The opposite trend was observed at HFE-7100 flow rates of 40 g/s and 50 g/s. In contrast, above a resistance of 9.3 Ω, regardless of the working medium flow rate and the heat source power, the Carnot efficiency remained practically constant, as shown in Figs. 11 and 12. For a heat source power of 12 kWt, a maximum Carnot efficiency of approximately 37.5% was achieved at an HFE-7100 flow rate of 30 g/s (Table 5).
In contrast, for heat source powers in the range of 12–20 kWt, a maximum Carnot efficiency of approximately 45.7% (Table 5) was obtained at an HFE-7100 flow rate of 50 g/s and a heat source power of 20 kWt. The optimum load on the microturbine generator, for flow rates in the range of 30–60 g/s and heat source powers between 12 and 20 kWt, was between 2.1 Ω and 9.3 Ω. In addition, the study shows that, for each thermal power level of the heat source and a working fluid flow rate in the range of 30–60 g/s, the maximum difference between the Carnot efficiency maxima does not exceed 1.8 percentage points, this occurring at a heat source power of 14 kWt.
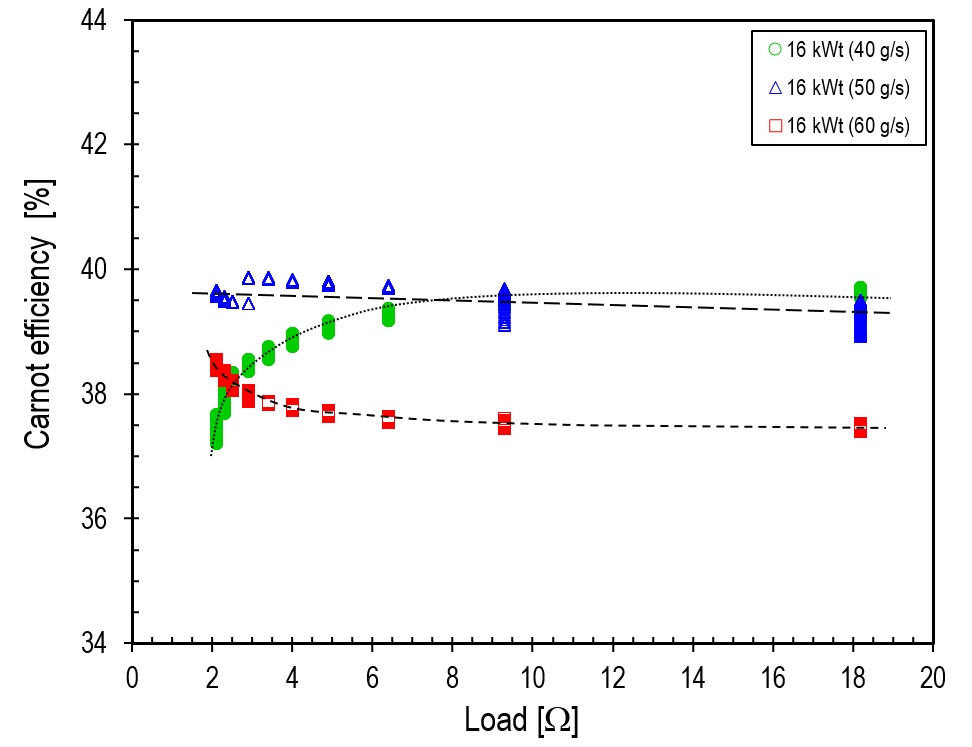
In other cases, the maximum difference between the efficiency maxima did not exceed 0.7%.
Tab. 5.
Carnot efficiency maxima of the HFE-7100 cycle
For example, for a heat source power of 12 kWt, the average maximum Carnot efficiency was 36.8 ± 0.7%. In contrast, for heat source powers of 16 kWt, 18 kWt, and 20 kWt, the average maximum Carnot efficiencies were 39.2 ± 0.7%, 41.9 ± 0.6%, and 45.4 ± 0.4%, respectively.
The study shows that, for heat source powers in the range of 12–20 kWt and HFE-7100 flow rates between 30 and 60 g/s, the Carnot efficiency ranged from 36.1% to 45.7% (Table 5).
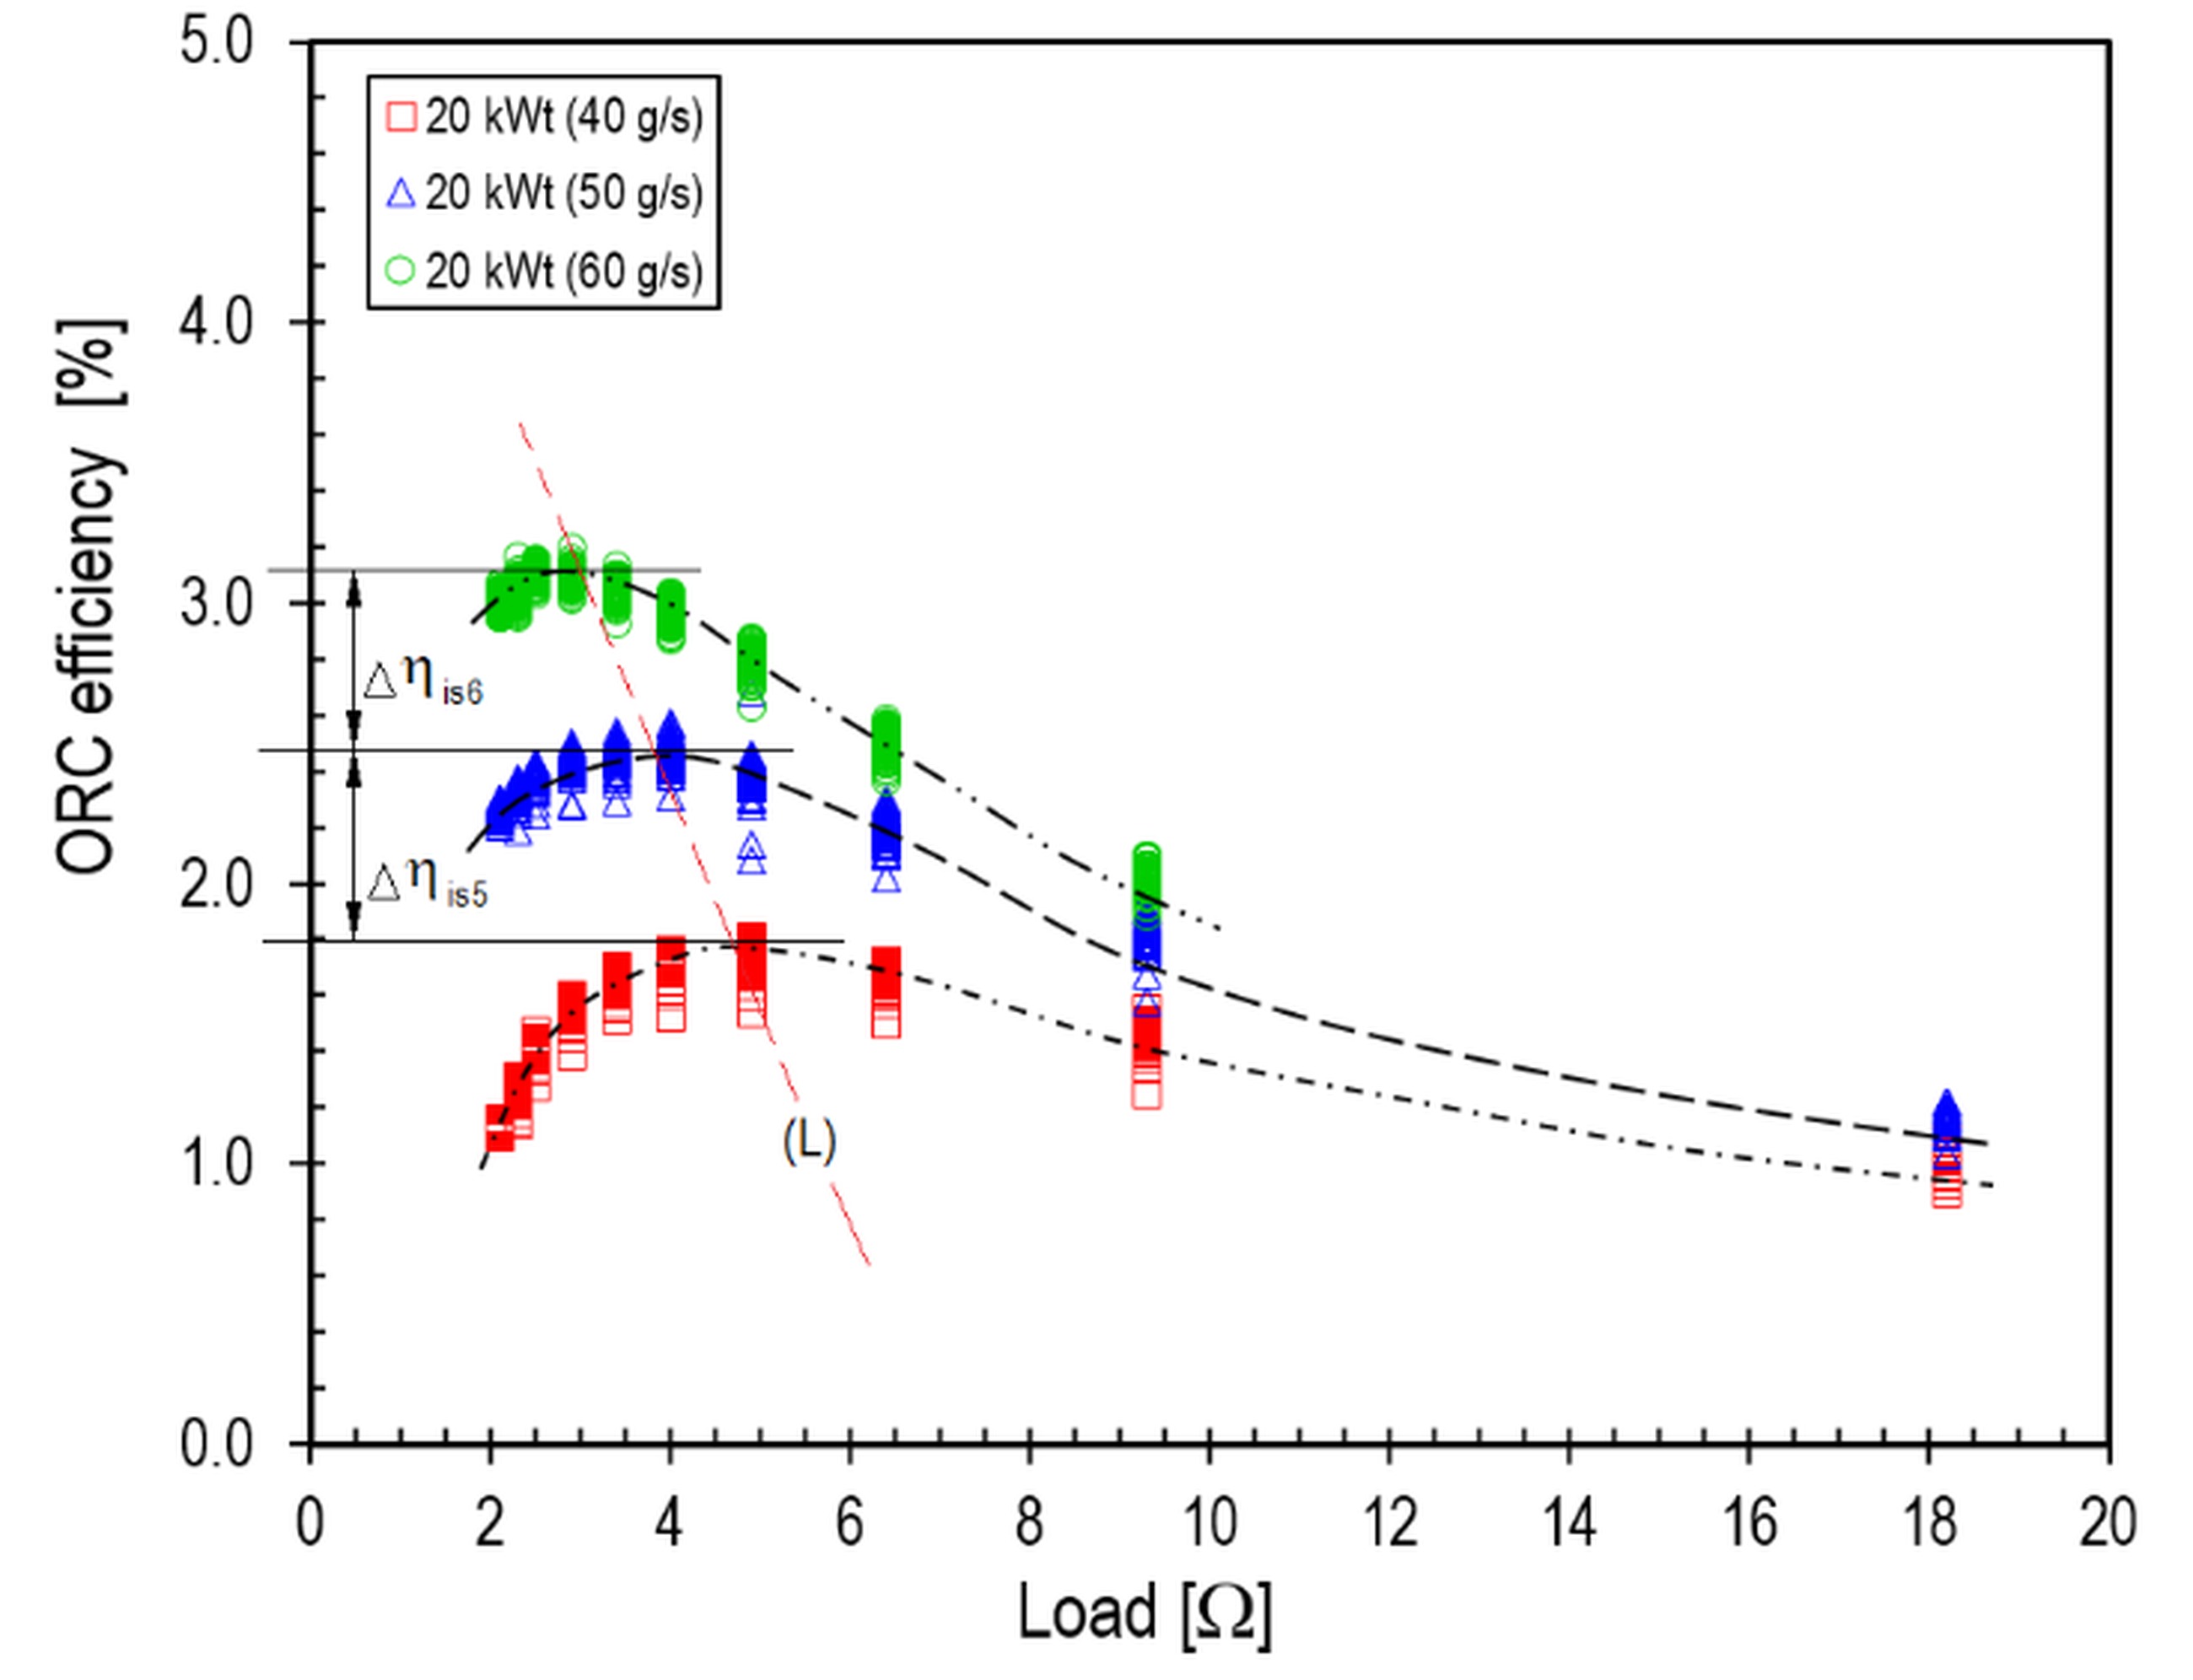
Effect of load on ORC system efficiency
Example characteristics illustrating the effect of generator load on the ORC system efficiency for heat source powers of 12 kWt, 16 kWt, and 20 kWt are shown in Figs. 13–15, respectively. It was determined that, irrespective of the heat source power, the efficiency of the ORC system increased as the flow rate of the working medium increased. It was found that, for a preset heat source power and maximum ORC system efficiencies, the optimum load resistance decreased as the HFE-7100 medium flow rate increased, with the load line (L) sloping to the left.
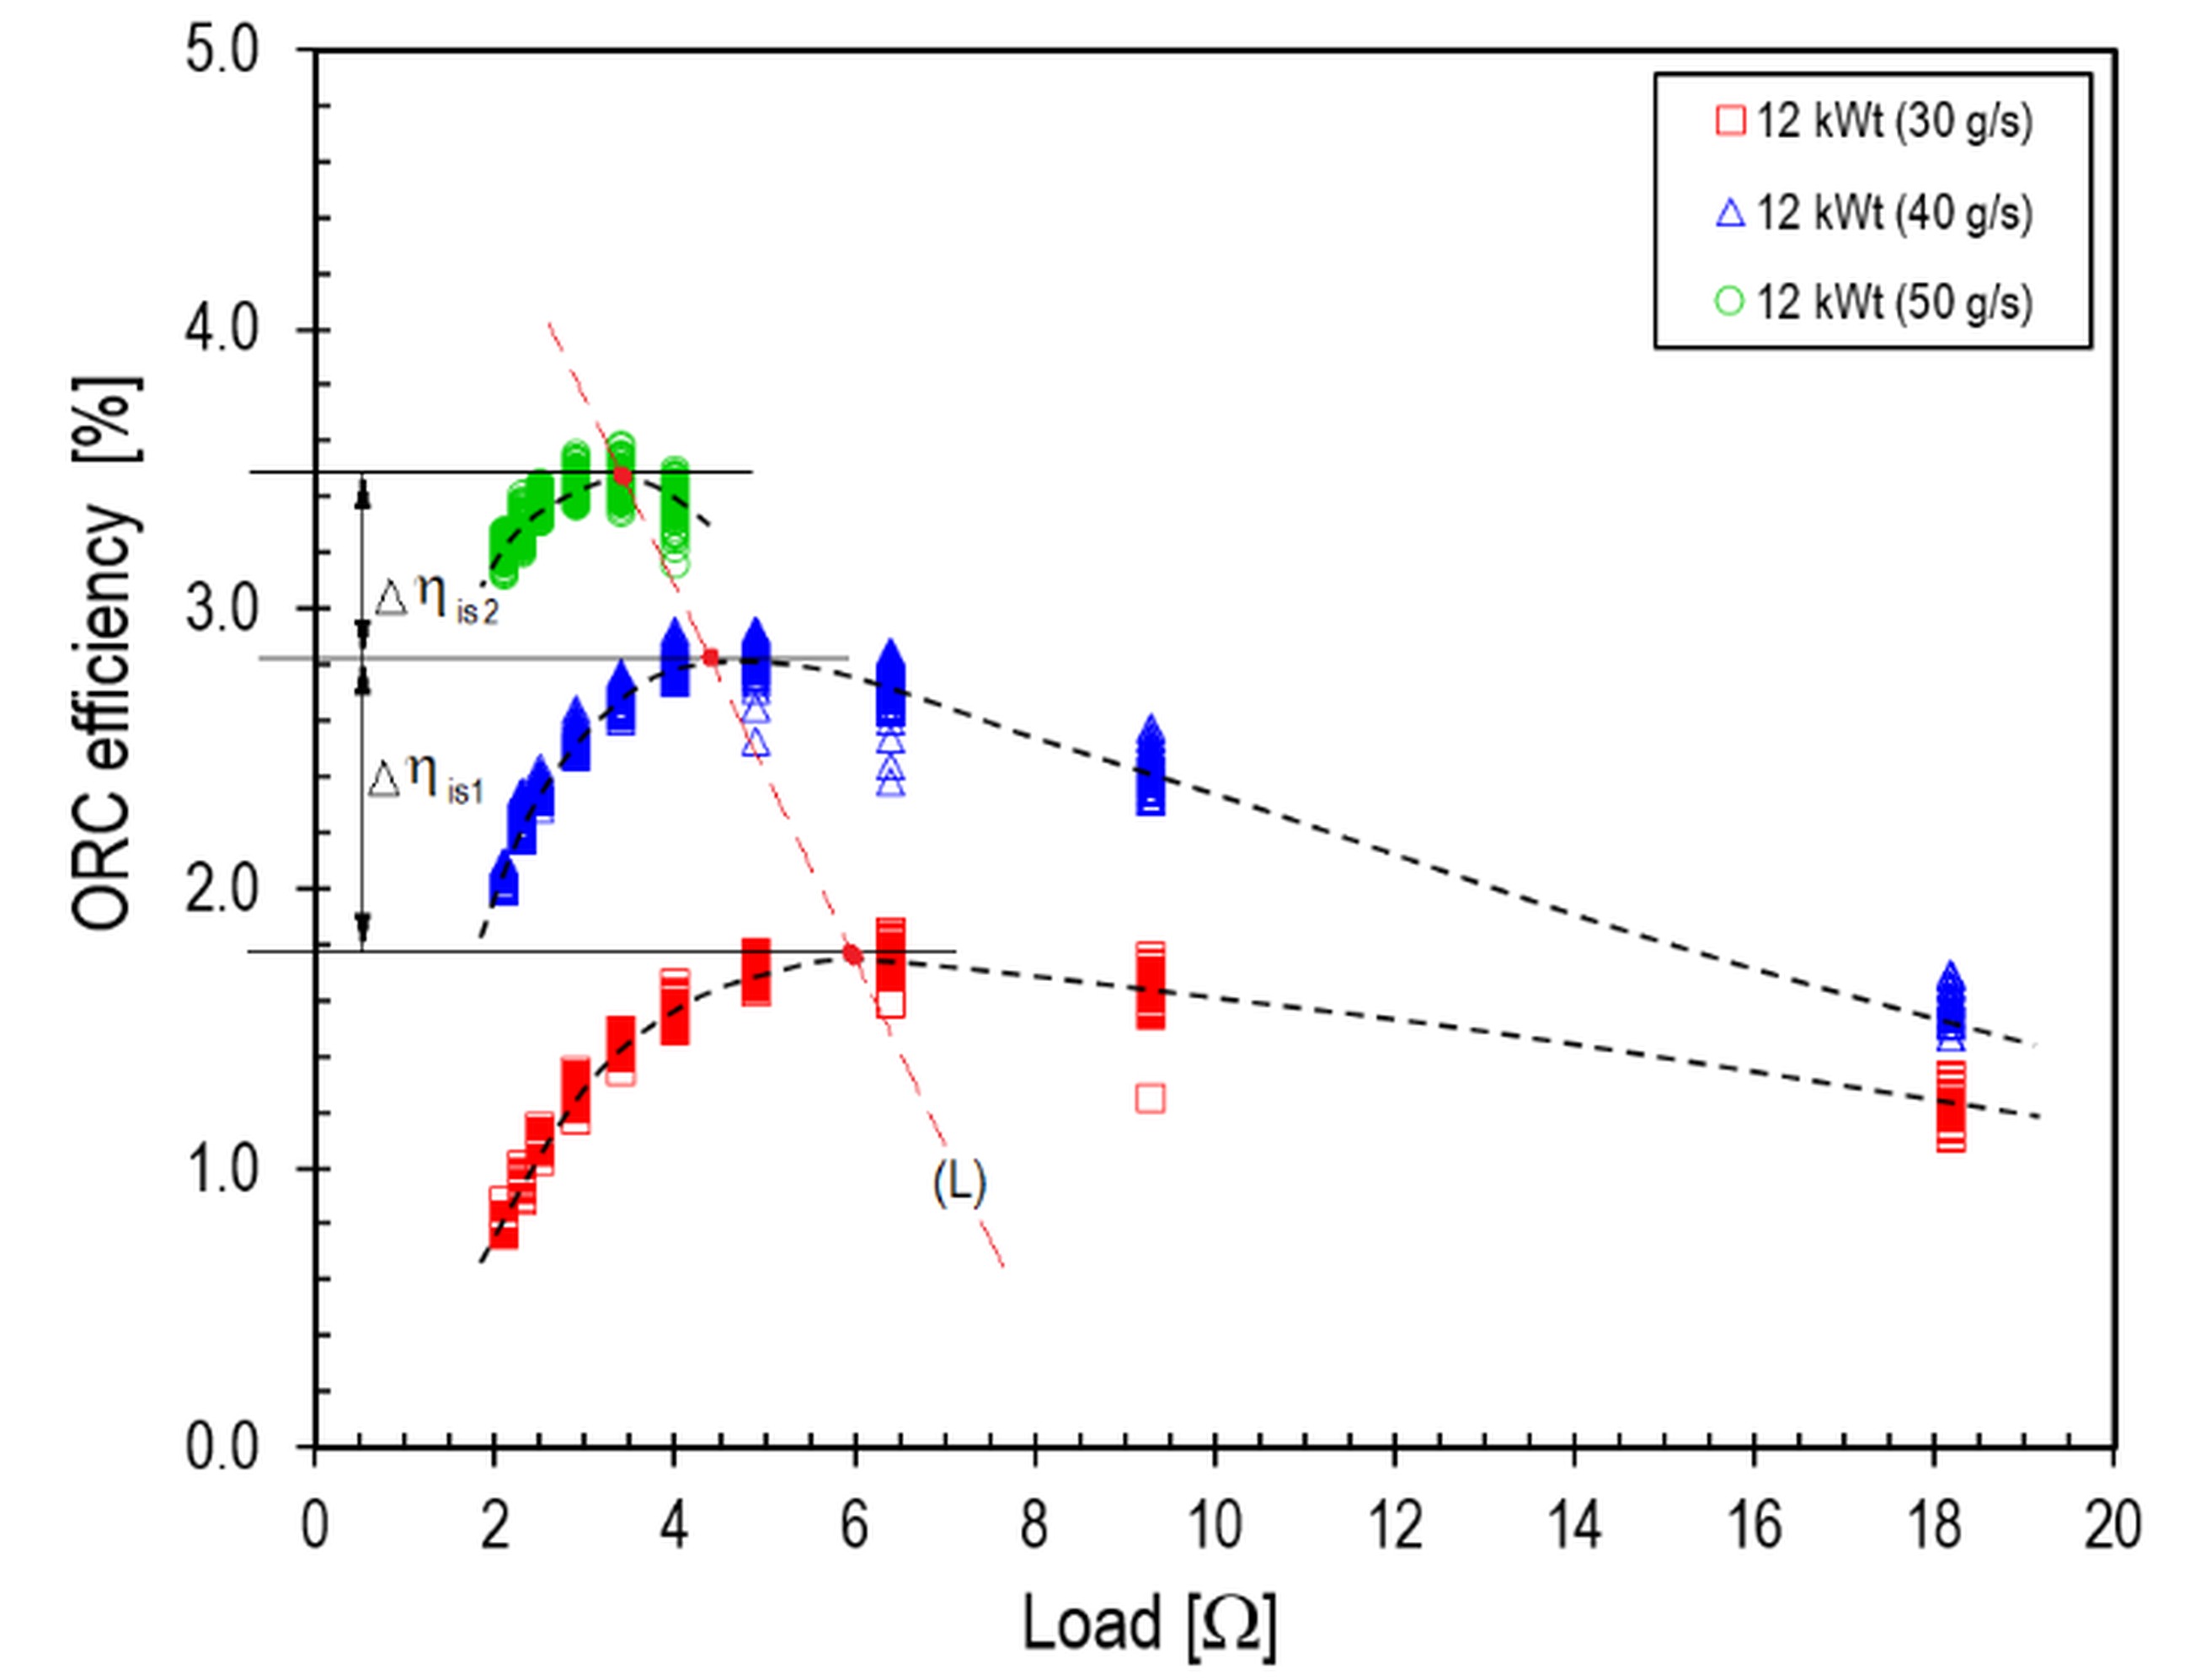
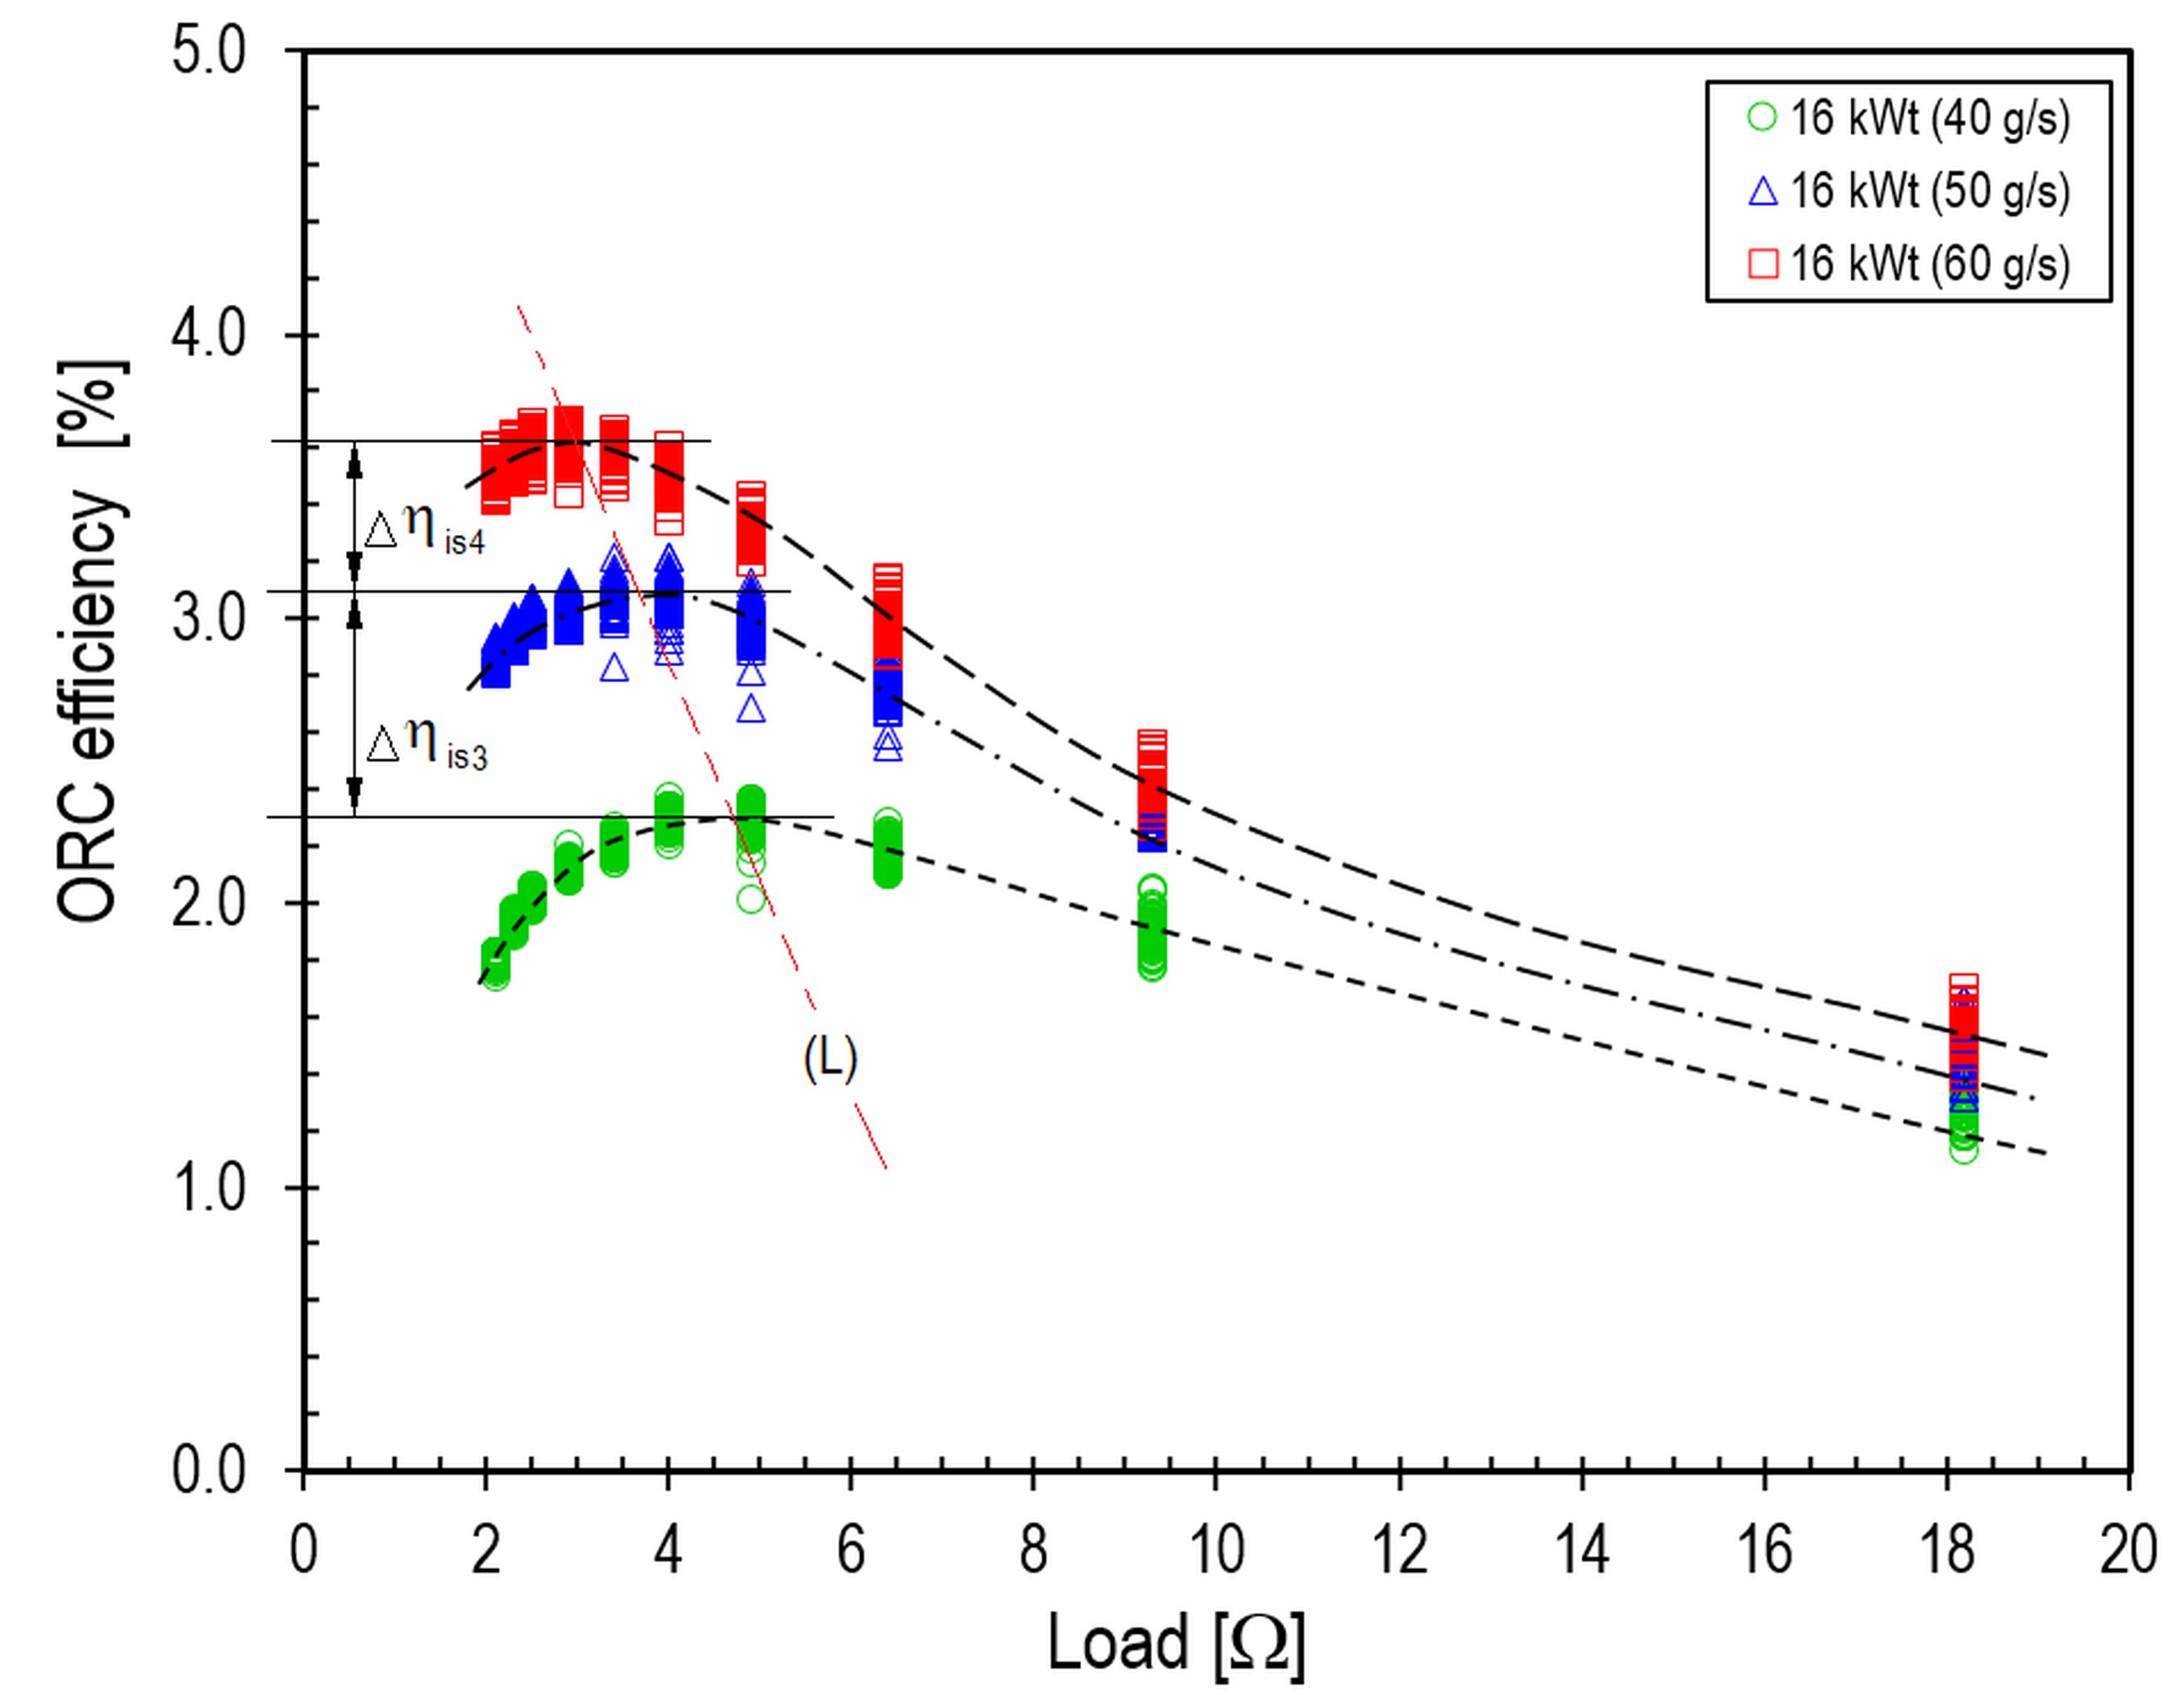
For example, at a heat source power of 12 kWt, the efficiency maxima at working medium flow rates of 30 g/s, 40 g/s, and 50 g/s were 1.8%, 2.8%, and 3.5%, respectively, which were obtained with load resistances of 6.0 Ω, 4.5 Ω, and 3.5 Ω, respectively (Table 6). In contrast, at heat source powers of 16 kWt and 20 kWt, and HFE-7100 flow rates of 40 g/s, 50 g/s, and 60 g/s, the efficiencies were 2.3%, 3.1%, and 3.6% for 16 kWt, and 1.8%, 2.5%, and 3.1% for 20 kWt, respectively.
The optimum generator load values for the above ORC system efficiency maxima were 4.3 Ω, 3.5 Ω, and 3.0 Ω for 16 kWt, and 4.5 Ω, 3.5 Ω, and 2.5 Ω for 20 kWt, respectively. From the research conducted, it can be seen that the maximum ORC system efficiency of approximately 4.0% was achieved for a heat source power of 14 kWt at an HFE-7100 flow rate of 60 g/s.
The study shows that, irrespective of the heat source power level, the increase in isentropic efficiency of the microturbine (Δηis) decreased with increasing flow rate of the working medium. For example, at a heat source power of 12 kWt, the increments in isentropic efficiency, Δηe1 and Δηe2, were 1.0% and 0.7%, respectively. For a heat source power of 16 kWt (Fig. 14), the increases in efficiency, Δηe3 and Δηe4, were 0.8% and 0.5%, respectively. In contrast, for a heat source power of 20 kWt (Fig. 15), the increases in efficiency, Δηe5 and Δηe6, were 0.7% and 0.6%, respectively.
It is worth noting that, at the preset HFE-7100 flow rates, the increases in efficiency decreased as the heat source power increased.
Tab. 6.
ORC efficiency maxima
Furthermore, it was observed that, for heat source powers of 20 kWt and 18 kWt, the ORC system efficiencies obtained were lower than those achieved at a heat source power of 16 kWt (Table 6). This indicates that there is an optimum value of heat source power at which the efficiency of the ORC system will be maximised. Hence, it can be said that, for a preset thermal power of the heat source, there is an optimum value of the working medium flow rate at which the efficiency of the ORC system will be maximised. In addition, for each thermal power level and preset working medium flow rate, there is an optimum value of generator load at which the efficiency of the ORC system will be maximised.
To summarise, it can be concluded that for a heat source power in the range of 12–20 kWt and an HFE-7100 flow rate in the range of 30–60 g/s, the optimum generator load (Table 6) at which the ORC system efficiency was maximised lay within the range of 2.2–6.1 Ω.
Vibration measurements of the microturbine
Vibration measurements of fluid-flow machines enable an assessment of their impact on the immediate environment and are crucial for determining their potential applications. Excessive vibration levels, and the associated noise, preclude the use of certain machines in domestic environments. In addition, detailed vibration analysis complements thermal and flow measurement results and enables the early detection of malfunctions or damage that may occur during operation. This is particularly important for high-speed machines, such as microturbines.
To assess the dynamic state of the microturbine during the studies described earlier, its vibration level was continuously monitored. Vibrations were measured on the machine casing in the vicinity of the bearing node situated between the generator and the blade system. High-temperature single-axis accelerometers, connected to an MBJ Diamond 401AXT portable vibration analyser, were used to measure vibrations. The accelerometers were mounted on the microturbine casing using magnetic feet positioned on stands made of ferromagnetic steel. Measurements were taken in the horizontal and vertical directions, perpendicular to the rotor’s axis of rotation. Fig. 16 shows a photograph of the turbogenerator with the accelerometers installed.
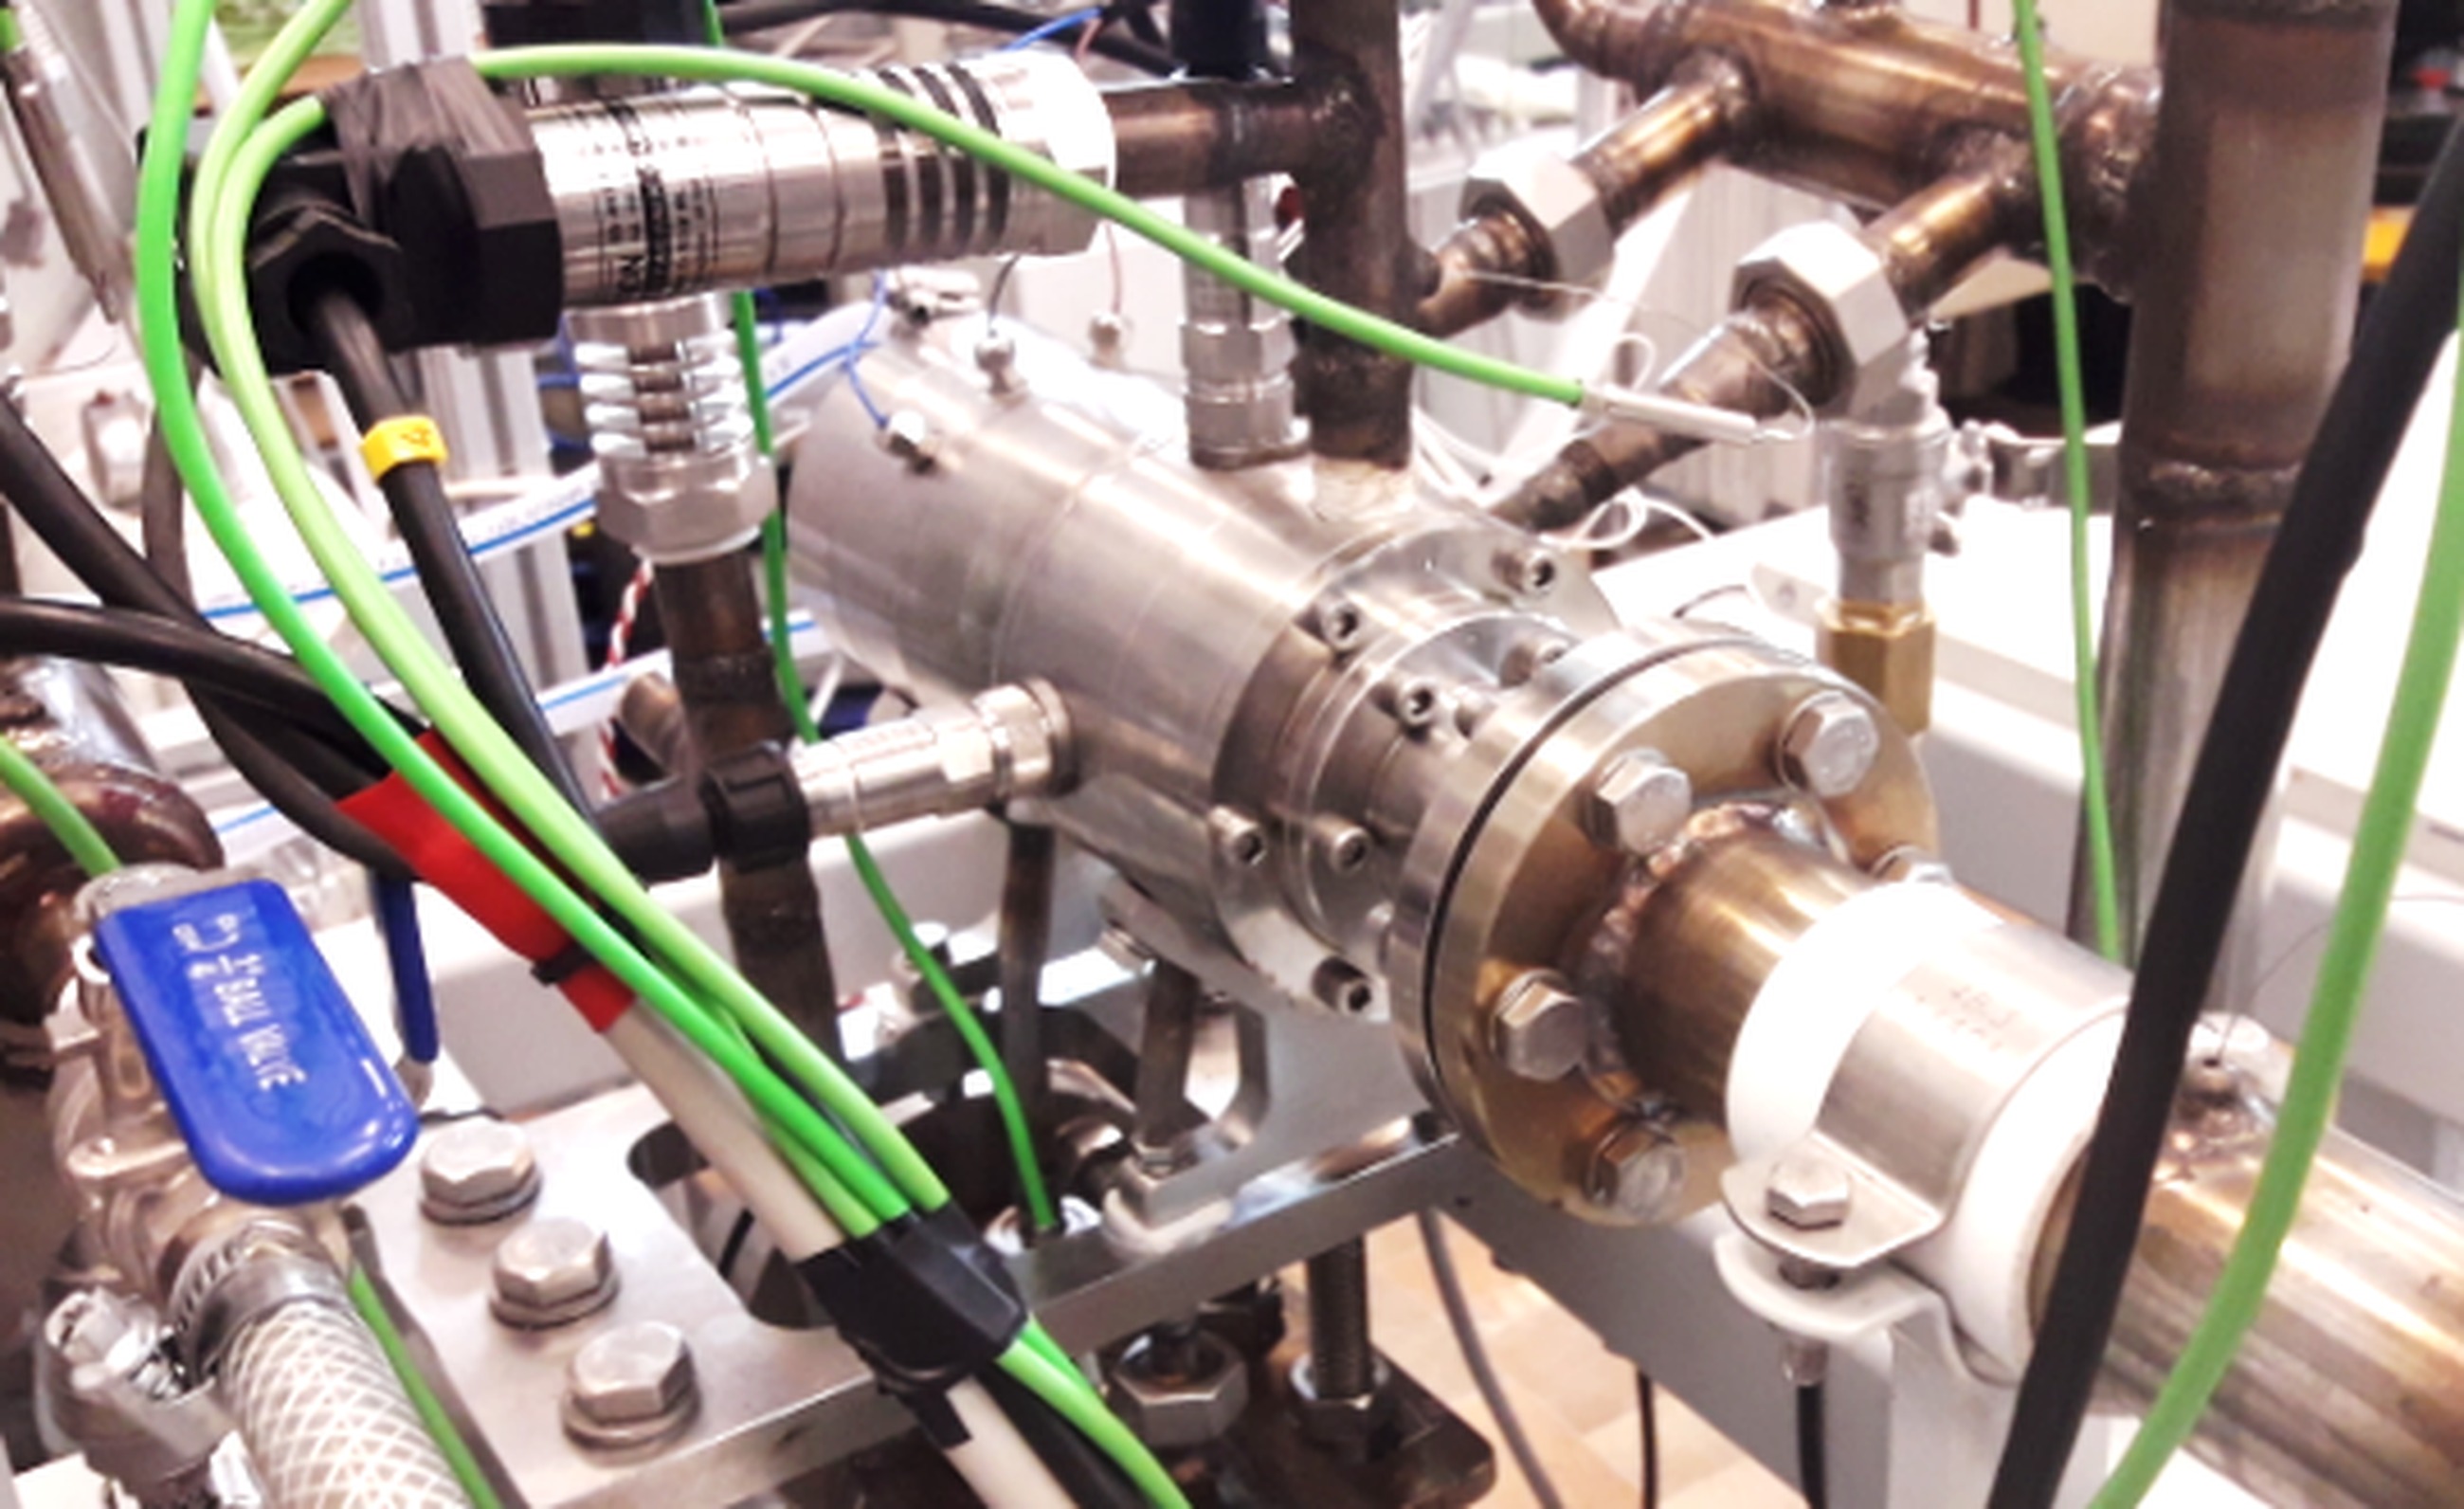
Fig. 16. Microturbine with uniaxial accelerometers installed on its casing in the vicinity of the bearing node
Selected measurement results obtained at different rotational speeds and microturbine power levels are presented as frequency distributions of vibration velocities in Figs. 17–19. The measurement results presented in this article are limited to vibrations recorded in the vertical direction. Vibrations in this direction were less affected by external influences and therefore better represented those of the microturbine itself. The frequency range was limited to 1,600 Hz, and the analysed parameter—vibration velocity—was expressed in mm/s.
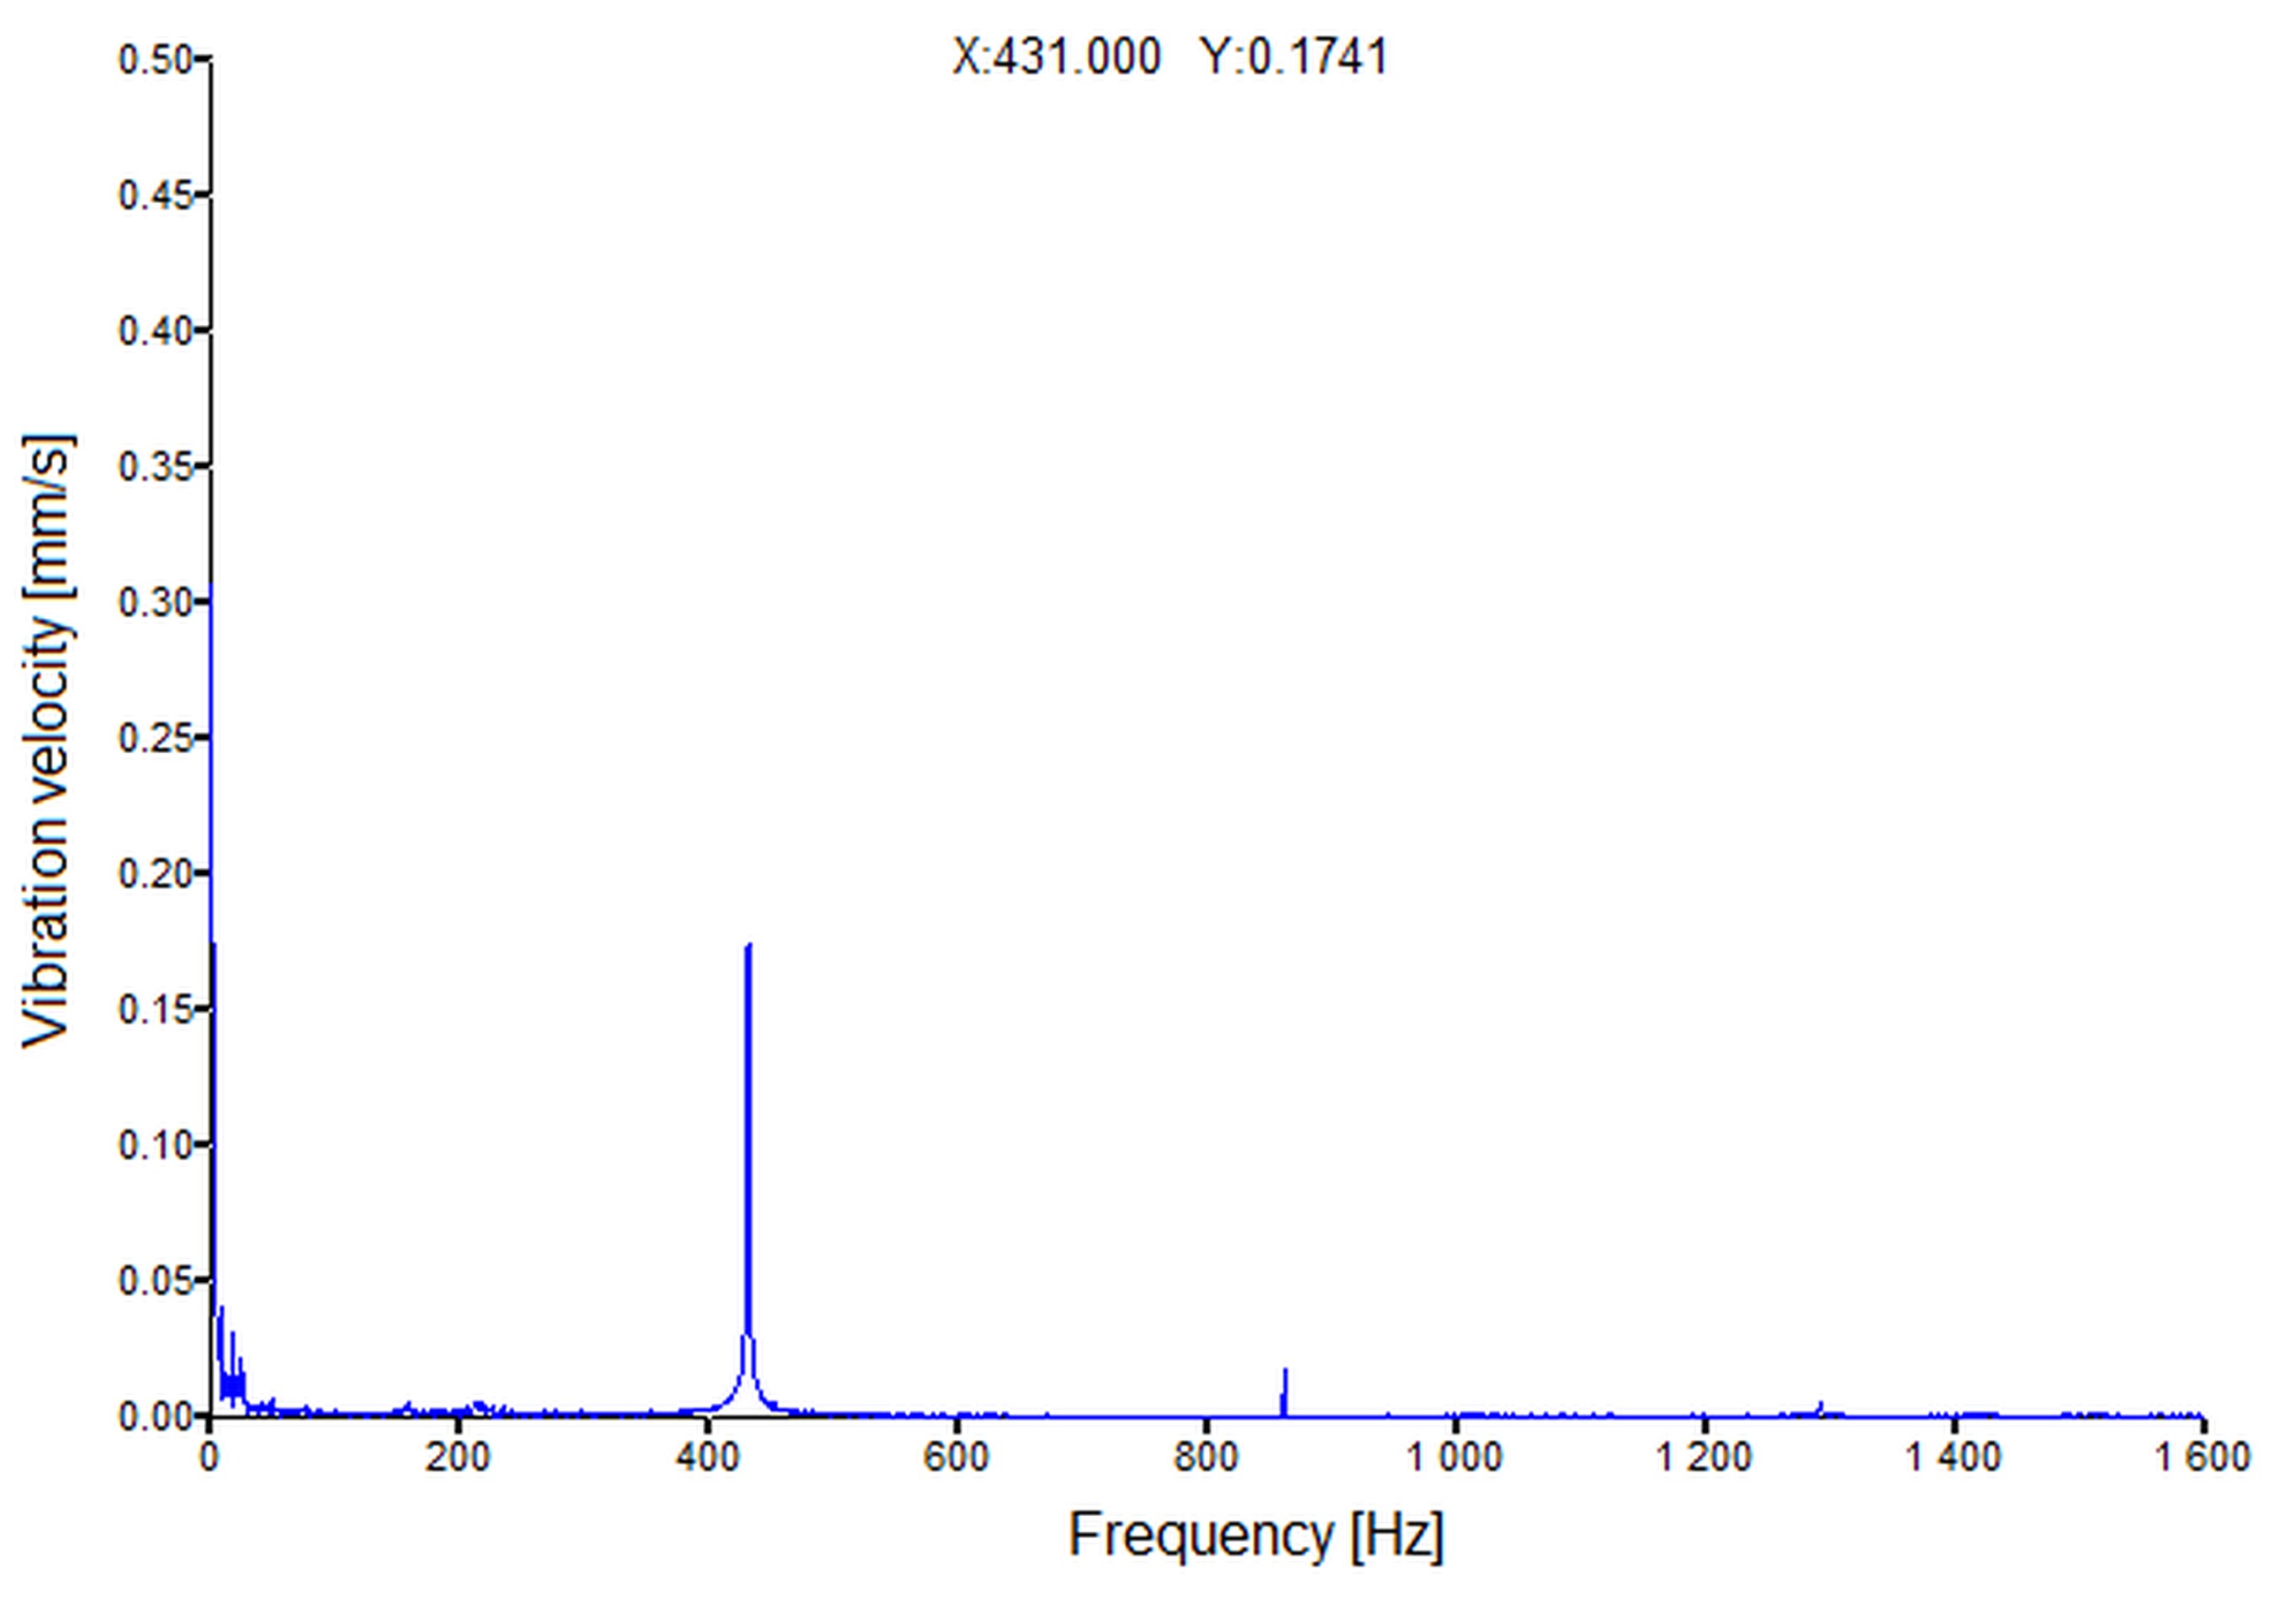
Fig. 17. Vibration velocity spectrum recorded on the microturbine casing in the vertical direction at a rotational speed of 25,860 rpm
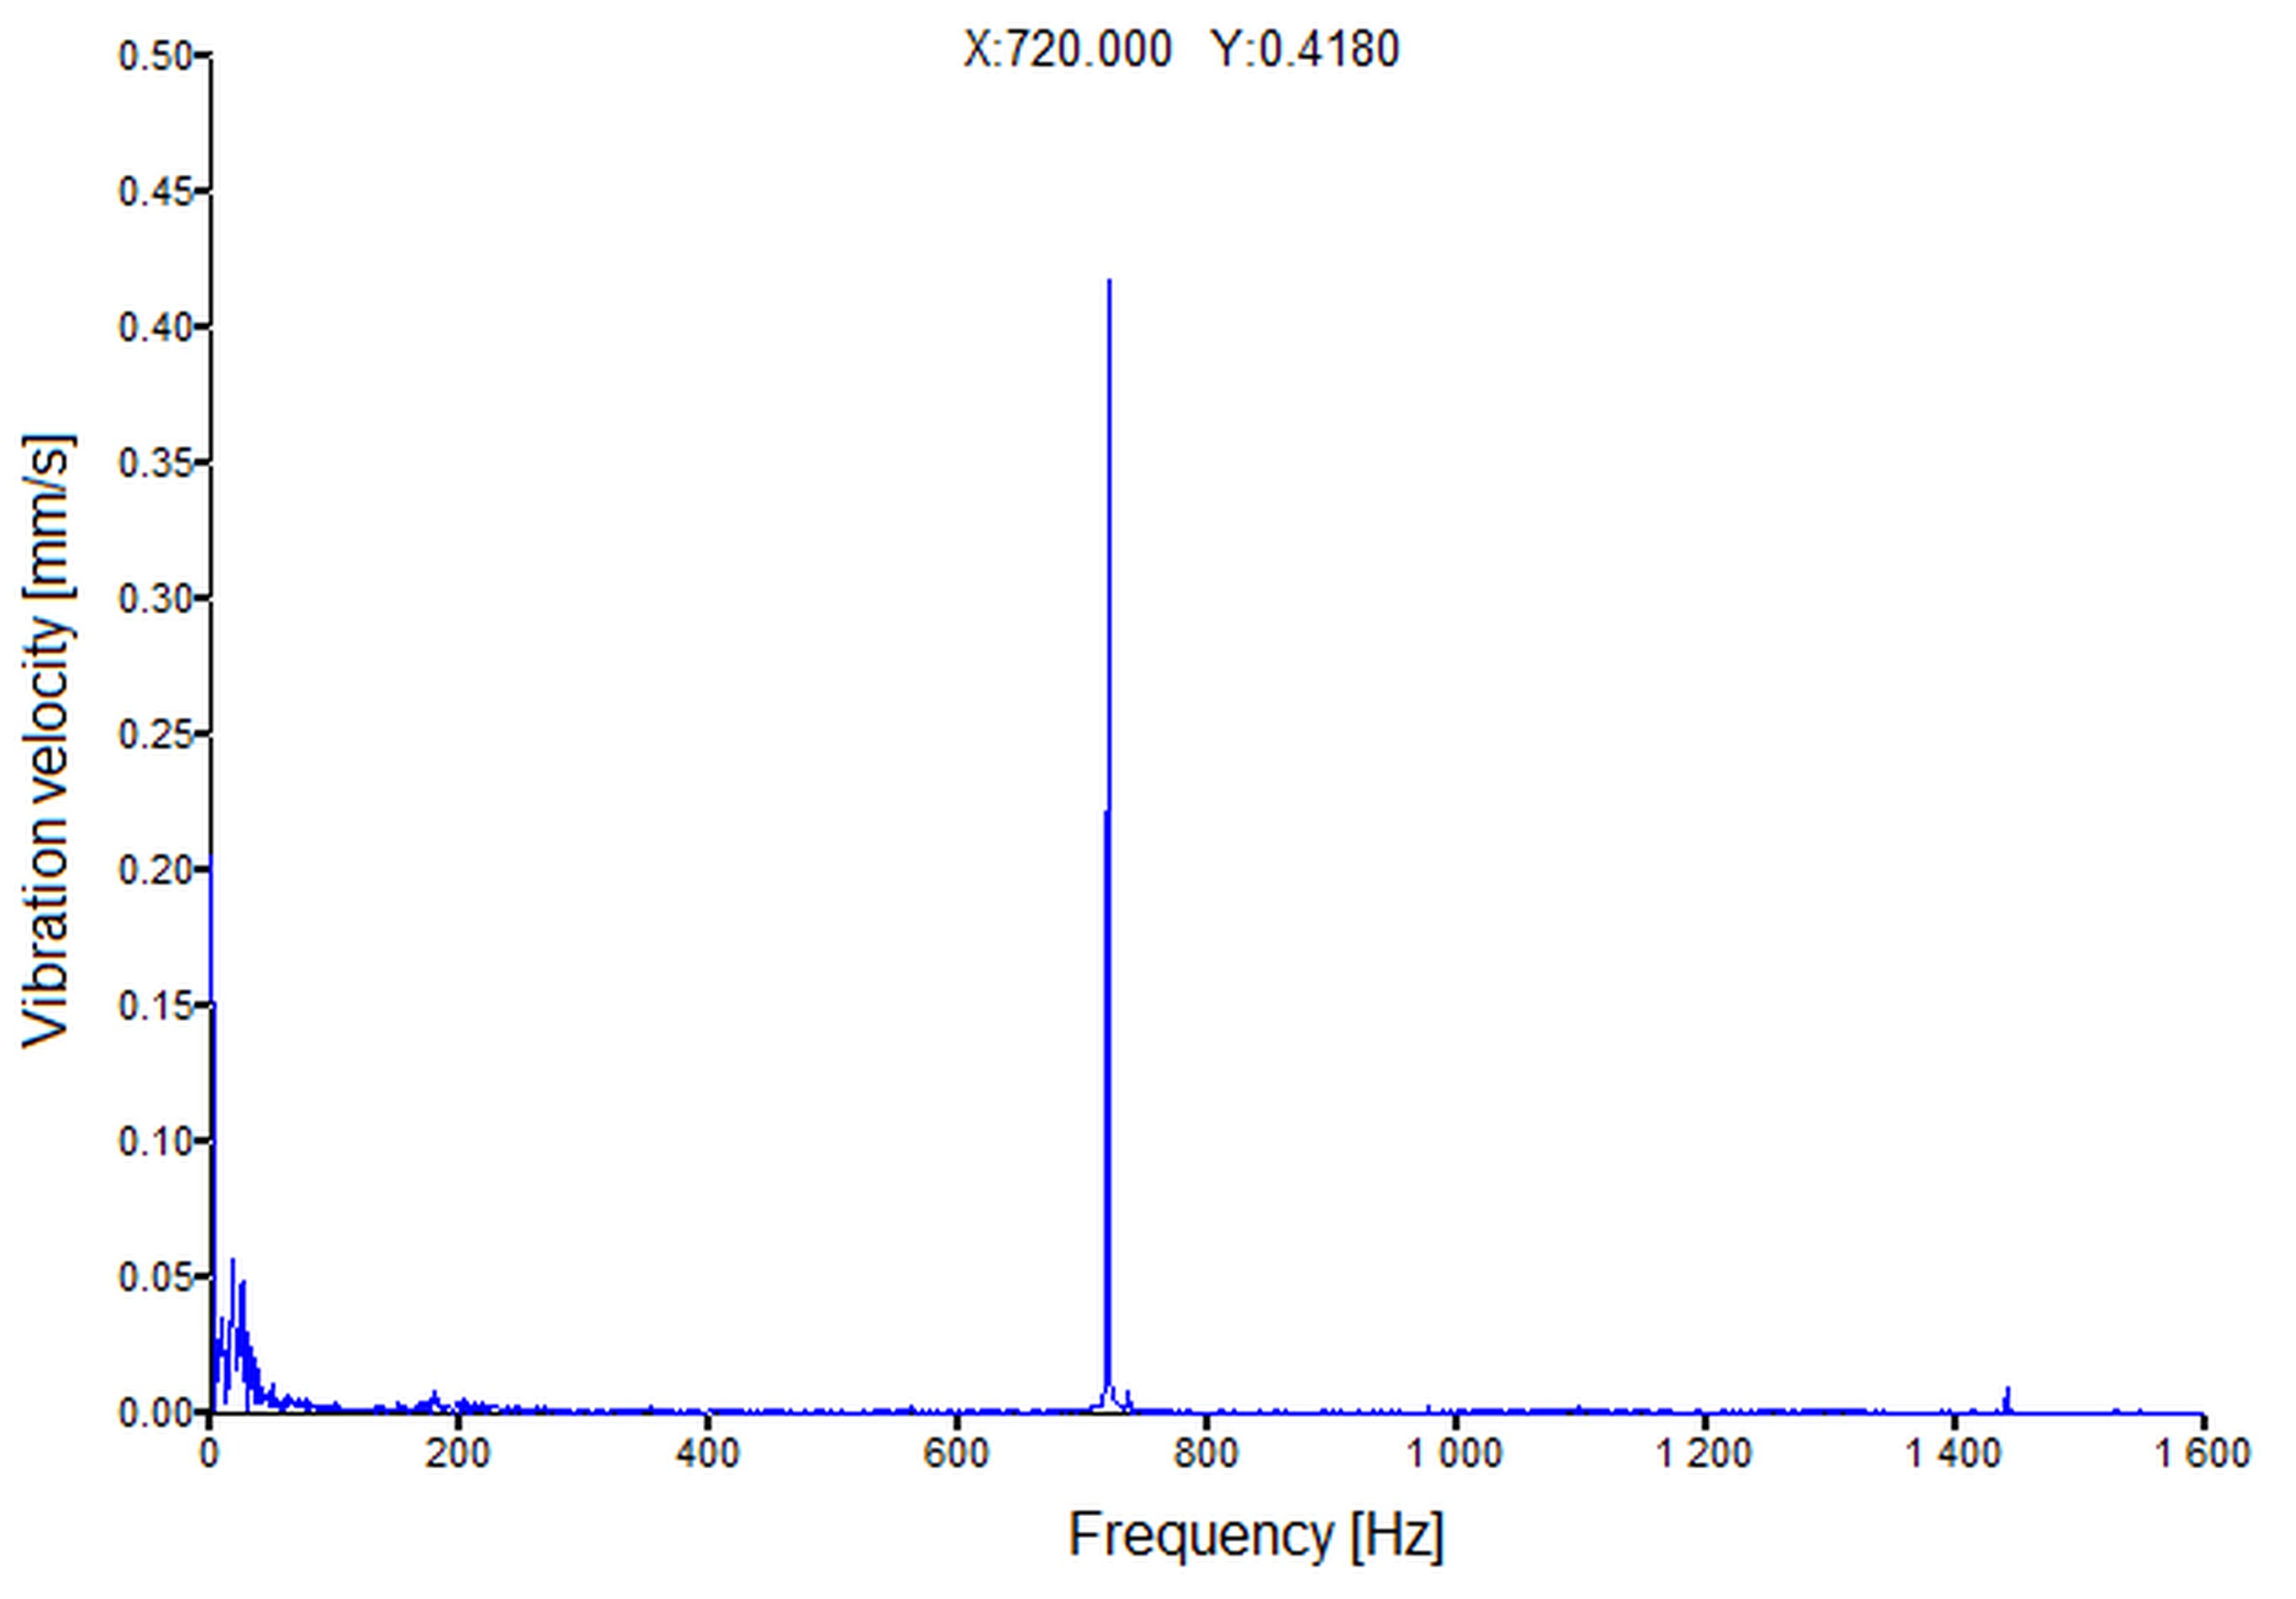
Fig. 18. Vibration velocity spectrum recorded on the microturbine casing in the vertical direction at a rotational speed of 43,200 rpm
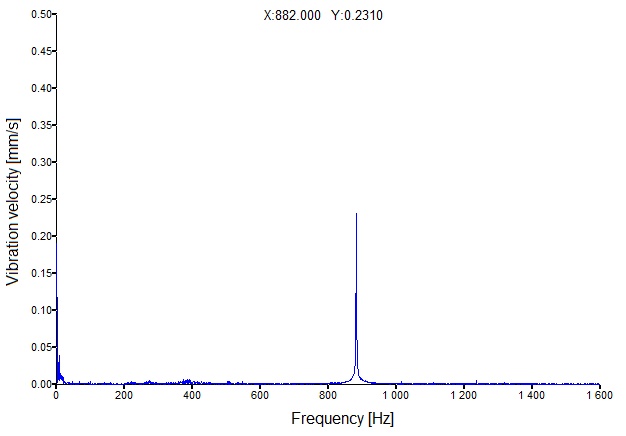
Fig. 19. Vibration velocity spectrum recorded on the microturbine casing in the vertical direction at a rotational speed of 52,920 rpm
It was found that the level and distribution of the microturbine vibrations were not a cause for concern. The velocity amplitude of the synchronous vibrations (with a frequency matching the rotor’s rotational speed) reached a maximum of 0.418 mm/s at a rotor speed of 43,200 rpm. At higher and lower rotational speeds of the rotor, the vibration level was lower; for example, at 25,860 rpm, the velocity amplitude of the synchronous vibrations was 0.174 mm/s, and at 52,920 rpm, it was 0.231 mm/s. Apart from the synchronous component (the so-called 1x), only at certain speeds could a slight increase in vibration components at other frequencies be observed, as can be seen, for example, in Fig. 17, where the appearance of a superharmonic component (the so-called 2x) can be discerned.
In addition, an increased level of vibration at the lowest frequencies (below 100 Hz) can be observed in the characteristics shown above. However, these vibrations were not caused by the operation of the microturbine, but by the vibrations of the remaining subassemblies of the test rig and the movement of people in the laboratory.
Referring to the relevant standards for the measurement and evaluation of vibrations in rotating machinery, it was found that the dynamic condition of the ORC microturbine studied was very good. According to the ISO 20816-1 standard, the permissible level of the RMS value of the vibration velocity (Vrms) measured on the casing should not exceed 0.71 mm/s for new machines with capacities of up to 15 kW. In contrast, the permissible vibration velocity level for such machines, allowing long-term operation without any restrictions, is 1.8 mm/s. In the case of the microturbine tested, the specified vibration levels were not exceeded, regardless of the rotational speed or the thermal and electrical load. There were also no other vibroacoustic symptoms indicative of incorrect operation of the microturbine or any damage within the machine’s rotating system.
CONCLUSIONS
Based on the research, it was determined, firstly, that irrespective of the heat source power, the electrical power output of the ORC system increased as the HFE-7100 medium flow rate increased. For heat source powers in the range of 12–20 kWt and HFE-7100 flow rates in the range of 30–60 g/s, the optimum generator load at which the electrical power output of the ORC system was at its maximum lay in the range of 2.6–5.1 Ω.
Secondly, it was found that, irrespective of the heat source power, the isentropic efficiency of the microturbine decreased as the HFE-7100 flow rate increased. For heat source powers in the range of 12–20 kWt and HFE-7100 flow rates between 30 and 60 g/s, the maximum isentropic efficiency of the microturbine lies between 50% and 70%, achieved with a load in the range of 3.5–10.5 Ω.
Thirdly, it was determined that the optimum load range for the microturbine generator, for a flow rate between 30 and 60 g/s and a heat source power between 12 and 20 kWt, at which the Carnot efficiency was maximised, was from 2.1 Ω to 9.3 Ω.
Fourthly, it was found that, irrespective of the heat source power, the efficiency of the ORC system increased with increasing working medium flow rate. For a heat source power in the range of 12–20 kWt and an HFE-7100 flow rate in the range of 30–60 g/s, the optimum generator load at which the ORC system efficiency reached its maximum lay in the range of 2.2–6.1 Ω.
Vibration measurements indicated that the microturbine operated correctly across the tested range of rotational speeds and under the preset thermal and electrical loads. The maximum vibration velocity recorded on the microturbine casing was 0.418 mm/s and occurred at 43,200 rpm. At other rotational speeds of the rotor, the level of synchronous vibrations was lower, and in none of the cases examined did the overall vibration level exceed the recommended values for new rotating machinery. This confirms that the developed ORC microturbine operated correctly under conditions typical of small cogeneration systems.
This research was conducted as part of the project entitled "Preliminary Studies of Thermodynamic Cycles Using the Low-Boiling Fluid 73DE" (2023/07/X/ST8/01193), funded by the National Science Centre in Poland.