
Introduction
The continuous advancement of technology generates a growing demand for novel materials with increasingly superior properties. One such area of interest involves materials designed to work under high-temperature conditions, particularly in industrial sectors such as aerospace, nuclear energy, and the oil and gas industry. In the case of components such as thermal and jet engines, efficiency increases with rising operating temperatures [1]. Therefore, it is crucial to search for materials that exhibit enhanced high-temperature performance compared to those commonly used today.
High-entropy alloys (HEAs) have emerged as a promising response to this demand, attracting significant scientific interest due to their vast potential in both functional and structural material applications. Existing studies indicate that many HEA compositions are characterized by high melting points, excellent phase stability, and outstanding mechanical properties at elevated temperatures [2-5]. These alloys are typically composed of a minimum of five principal elements in equal or near-equal atomic proportions. The incorporation of alloying additives is also feasible, enabling the development of a significantly broader range of compositions than is possible with conventional alloy design approaches [6, 7]. This, in turn, provides a wide scope for tailoring their properties to meet specific application requirements.
The AlCoCrFeNi alloy was one of the first HEAs to be thoroughly investigated, and its mechanical properties have proven to be promising [8-10]. Its ability to maintain good properties at elevated temperatures makes it a potential candidate to replace currently used nickel-based superalloys [11, 12], whose operating temperatures are limited to approximately 1300 °C [13]. Numerous studies in the literature have examined the properties of this alloy and the effects of varying its constituent elements [14-17]. Among these, aluminum has the most significant influence: increasing its content leads to a phase transformation from face-centered cubic (fcc) to a mixture of fcc and body-centered cubic (bcc), and then to a fully bcc structure. This transformation results in increased hardness but reduced ductility of the alloy [18, 19]. The aluminum content in the AlxCoCrFeNi alloy also affects its high-temperature oxidation resistance-higher concentrations promote the formation of a continuous Al2O3 layer, thereby improving oxidation resistance [20].
The Al0.7CoCrFeNi alloy represents a compromise between ductility and hardness; however, there is a limited number of studies dedicated to this specific composition [21-24]. Mohanty et al. [25] compared the high-temperature oxidation resistance and microhardness of Al0.3CoCrFeNi and Al0.7CoCrFeNi high-entropy alloys fabricated via laser cladding. The alloy with higher aluminum content exhibited a microhardness of approximately 380 HV, whereas the lower aluminum variant showed a hardness of around 170 HV. In the Al0.3CoCrFeNi alloy, oxidation led to the formation of a thick external Cr2O3 layer and a discontinuous Al2O3 subscale in the form of coarse precipitates. Increasing the aluminum contribution resulted in a thinner Cr2O3 scale and the development of a continuous Al2O3 layer, whose thickness increased with oxidation time, thereby enhancing the alloy’s oxidation resistance. Some researchers highlight the potential to modify the functional properties of that HEAs by adding specific elements in appropriate amounts-for example, molybdenum and vanadium to increase strength [26, 27], manganese to improve corrosion resistance [28], and silicon to enhance wear resistance [29].
It was decided to study the effect of titanium addition on this alloy, since according to the literature it can improve oxidation resistance at high temperatures. Liang et al. [30] studied the effect of titanium content on the oxidation behaviour of AlCoCrNiTix high-entropy alloys at 900 °C. The results showed that an alloy containing Ti0.1 exhibited optimal behaviour, reducing the oxidation rate by two orders of magnitude and promoting the formation of a protective α-Al2O3 layer, highlighting the crucial role of Ti in stabilizing the oxide scale and preventing its spallation. The sample without titanium exhibited irregular oxidation, resulting in an incomplete oxide layer with numerous pores. In contrast, the oxides formed on the Ti0.1, Ti0.4, Ti0.7, and Ti1.0 samples were well-developed and primarily composed of Al2O3, with an increasing contribution of Cr2O3. In the AlCrFeNiTi alloy, initial selective oxidation occurs between Ti atoms on the alloy surface and oxygen from the test atmosphere, leading to the formation of an outer TiO2 layer that limits further oxygen diffusion into the alloy. Subsequently, the oxygen present within the alloy reacts selectively with Al atoms, resulting in the formation of an underlying α-Al2O3 sublayer [31]. The beneficial effect of titanium on high-temperature oxidation has also been confirmed for other high-entropy alloys [32, 33].
The results of this study make a valuable contribution to the broader understanding of the high-entropy Al0.7CoCrFeNi alloy, particularly regarding its oxidation resistance at elevated temperatures. By analyzing the alloy's response to oxidizing environments, this work provides insight into the complex interactions between its multi-element composition and the formation of protective oxide scales. According to the literature, the incorporation of titanium into the alloy matrix can influence the oxidation mechanism not only by altering the thermodynamic stability of the oxide phases but also by modifying the diffusion pathways of reactive elements as well as their activities. The present research significantly expands the current knowledge of titanium’s effect on the high-temperature oxidation behaviour of the Al0.7CoCrFeNi alloy and lays the groundwork for future studies aimed at optimizing its performance in demanding thermal environments.
Materials And Methods
The chemical composition of studied high entropy alloys (HEA) was selected based on thermodynamical calculations of phase stabilities performed using CALPHAD. Stability of phases was calculated using ThemoCalc software. Projected chemical composition of Al0.7CoCrFeNiTix (x=0.05, 0.2, 0.5) HEAs are given in Table 1. In the following, Al0.7CrFeCoNi will be identified as the reference alloy (Ref), and the others depending on the titanium content will be called Ref+0.05Ti, Ref+0.2Ti and Ref+0.5Ti, respectively.
Tab. 1
Projected chemical composition of studied HEAs
| Alloys | Element [at. %] | |||||
| Al | Co | Cr | Fe | Ni | Ti | |
| Ref | 14.89 | 21.28 | 21.28 | 21.28 | 21.28 | - |
| Ref+0.05Ti | 14.74 | 21.05 | 21.05 | 21.05 | 21.05 | 1.05 |
| Ref+0.02Ti | 14.28 | 20.41 | 20.41 | 20.41 | 20.41 | 4.08 |
| Ref+0.5Ti | 13.46 | 19.23 | 19.23 | 19.23 | 19.23 | 9.62 |
HEAs were produced by ARC-Melting method. At the first step high purity powders (purity over 99.99%) were weighted and mixed using ball mill for 2 hours to ensure a uniform powder distribution. Such prepared powders mixtures were pressed into pellets with diameters of 15 mm and height approximately 12 mm using Herzog hydraulic press made by Siemens. Such prepared pellets were melted in ARC-Melter furnace made by Edmund Buehler by following procedure. Prior melting reaction chamber was triple pumped down up to 2⸱10-2 mbar pressure using oil pump and flushed by argon with 5N purity. After third flushing high vacuum at level of 5⸱10-5 mbar is produced using diffusion pump. After reaching of pressure 5⸱10-5 mbar reaction chamber is fulfilled with small amount Ar to ensure occurrence of plasma. After such preparation arc-melting process itself is done. The arc melting is processed till the pellets are completely melted through. After complete melting of pellets they were turned around by 180° and remelted again. Such procedure was repeated 4 times to ensure uniform distribution of chemical composition through the sample. After melting procedure samples were cooled down with the furnace in the Ar atmosphere. After this samples were removed from the furnace and further cooled down to room temperature. From such prepared alloys rectangular samples with dimensions of 10 x 10 x 5 mm were machined. All surface of cut specimens were ground up to 1200 grit sand paper. Ground specimens were cleaned using ethanol in ultrasonic cleaner prior exposure to high temperature. High temperature oxidation tests were performed in Nabertherm SN 313602 furnace at temperature 1000 °C up to 1000 hours of exposure in laboratory air. After oxidation for 24, 100 and 1000 hours mass change of each sample was measured using microbalance KERN ABT 120-4M made of KERN & SOHN GmbH with accuracy of 10-4 g to elucidate the oxidation kinetics. To ensure the oxidation results repeatability two samples per each alloy type were exposed. The oxidation tests were performed under isothermal conditions without thermal cycling. After reaching the required oxidation time, selected samples were removed and cooled to room temperature in ambient air prior to mass measurements. No oxide scale spallation during cooling was observed. Minor cracking and local spallation visible in some samples are most likely related to sample handling between analytical procedures. Only minor discrepancies were observed, thus no error bars were introduced to the mass change plot. After oxidation sample surfaces were observed by SEM in terms of formed oxide scales morphology. Selected samples were subjected to chemical composition measurement using glow discharge optical emission spectrometer (GD-OES). The intensity of light emission as function of sputtering time was obtained. The results were recalculated to show concentration expressed in at. % as function of sputtering time using so-called relative sensitivity factors (RSF). Quantification procedure was described elsewhere [34-36]. After GD-OES measurement samples surfaces were sputtered by gold and electroplated with Ni coating to protect oxide scale from damage during cross-sections preparation and to ensure good contrast between oxide scale and the resin. Cross-sections for SEM observation were prepared using standard metallographic procedure with the last step of polishing using 0.05µm grain dimensions. Cross-sections were analyzed using Phenom XL scanning electron microscope equipped with EDS detector to investigate the chemical composition of formed oxide scales and HEA microstructures as well as for elemental mappings showing elements distribution over the investigated surfaces shown in BSE images.
Results And Discussion
Microstructure of the studied alloys
Measured chemical composition of obtained Al0.7CoCrFeNiTix (x=0, 0.05, 0.2, 0.5) HEAs is given in Table 2. A comparison between the chemical compositions of the obtained alloys (Table 2) and the designed compositions (Table 1) reveals a close agreement. The most significant differences are observed in the aluminum content, which is likely due to the evaporation of this element during the melting process, as aluminum has the lowest melting point among the alloying elements [37].
Tab. 2
Measured chemical composition of studied HEAs
| Alloys | Element [at. %] | |||||
| Al | Co | Cr | Fe | Ni | Ti | |
| Ref | 13.5 | 21.1 | 22.1 | 21.9 | 21.4 | - |
| Ref+0.05Ti | 13.2 | 19.9 | 22.5 | 21.9 | 21.3 | 1.3 |
| Ref+0.02Ti | 12.9 | 18.9 | 22.1 | 21.5 | 20.5 | 4.2 |
| Ref+0.5Ti | 11.8 | 21.5 | 19.1 | 19.0 | 18.6 | 10.0 |
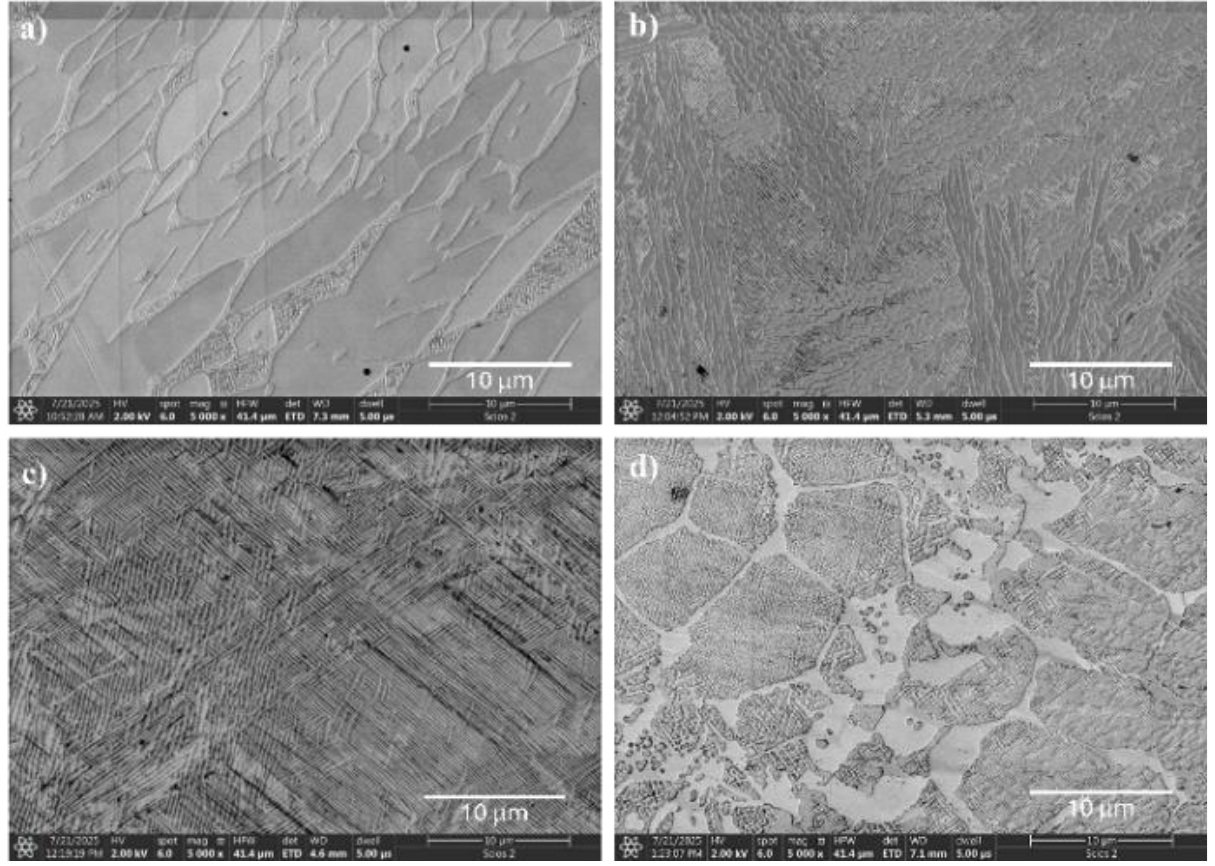
Figure 1 shows representative SEM images of the microstructures of the investigated materials at 5000x magnification. This magnification was chosen due to the extremely fine dispersion of microstructural features, which are smaller than one micrometer. The microstructure of the Ref alloy without titanium (Fig. 1a) is typical for this class of high-entropy alloys with a molar aluminum content below 1. In the case of the reference alloy, the microstructure was previously described in detail by Nowak [38] as lamellar-dendritic. Two highly refined phases can be distinguished, corresponding to A2 and B2 crystal structures, which differ in the concentration of the main alloying elements [39]. The addition of titanium in the amount of 0.05 had virtually no effect on the alloy’s microstructure, except for a further refinement of the individual phases (Fig. 1b). At a titanium content increased to 0.2, the dendritic morphology is replaced by grains containing a plate-like mixture of phases (Fig. 1c). In contrast, the microstructure of the Ref+0.5Ti sample differs significantly. A mosaic-like structure is observed, characterized by pronounced elemental segregation within phase precipitates located in the intergranular regions. Similar microstructures were reported for the AlCrFeNiTi alloy without cobalt in the study by Zhi [40].
Oxidation kinetics
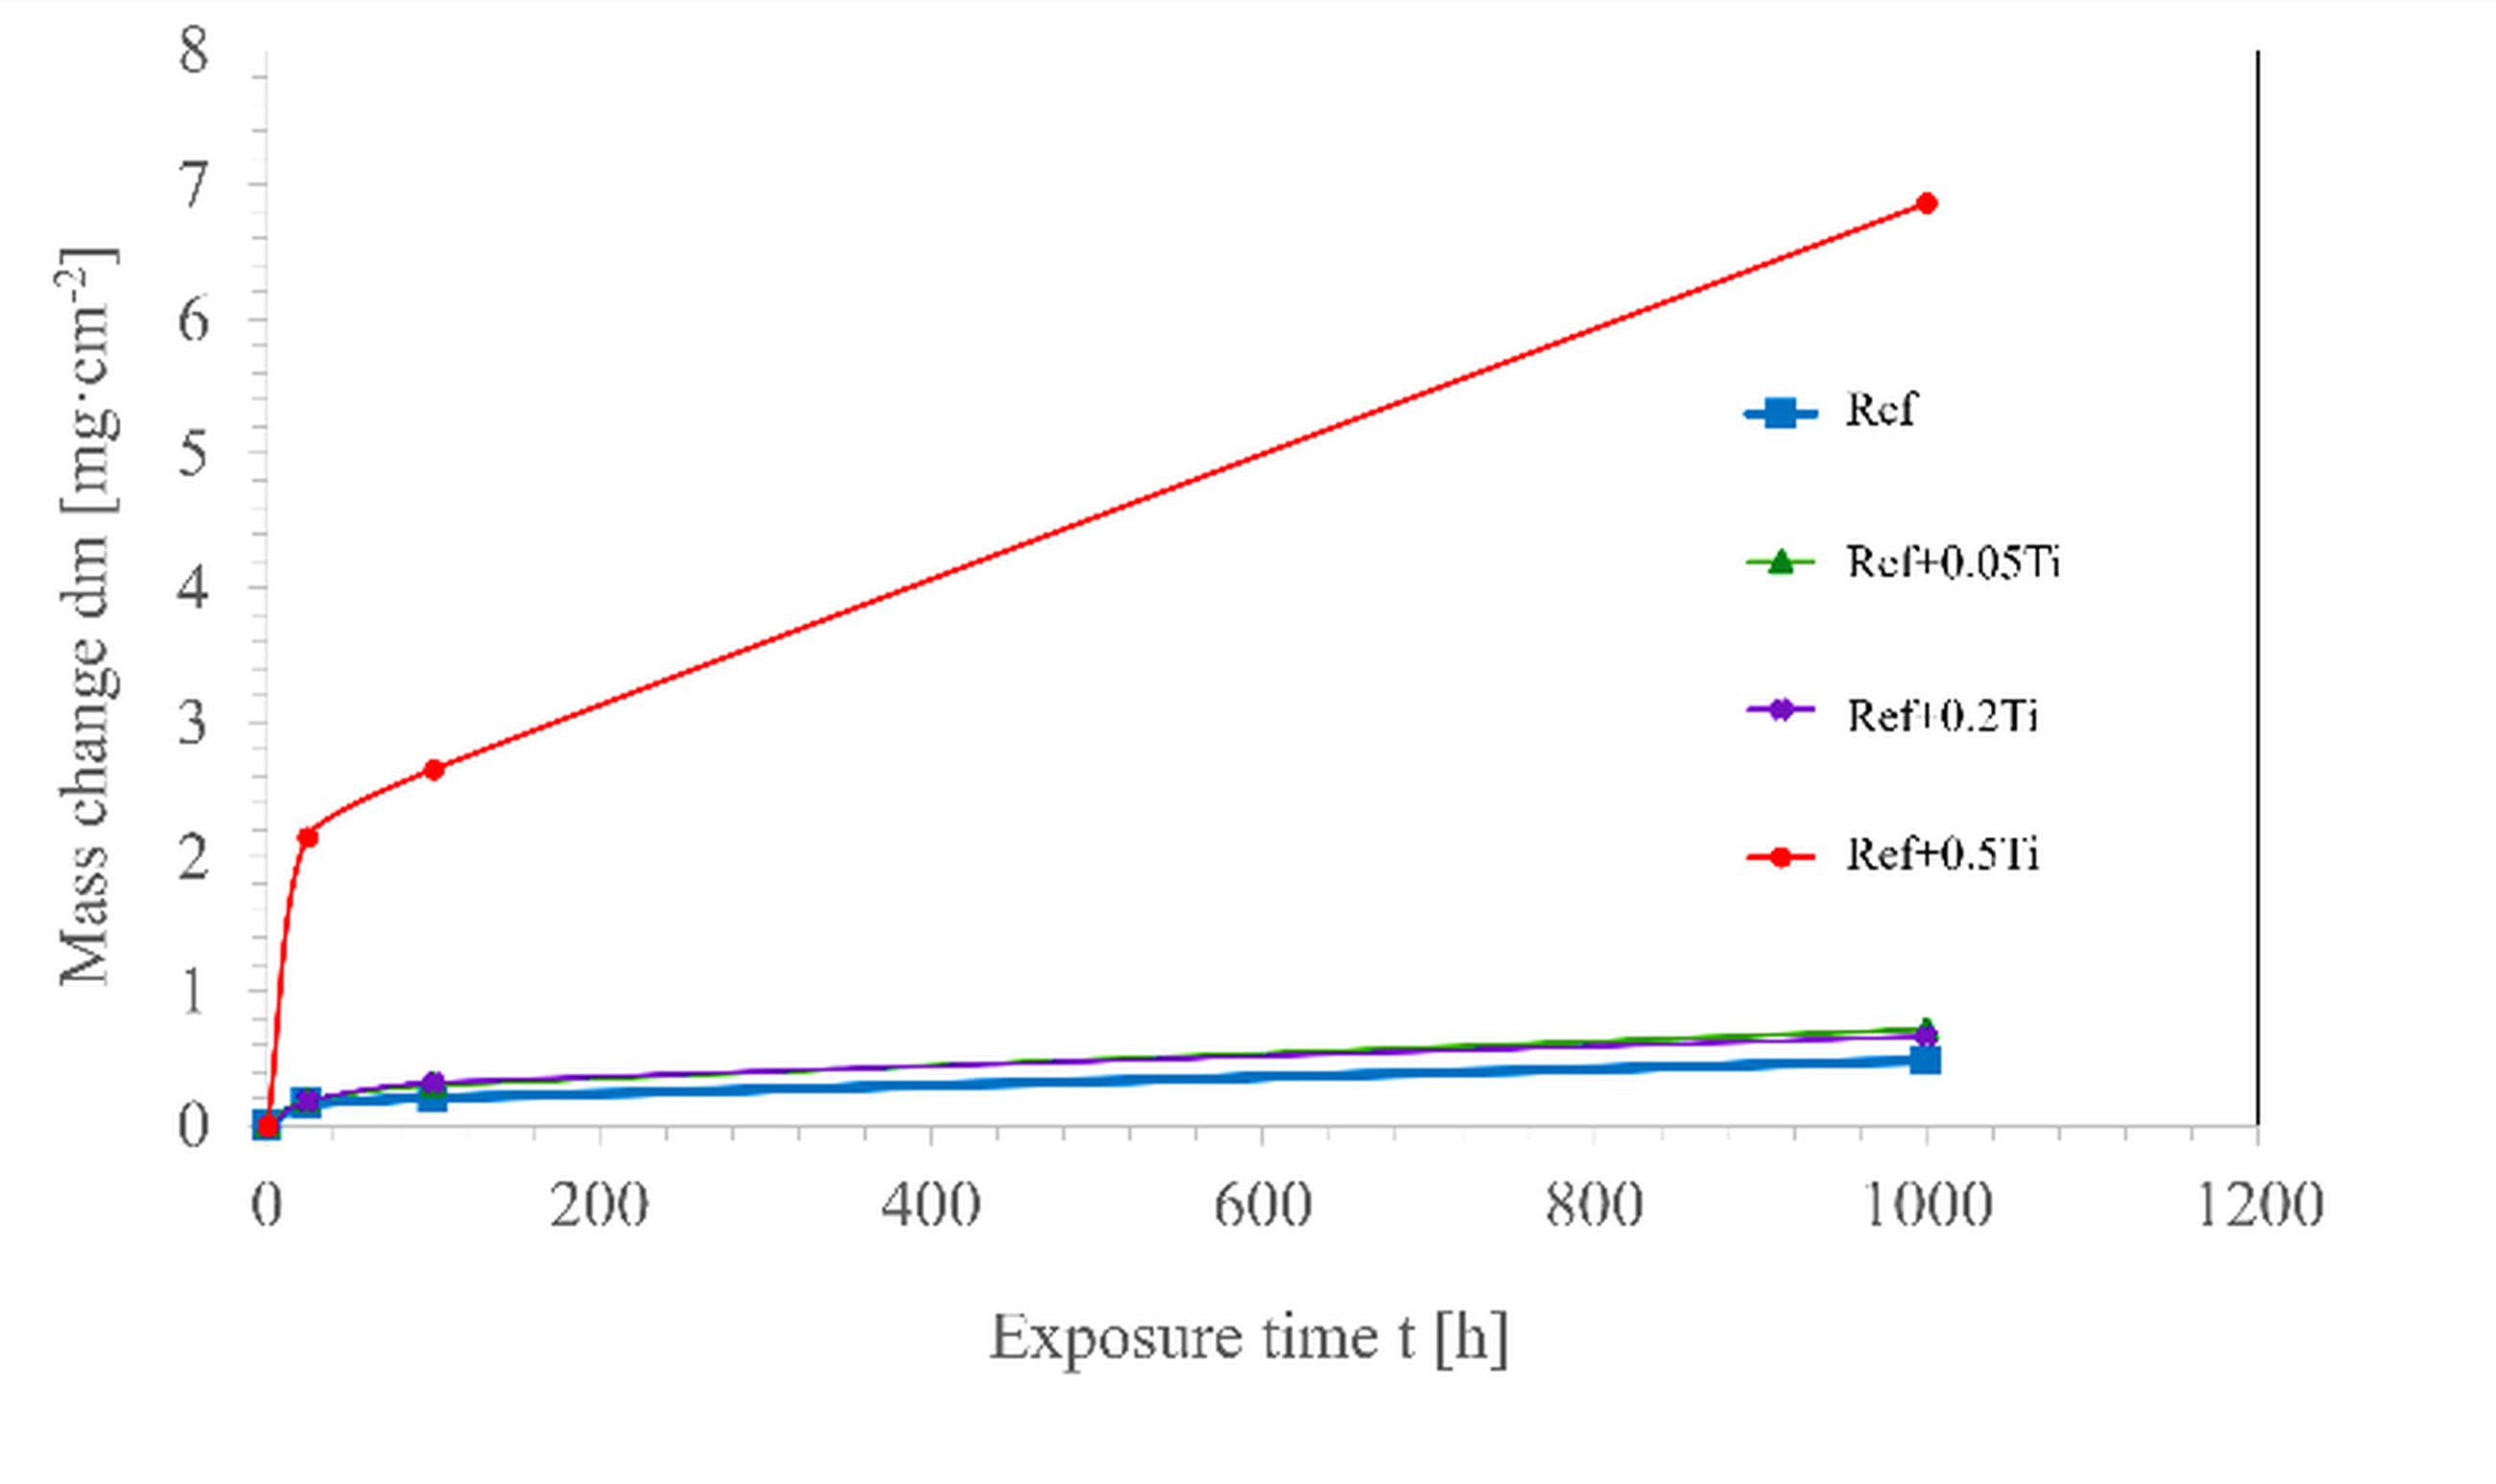
Figure 2 presents curves illustrating the relative mass changes of the investigated materials during air exposure at 1000 °C up to 1000 h. For the Ref alloy, the mass change remains minimal even after 1000 hours of exposure in air, indicating excellent resistance to high-temperature oxidation. Its weight gain after 1000 h of exposure reach about 0.2 mg⸱cm-2. The addition of titanium in the amounts of 0.05 and 0.2 results in only a slight increase in weight gain, with the curves following a similar trend to that of the base alloy. Similar correlations for the AlCoCrFeNi alloy were reported by Butler [20]; however, in that case, the relative mass change after 100 hours of high-temperature oxidation at 1050 °C was approximately ten times greater, which may have been due to differences in sample surface preparation. The samples were ground to a 1200 grit SiC surface finish, cleaned with acetone/isopropanol, and placed in annealed alumina boats prior to oxidation testing. In contrast, Li et al. [12] observed even greater relative mass changes when investigating the effect of copper addition on the high-temperature oxidation behaviour of a similar alloy.
Surprisingly, the Ref+0.5Ti alloy exhibited significantly higher mass change after air exposure at 1000 °C up to 1000 h. Within the first 24 hours, the weight gain of the samples was more than ten times higher than that of the titanium-free alloy and those with lower titanium content. Although the oxidation rate decreased in the subsequent hours of the test, the weight gain remained substantially higher compared to the other investigated materials. This result indicates that the oxidation products in this case do not provide effective protection. A similar negative effect of increased titanium content on the oxidation kinetics of AlCoCrNi alloys (without Fe) was reported by Liang [30]. In contrast, Zhang et al. [33] observed the opposite trend for CoCrMoNbTix alloys (without aluminum) used as laser-cladded coatings, where increasing titanium content led to a reduction in weight gain. These differences are attributed to the composition and quality of the oxide layers formed on the sample surfaces.
In this context, a detailed analysis of the oxide phases formed during high-temperature exposure appears to be particularly important.
GD-OES analysis
The obtained results of glow discharge optical emission spectrometry analysis of the investigated materials revealed significant differences in the chemical composition of the surface layers after high-temperature oxidation, resulting from the modification of the alloy composition through titanium addition. A graphical representation is provided in Figure 3.
After 1000 hours of high-temperature oxidation of the Ref alloy (Fig. 3a), aluminum diffusion to the sample surface is clearly observed. The aluminum concentration changes with the oxygen content, indicating the formation of an aluminum oxide layer on the surface. Only at the depth of the layer corresponding to approximately 500-800 seconds of sputtering time is a slight depletion of aluminum compared to the bulk material, due to the diffusion of Al atoms to the surface. In contrast, the concentrations of the other alloying elements in the surface layer are significantly lower, what indicates formation of relatively pure Al2O3 oxide scale.
The GD-OES profile of the Ref+0.05Ti alloy (Fig. 3b) indicates more intense elemental diffusion compared to the base alloy. The oxide layer is thicker, as evidenced by the deeper oxygen penetration. The surface is composed almost exclusively of aluminum oxide, while the concentrations of other metallic elements in the surface layer are significantly below 1 at.%.
In the case of the Ref+0.2Ti alloy (Fig. 3c), the GD-OES profile shows a similar trend. However, a slightly higher presence of alloying elements is observed in the surface layer-approximately 1 at. % for chromium and iron, and around 0.2 at. % for nickel and cobalt. Titanium diffusion to the surface is also clearly visible.
In contrast, increasing the titanium content to 0.5 mol leads to a distinct change in the oxide layer composition after just 100 hours of oxidation (Fig. 3d). The surface is dominated by titanium and chromium oxides, while aluminum oxide is located beneath the outermost layer.
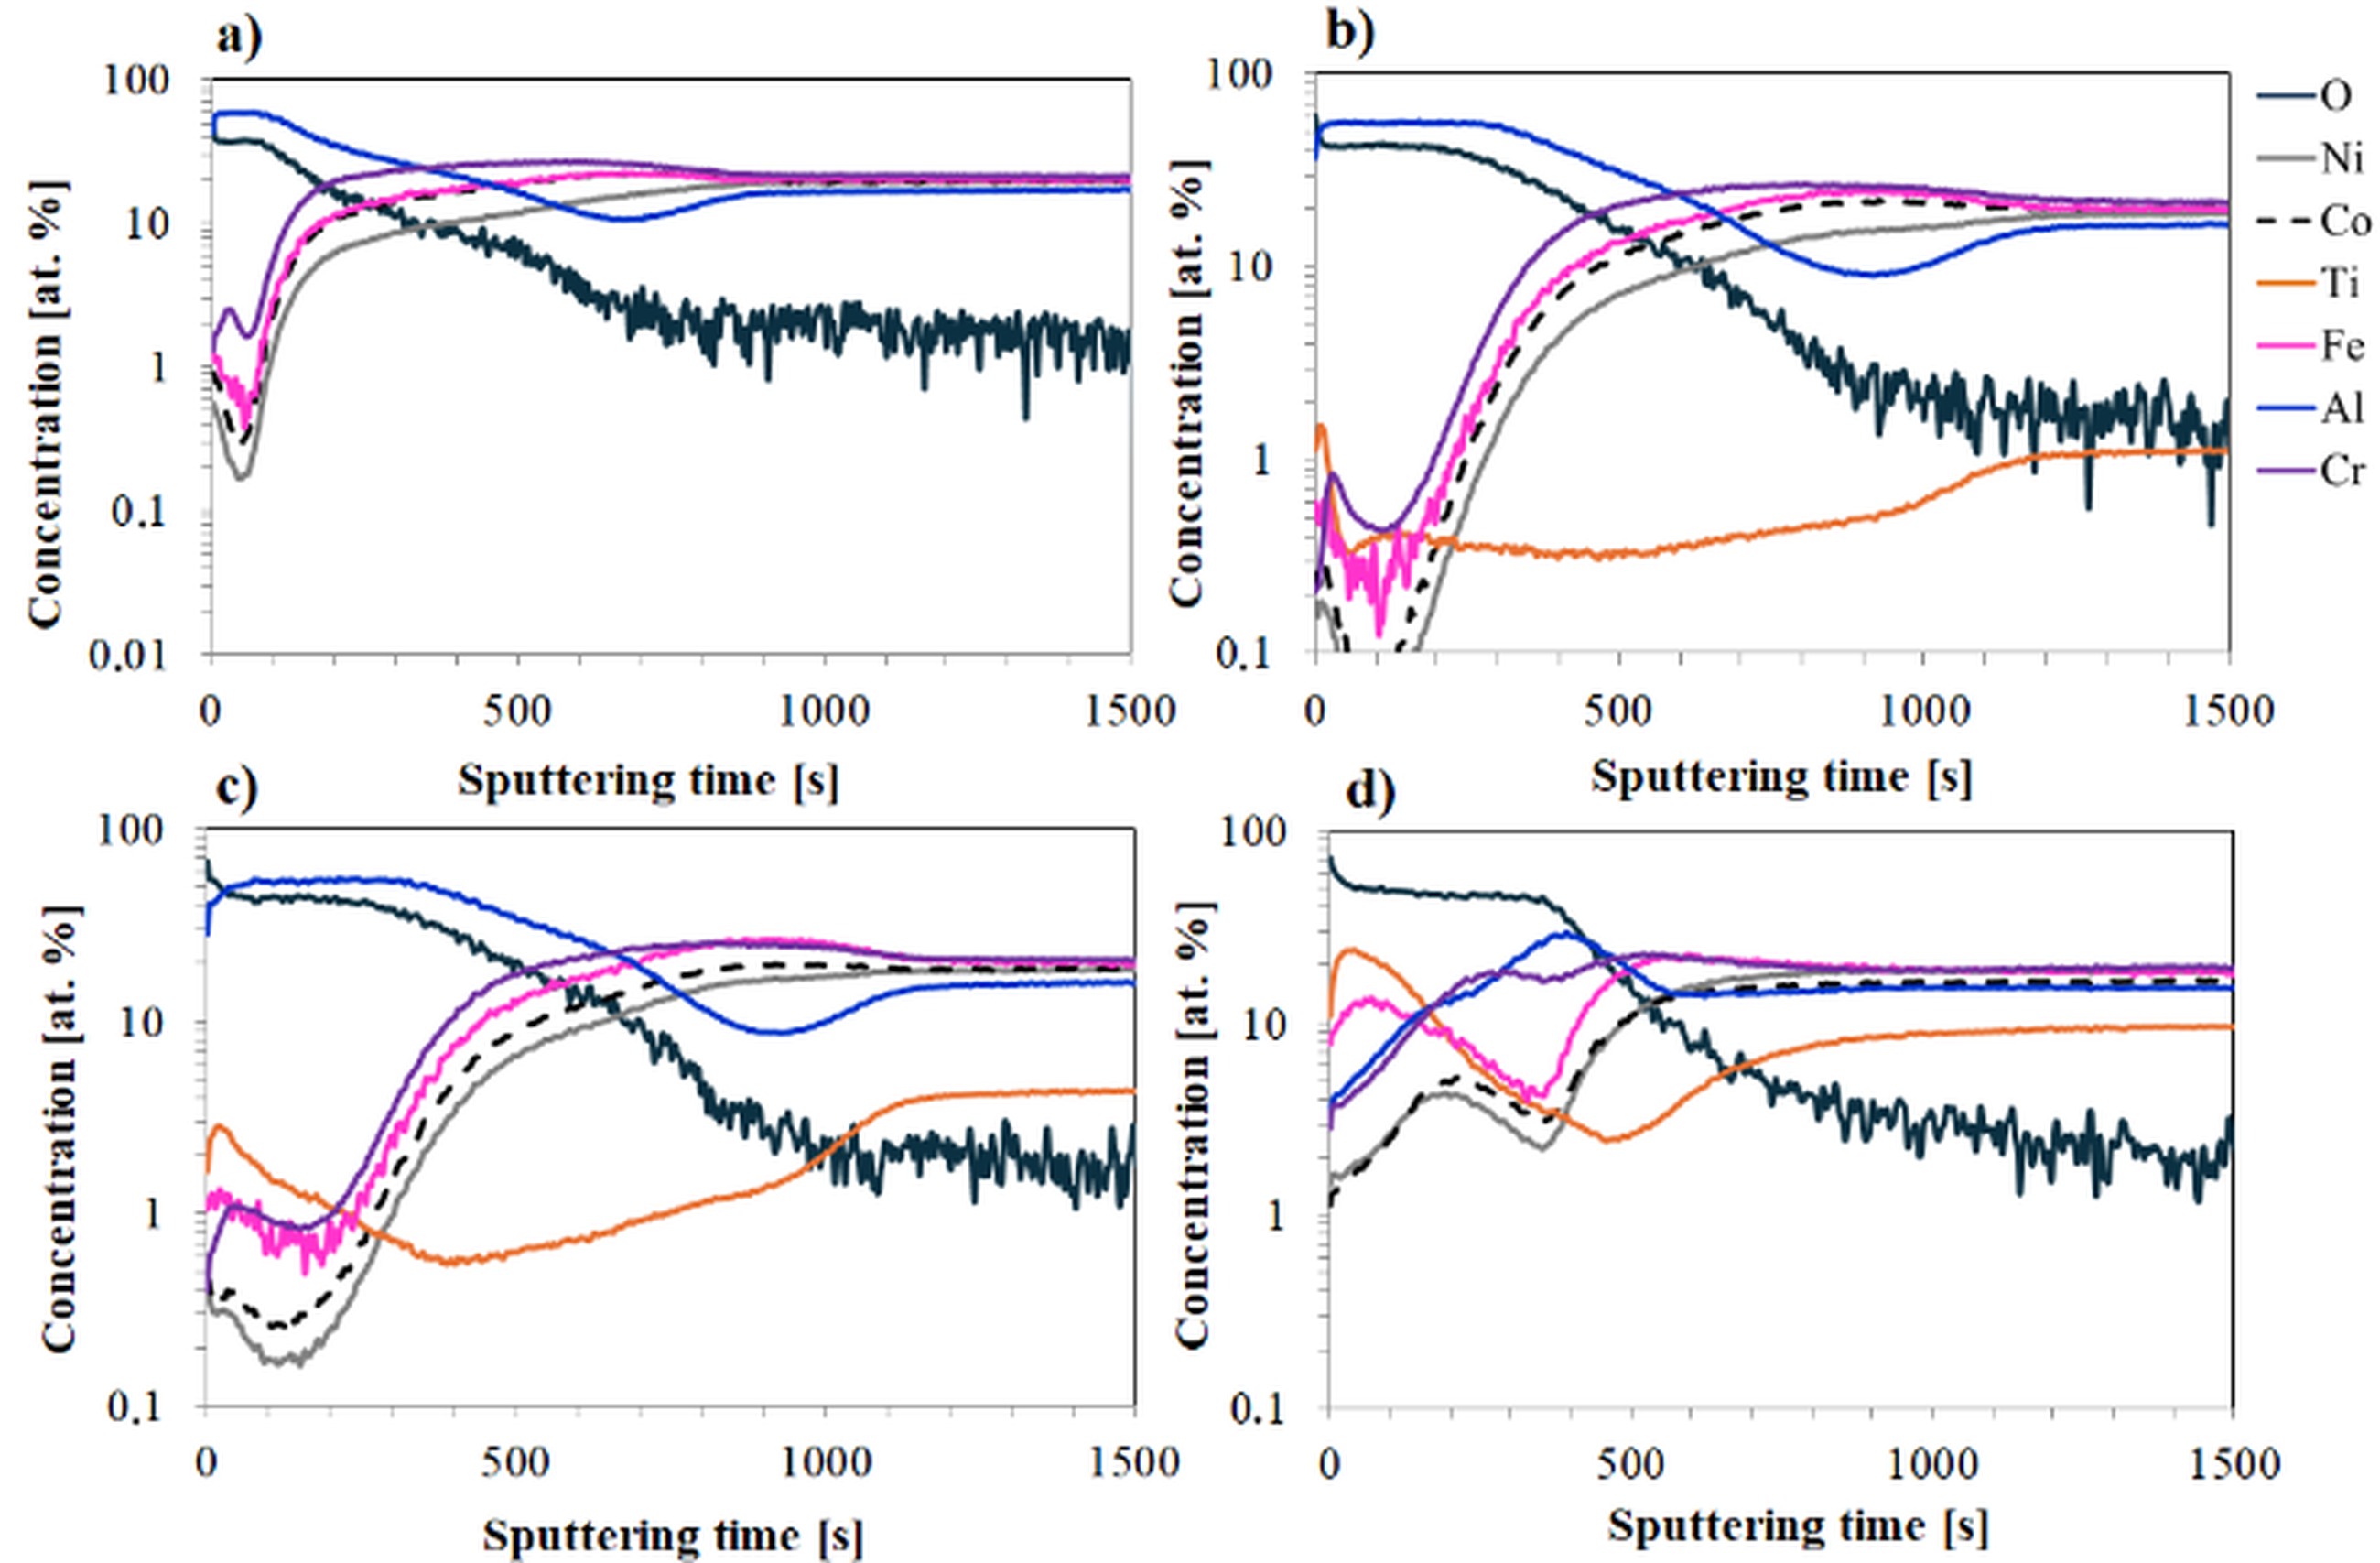
Fig. 3. GD-OES profiles of tested alloys after air oxidation: a) Ref for 1000 h, b) Ref+0.05Ti for 1000 h, c) Ref+0.2Ti for 1000 h, d) Ref+0.5Ti for 100 h
The evolution of GD-OES profiles during the oxidation process of individual materials provides further insight into the surface oxide layer transformations. Figures 4–6 illustrate the evolution of surface composition in the Ref alloy and in the Ref+0.2Ti and Ref+0.5Ti alloys after 24, 100, and 1000 h of oxidation.
For the Ref alloy (Fig. 4), the profiles differ only in the thickness of the oxide layer, which increases with oxidation time. The surface is dominated by aluminum and oxygen, with their concentrations decreasing with sputtering time. Beneath the aluminum oxide layer, a noticeable depletion of aluminum is observed compared to the bulk material, indicating the diffusion of atoms of this element to the surface. The concentrations of the other alloying elements increase toward the core of the sample.
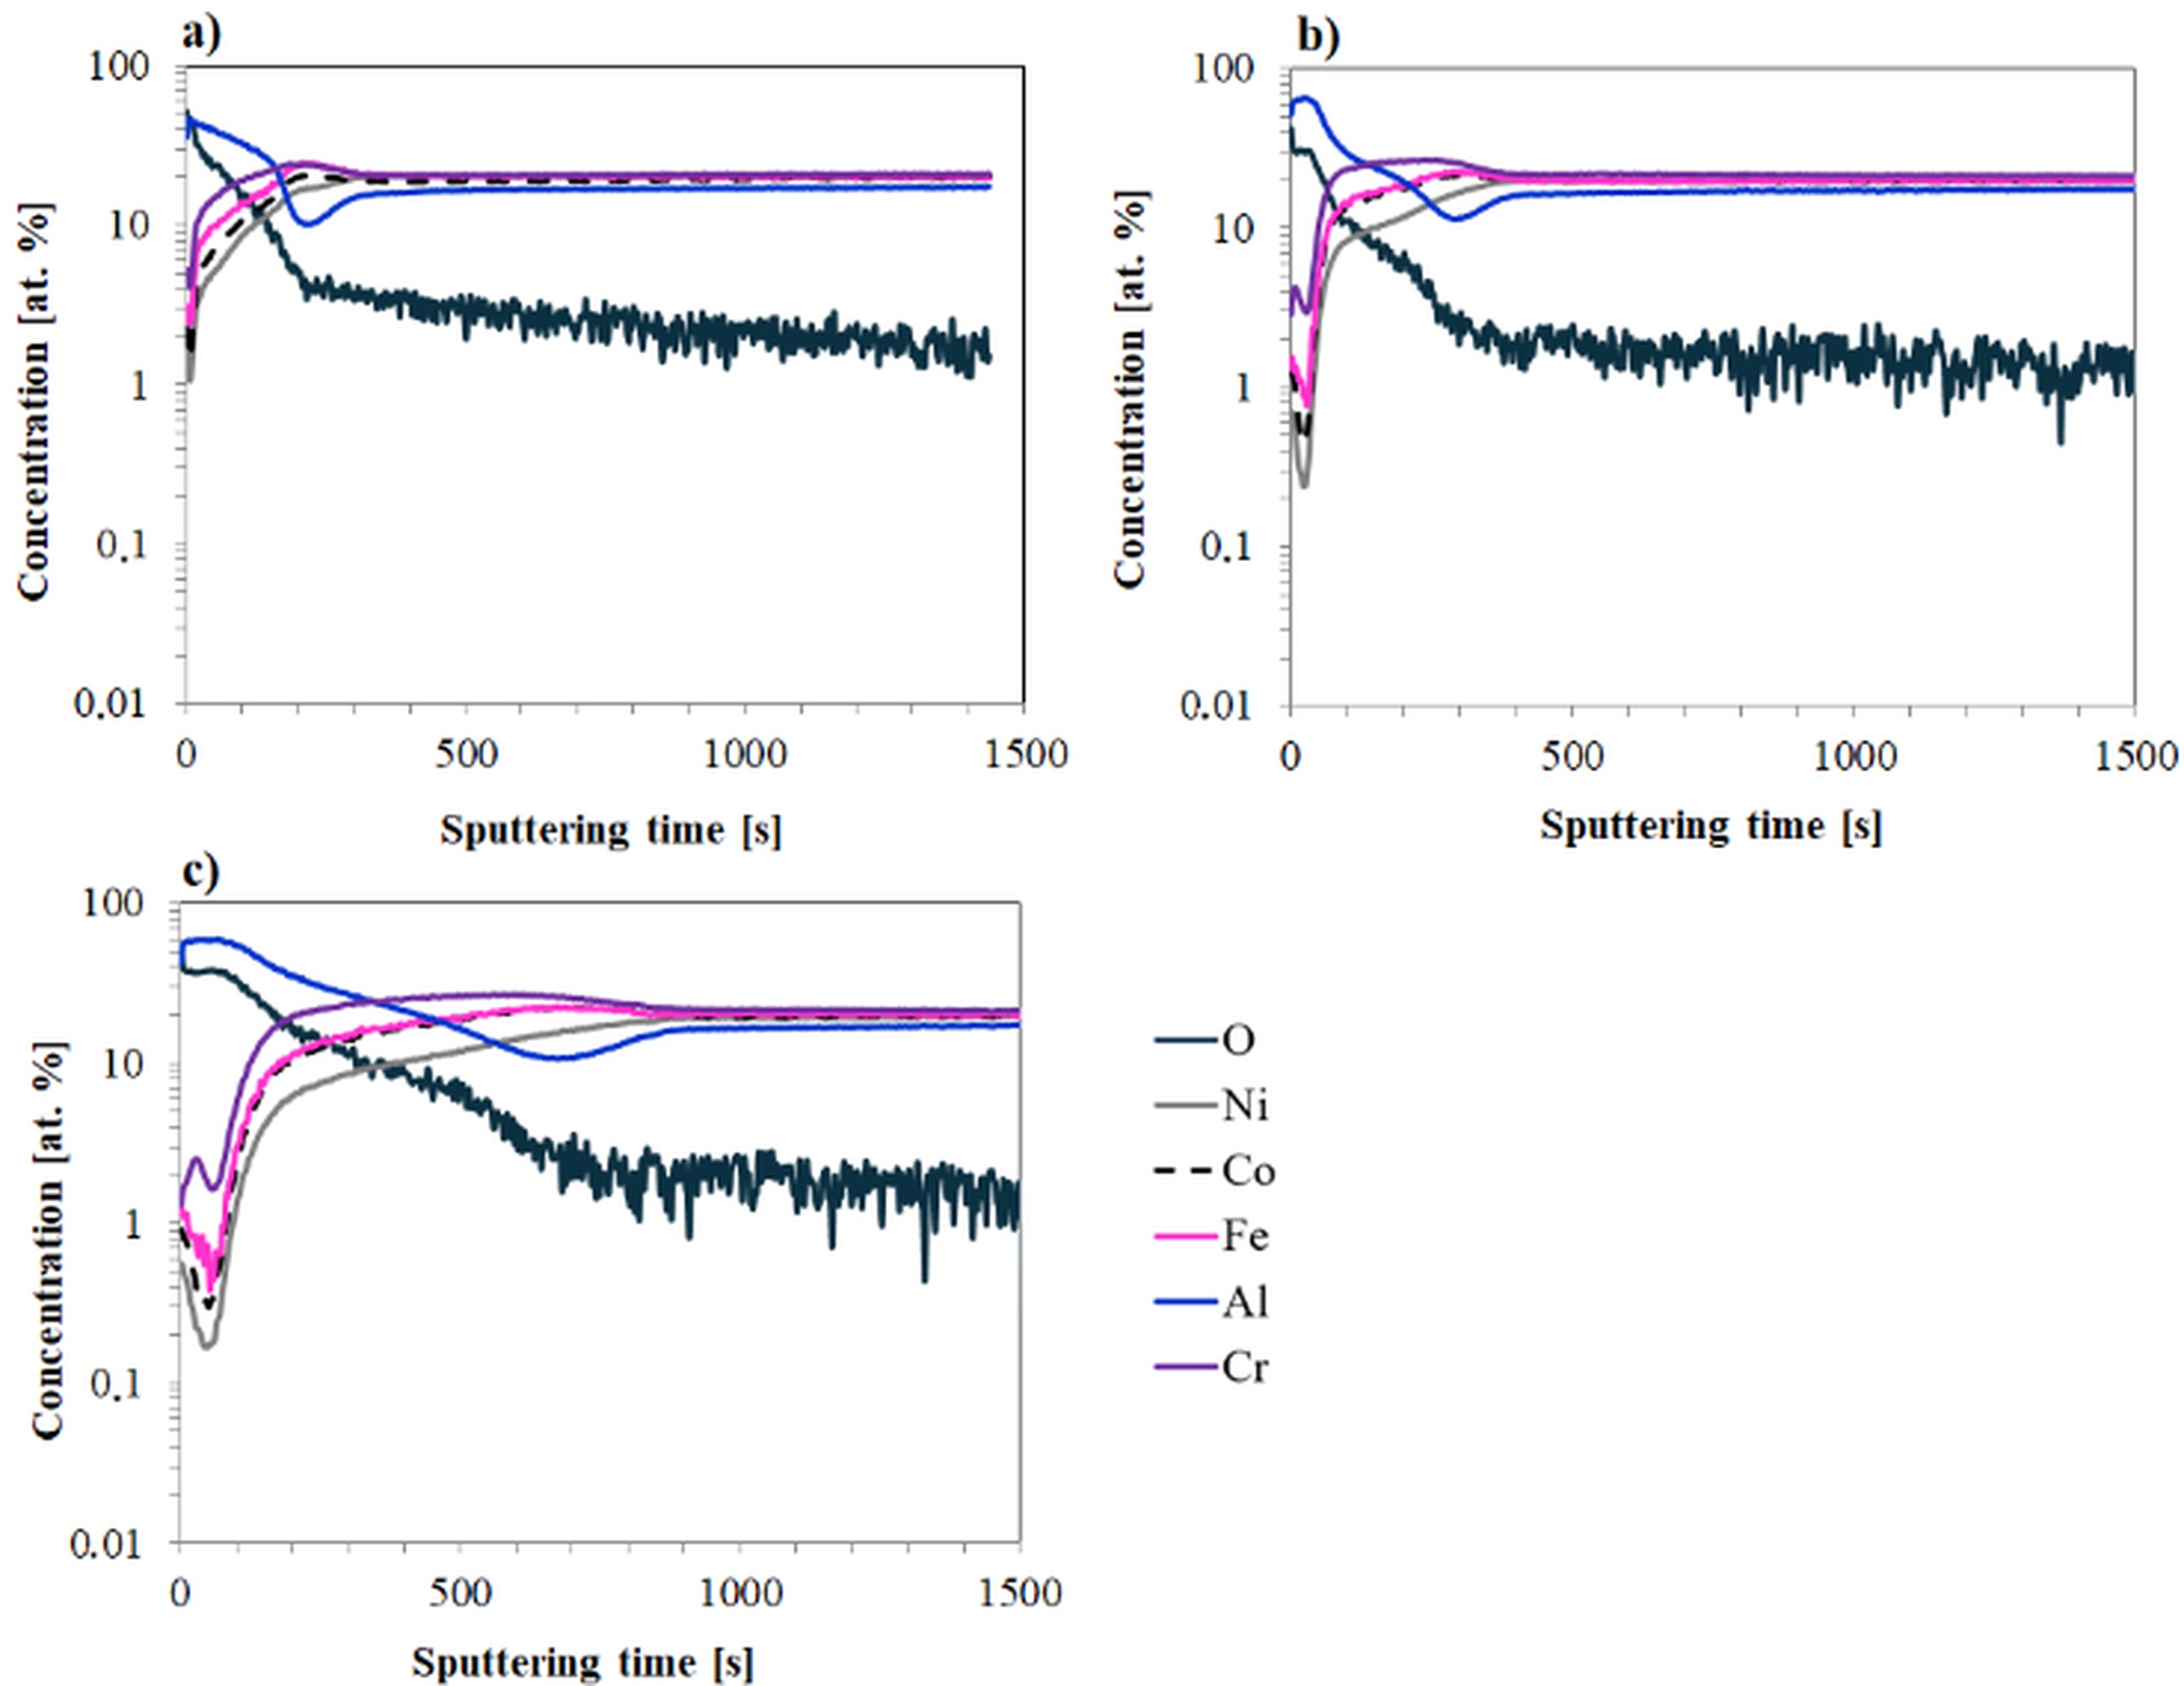
In contrast, the titanium profile exhibits distinct behaviour. In the oxide layer, titanium content is significantly lower than in the bulk, but a pronounced increase is observed at the surface, suggesting titanium diffusion through the aluminum oxide layer to the surface (Fig. 5).
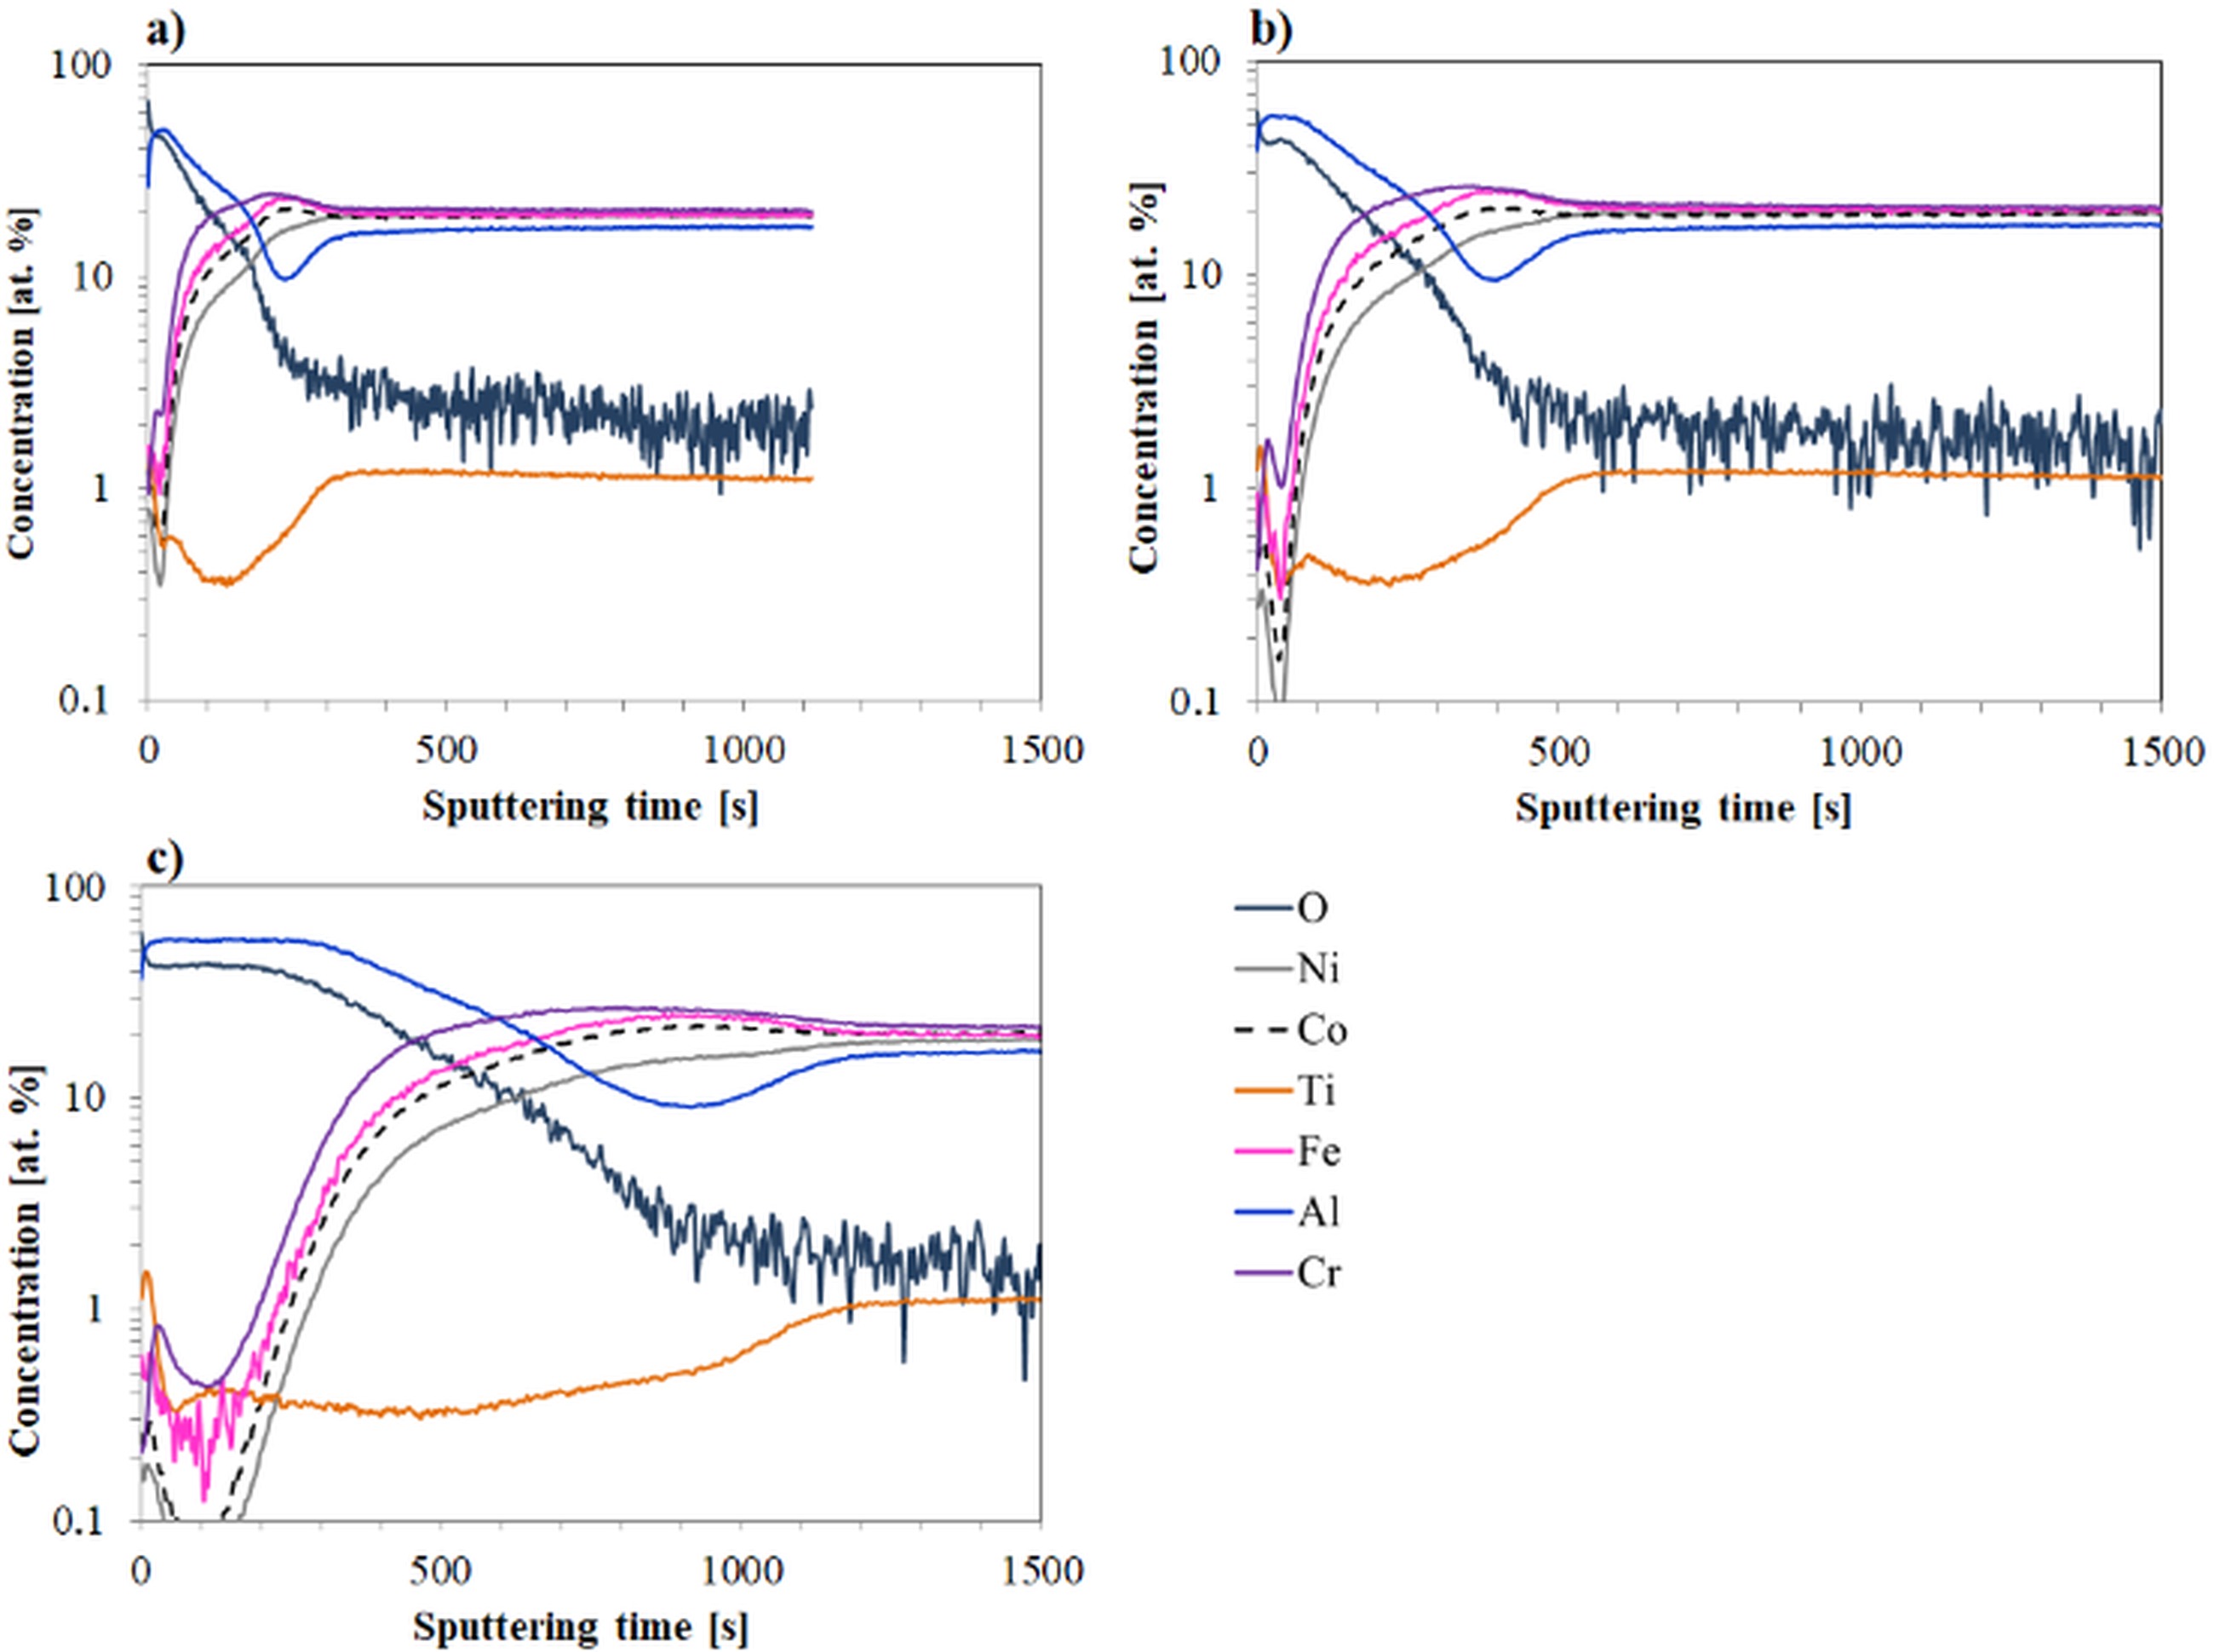
Fig. 5. GD-OES profiles of the Ref+0.2Ti alloy after air oxidation for: a) 24 h, b) 100 h, c) 1000 h
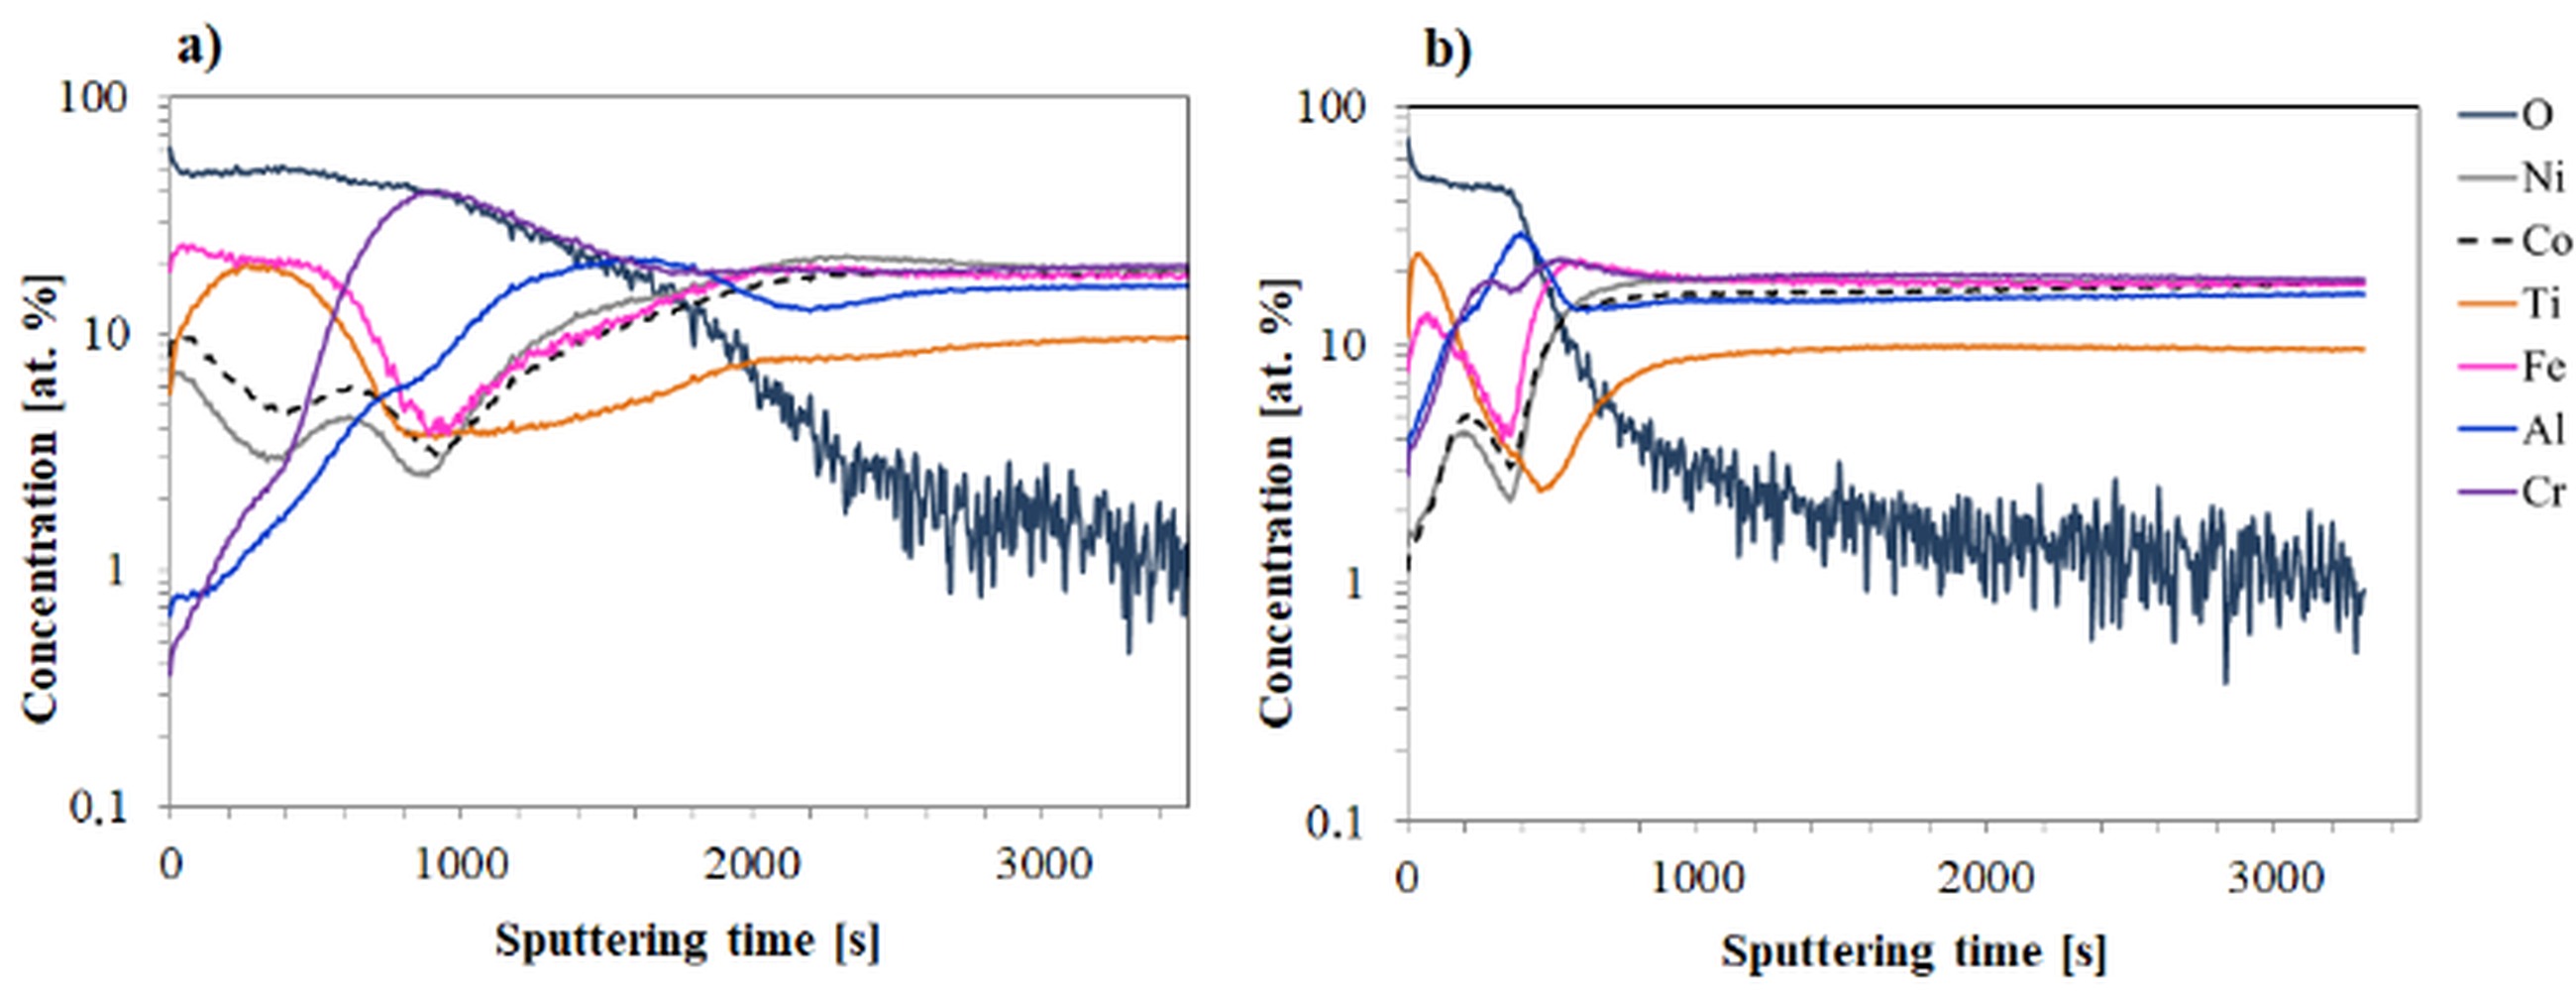
Figure 6 shows GD-OES profiles for the Ref+0.5Ti alloy after 24 and 100 hours of oxidation (Fig. 6a and 6b, respectively). After 24 hours at 1000°C (Fig. 6a), the surface contains complex oxides of the alloying elements, with iron and titanium being predominant. These oxides are gradually replaced by chromium oxides at greater depths. Aluminum content increases only near the interface with the bulk material. After 100 hours of oxidation (Fig. 6b), the surface oxide layer becomes thinner, likely due to spallation, and is composed mainly of titanium and iron oxides. Toward the core, the concentrations of these elements decrease, while cobalt and nickel contents slightly increase. Al-enrichment is found at the oxide scale-base alloy interface (in the region where oxygen profile drops down - Fig. 6b), which can suggest formation of internal zone rich in Al-oxides or Al-rich oxide subscale.
Surface morphology of the oxide layer
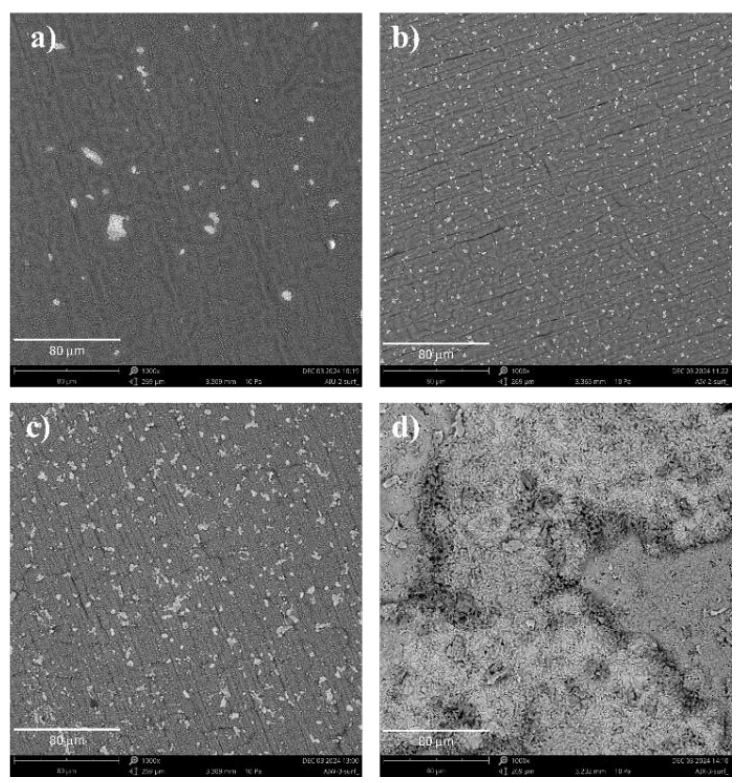
Figures 7-10 present microscopic images of the surfaces of the investigated materials after 1000 hours of high-temperature oxidation at 1000 °C. For direct comparison, Figure 11 presents the oxidation surface morphologies of all investigated alloys at the same magnification (x1000). On the surface of the Ref sample, an almost uniform aluminum oxide layer is observed, which is locally delaminated and cracked. Only in a few areas can bright spots be seen, corresponding to complex oxides of nickel, cobalt, and iron (Fig. 7e, g, h).
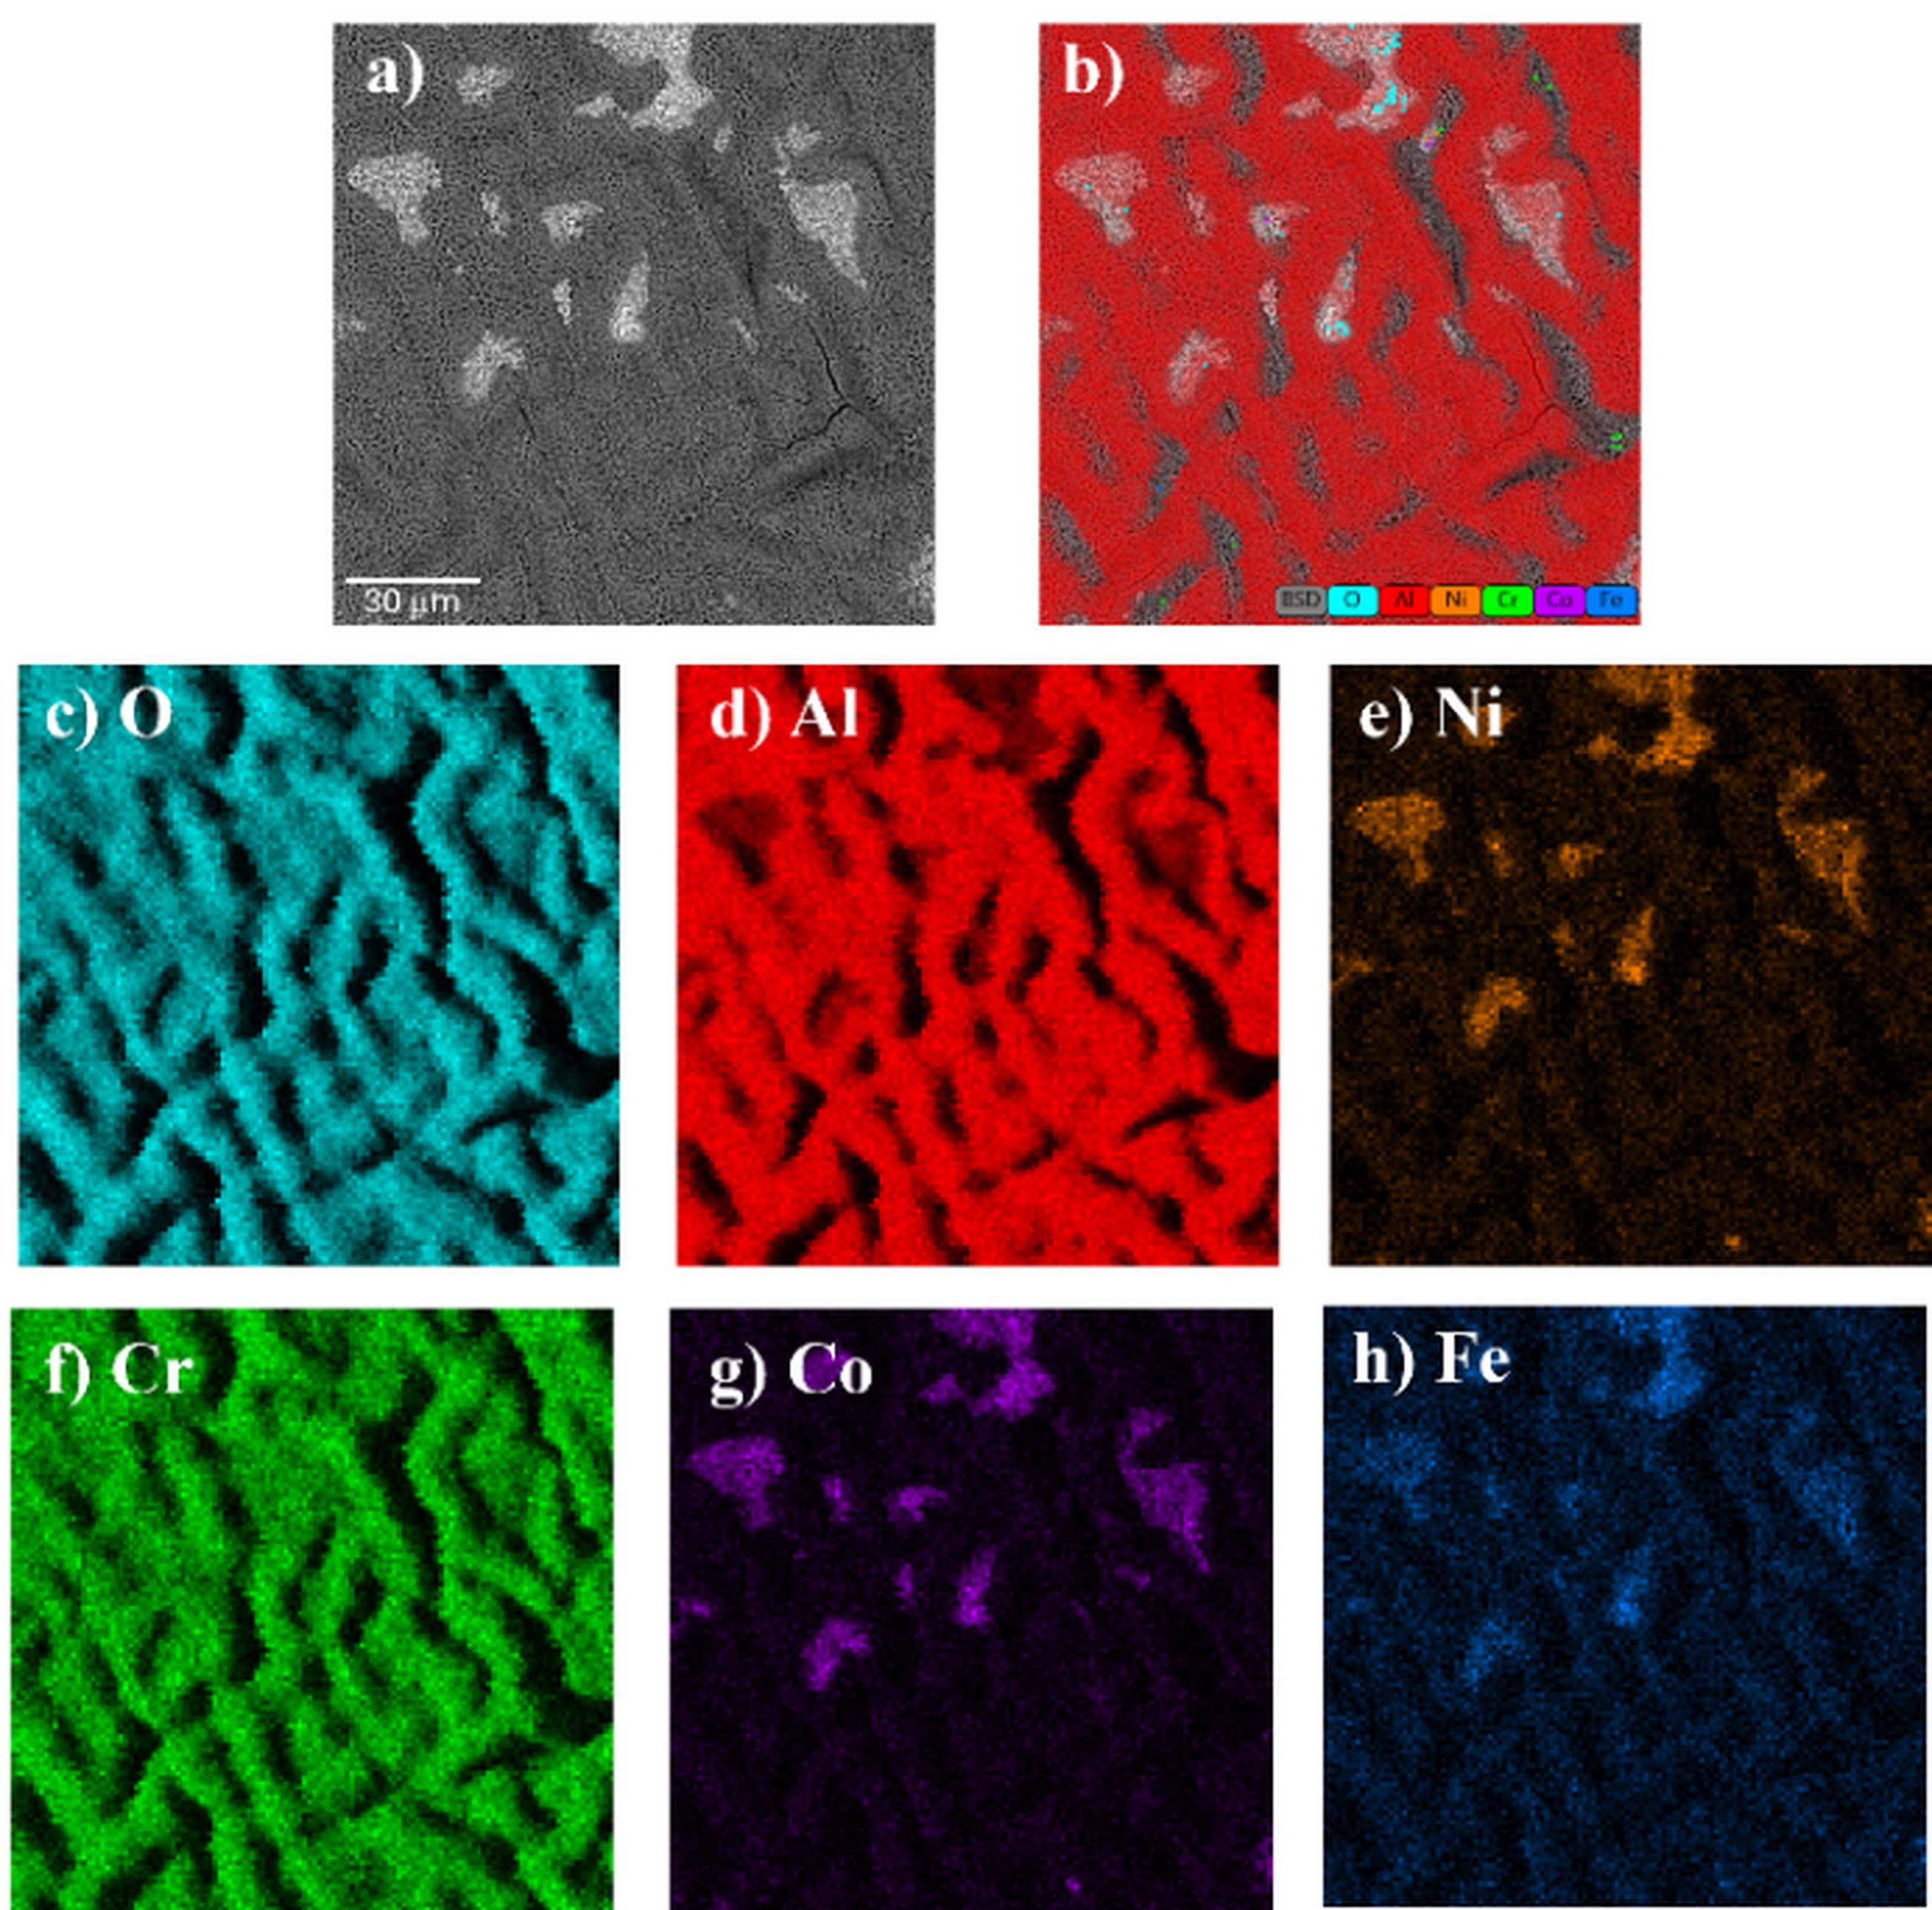
Fig. 7. Morphology of an oxide scale of the Ref sample after air oxidation for 1000 h: a) SEM image, b) combined map EDS, c-h) mapping of elements
The surface of the Ref+0.05Ti alloy also exhibits a dominant Al2O3 layer. Locally, small precipitates of oxides rich in Ni and Co are visible, along with numerous titanium oxides (Fig. 8).
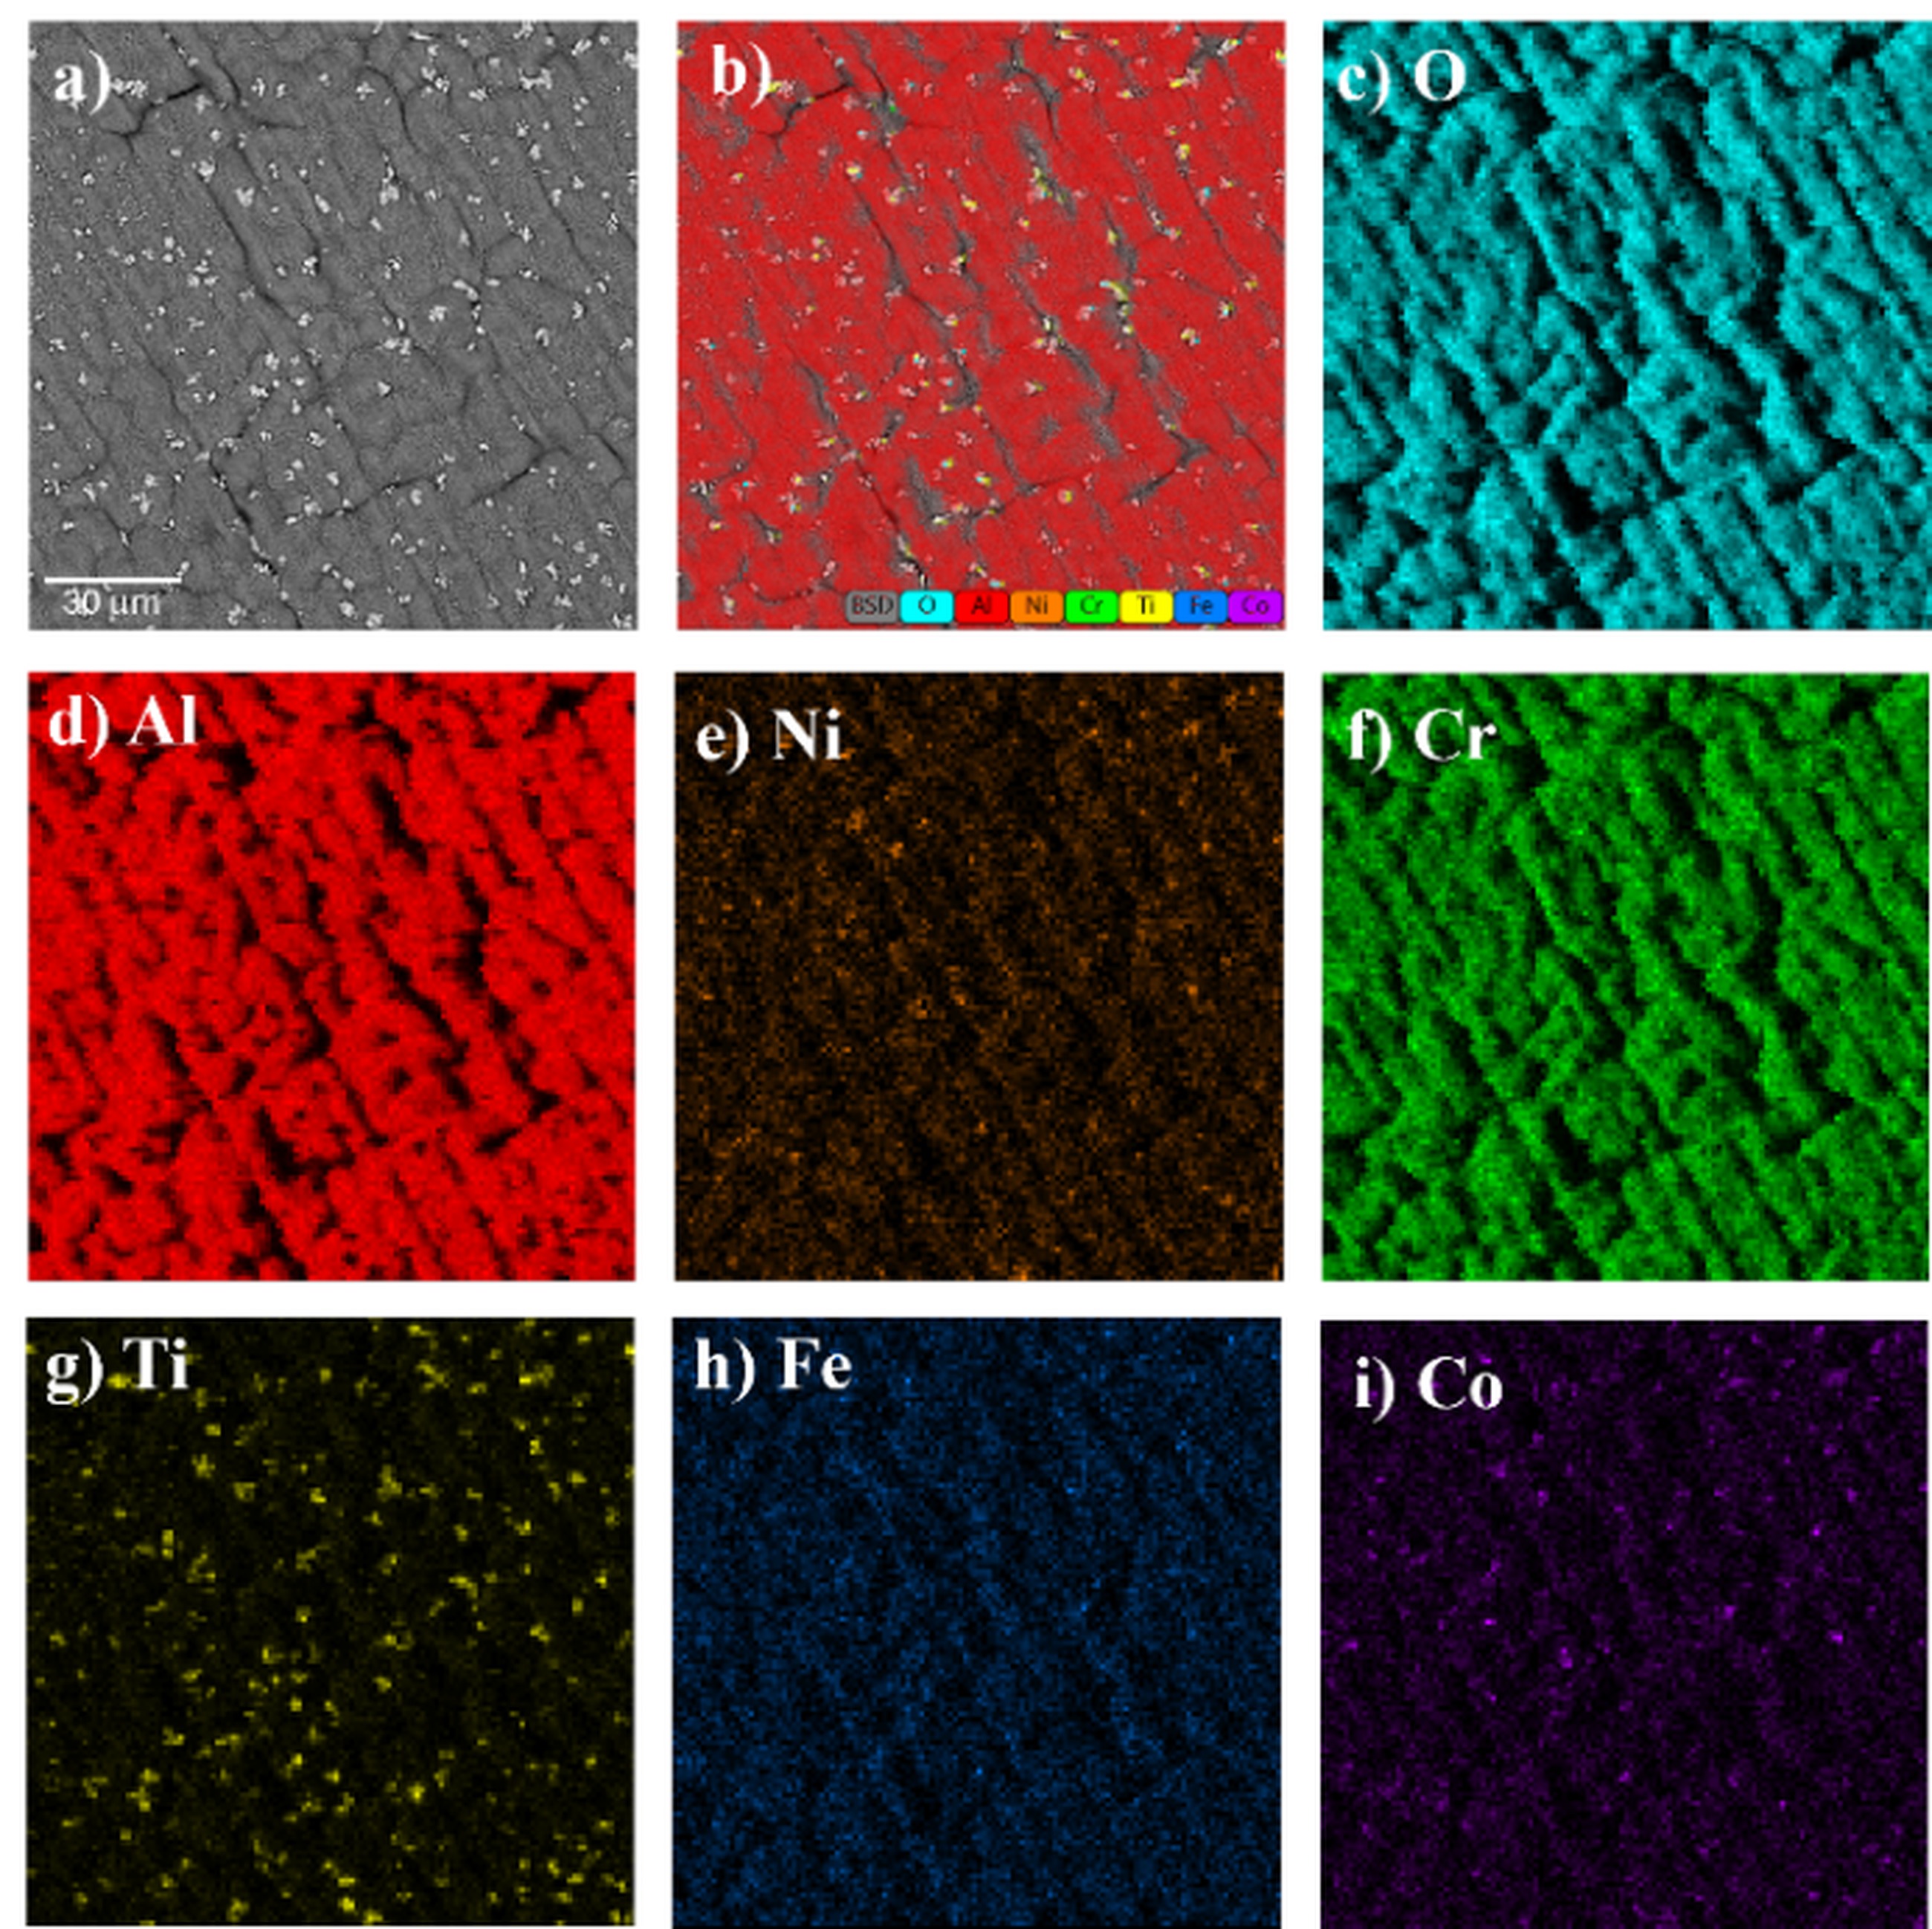
Fig. 8. Morphology of an oxide scale of the Ref+0.05Ti sample after air oxidation for 1000 h: a) SEM image, b) combined map EDS, c-i) mapping of elements
A similar surface morphology is observed for the Ref+0.2Ti alloy after high-temperature oxidation (Fig. 9). The sample surface reveals a continuous Al2O3 layer with numerous titanium oxide precipitates, as well as less frequent oxides of Co, Ni, and Fe.
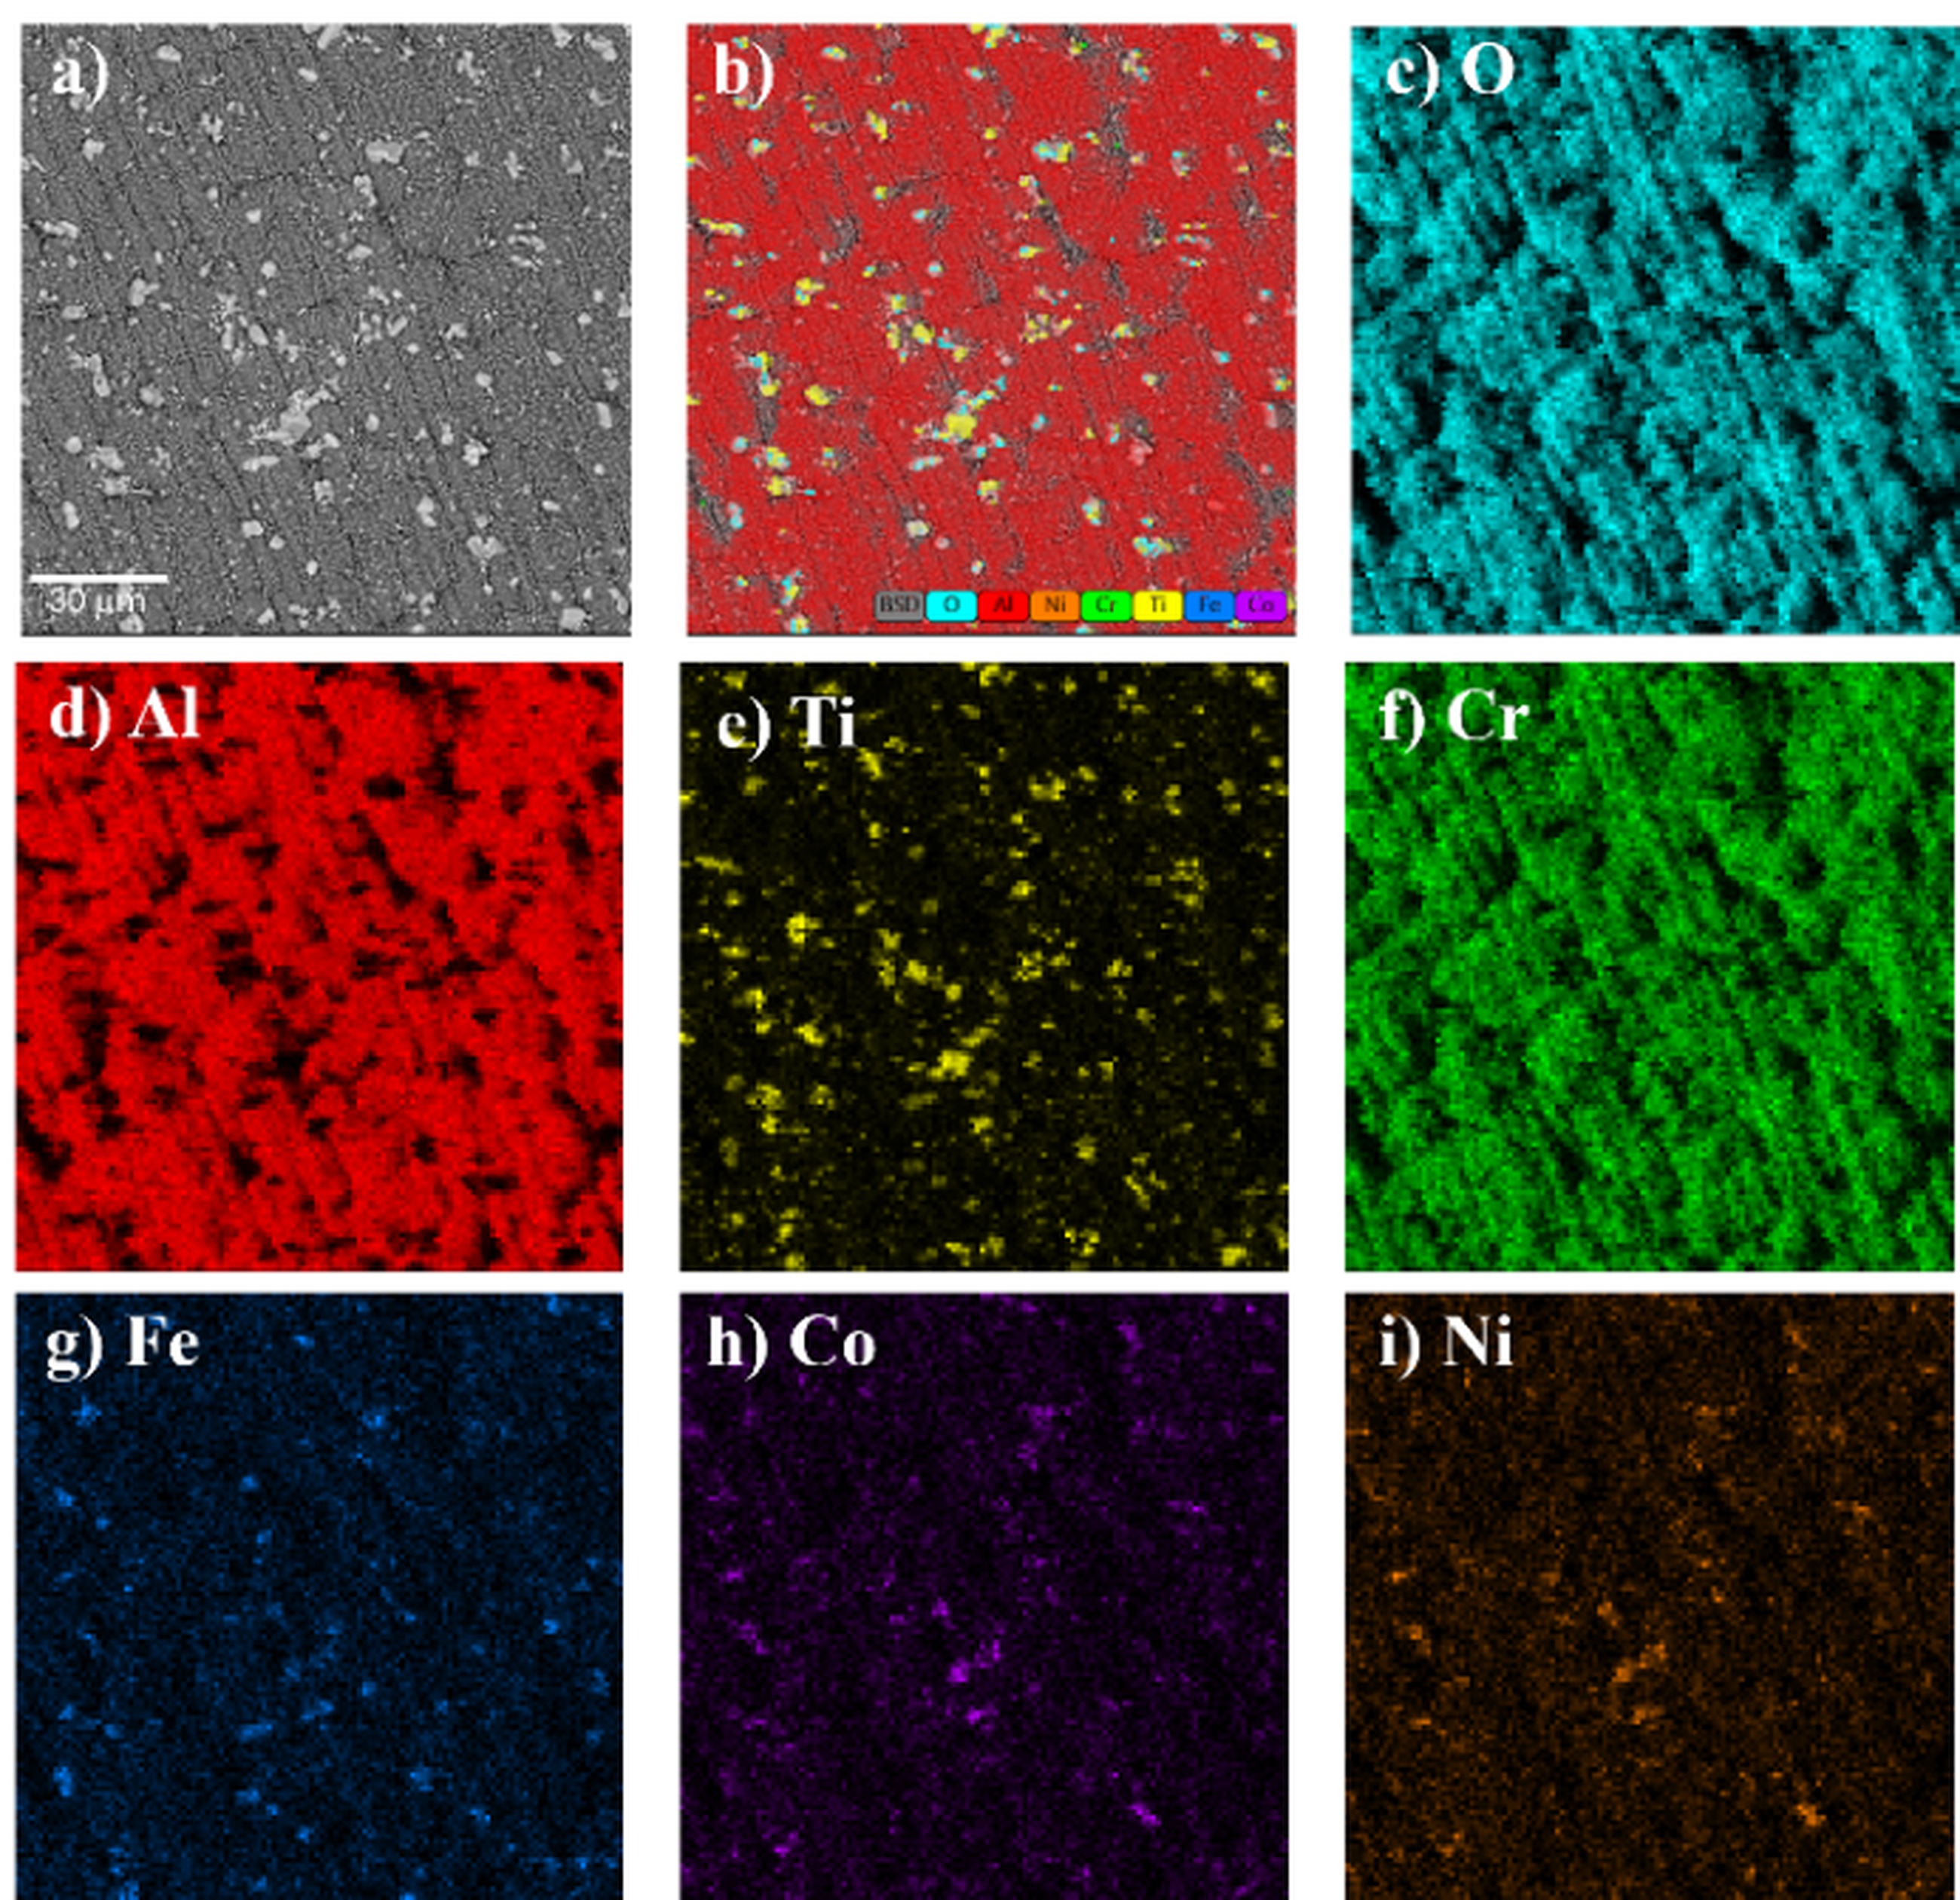
Fig. 9. Morphology of an oxide scale of the Ref+0.2Ti sample after air oxidation for 1000 h: a) SEM image, b) combined map EDS, c-i) mapping of elements
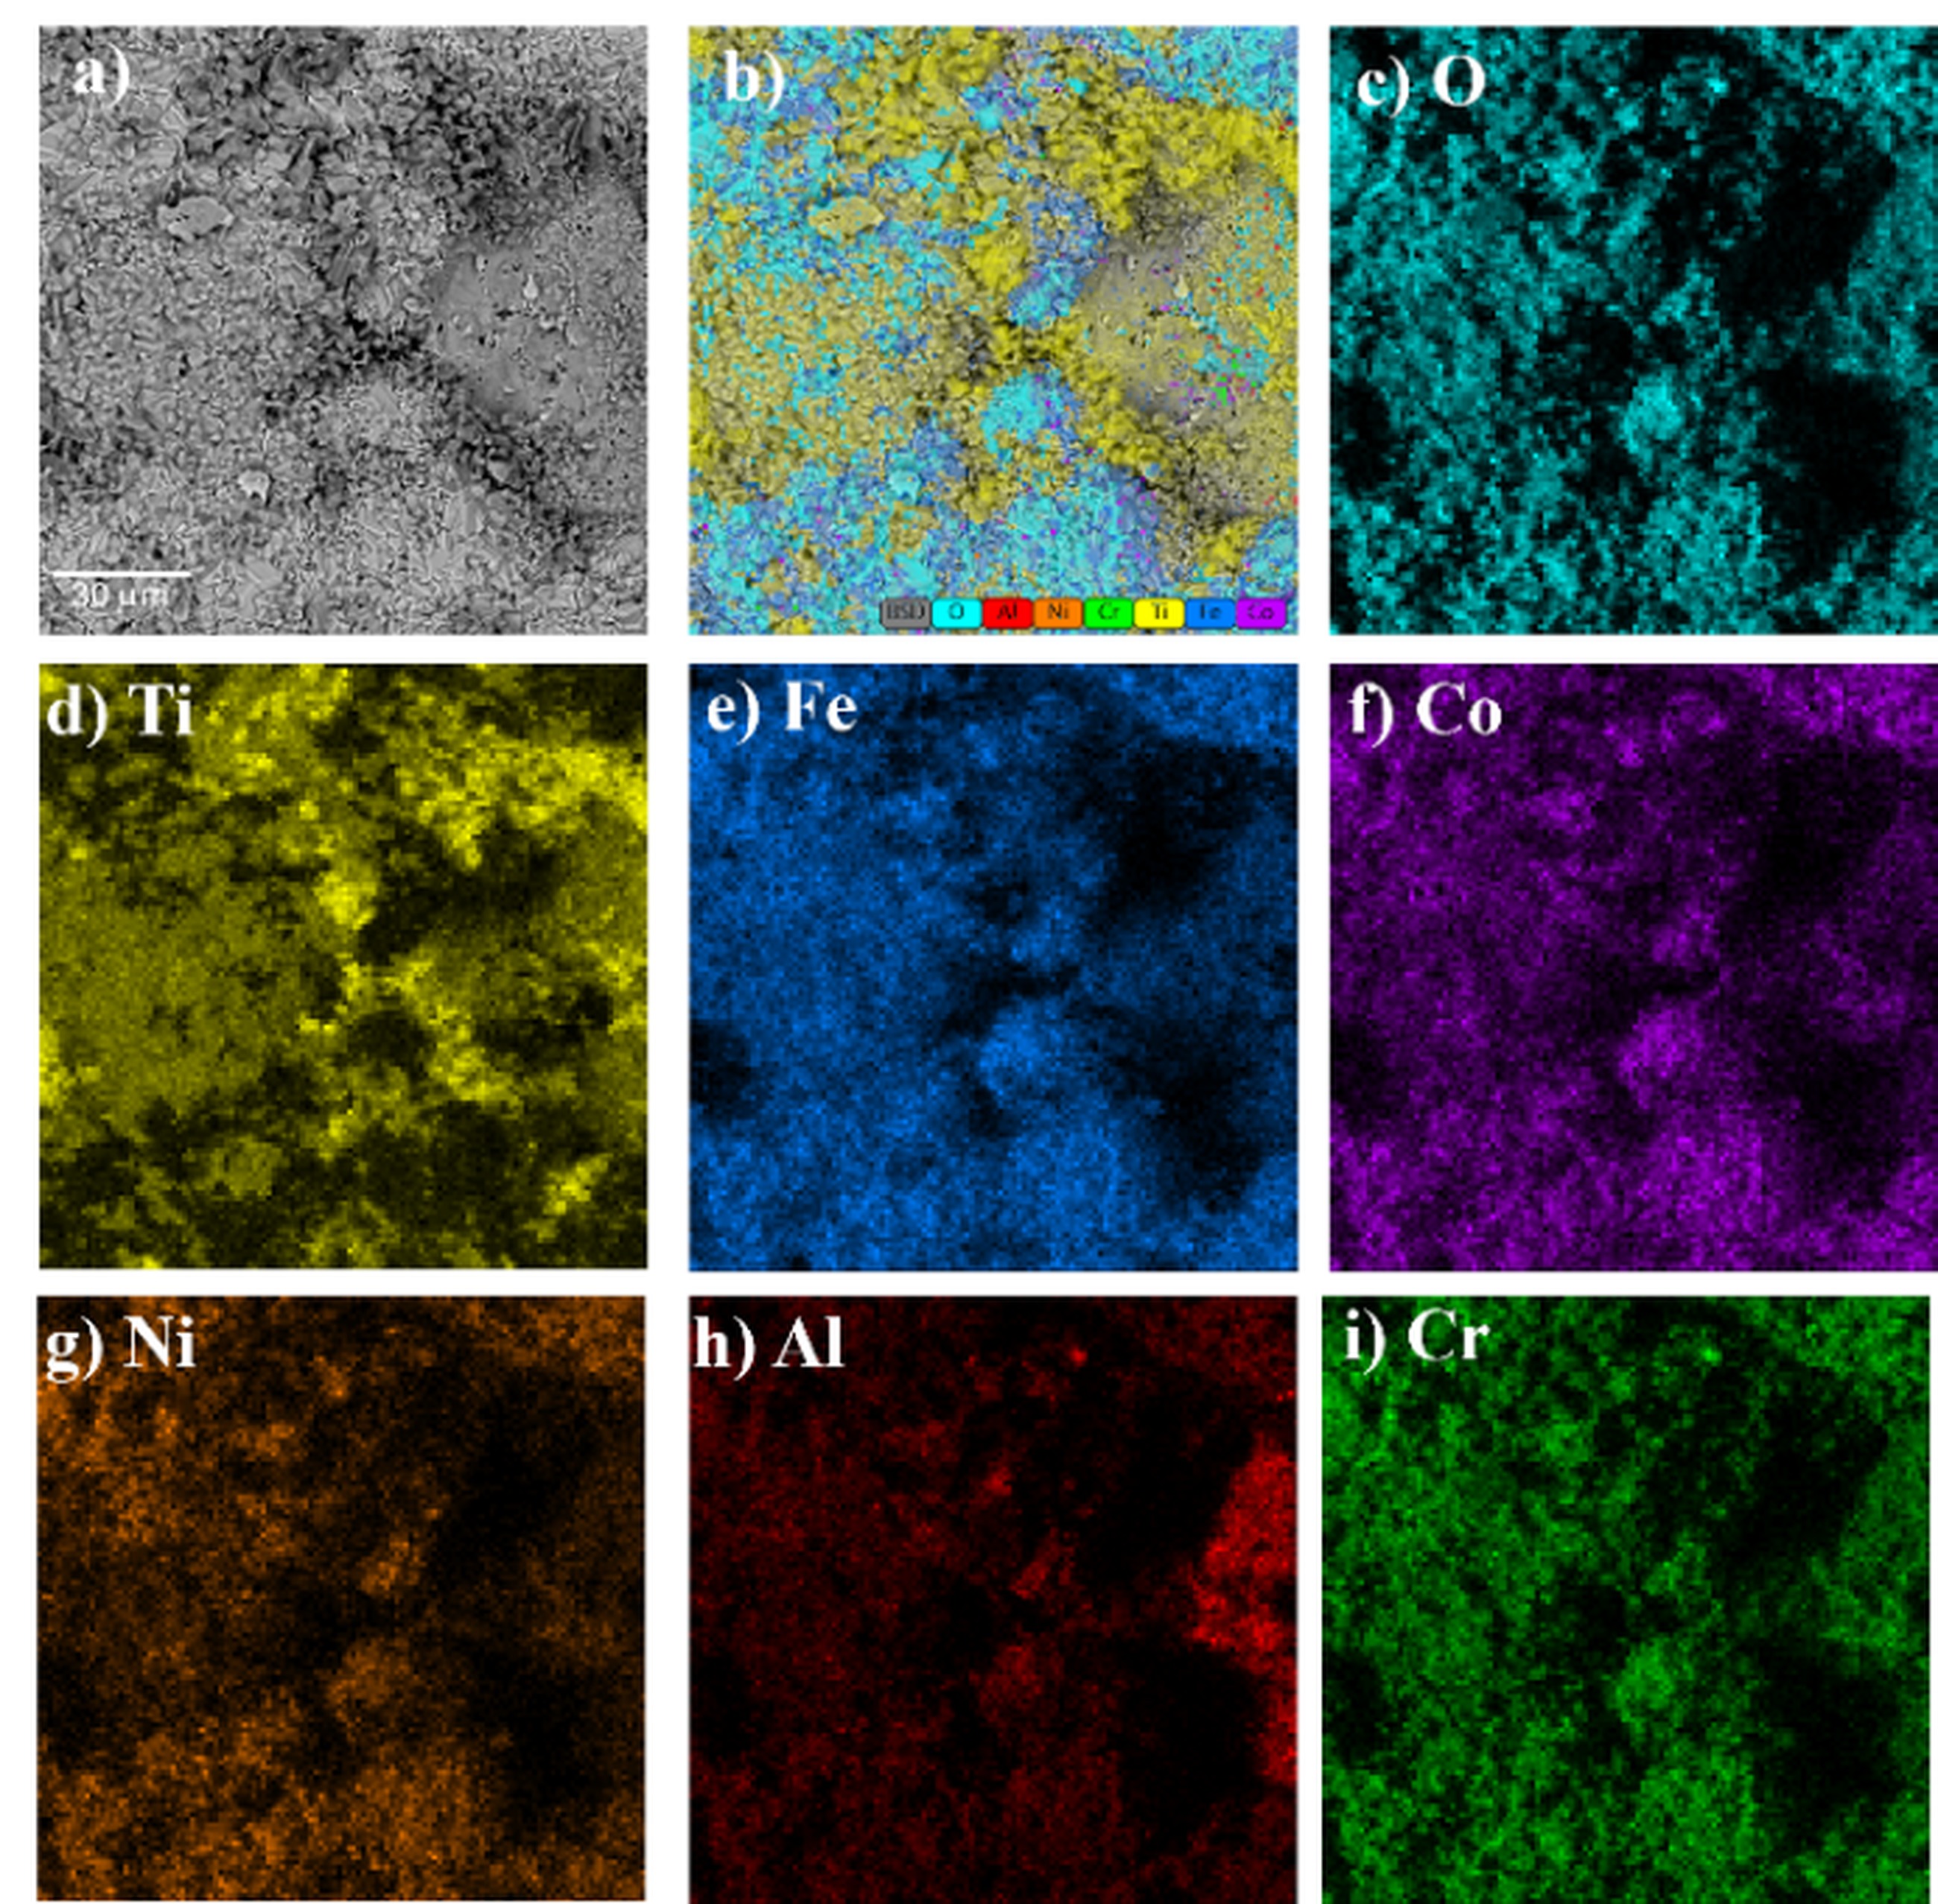
In contrast, the surface morphology of the Ref+0.5Ti sample appears entirely different. There is practically no aluminium in the outer oxide layer (Fig. 10b). The surface is dominated by complex oxides of Ni, Co, and Cr, along with large clusters of titanium-rich oxides (Fig. 10d).
Cross-section of the oxide layer
The cross-sectional analysis of the samples after oxidation confirms the surface morphology observations. On the surface of the Ref alloy without titanium, exposure to high-temperature oxidation resulted in the formation of a thin, compact Al2O3 layer, which protects the metallic substrate from further oxidation (Fig. 12). Beneath the alumina layer, a single-phase region depleted in aluminum is observed. As the Al2O3 scale forms, the interdendritic phase rich in aluminum disappears from the subsurface structure. With prolonged high-temperature exposure, the thickness of both layers increases slightly. Microstructural coarsening is also evident (Fig. 12a-c). These findings are supported by EDS elemental mapping of the alloy’s constituent elements (Fig. 13).
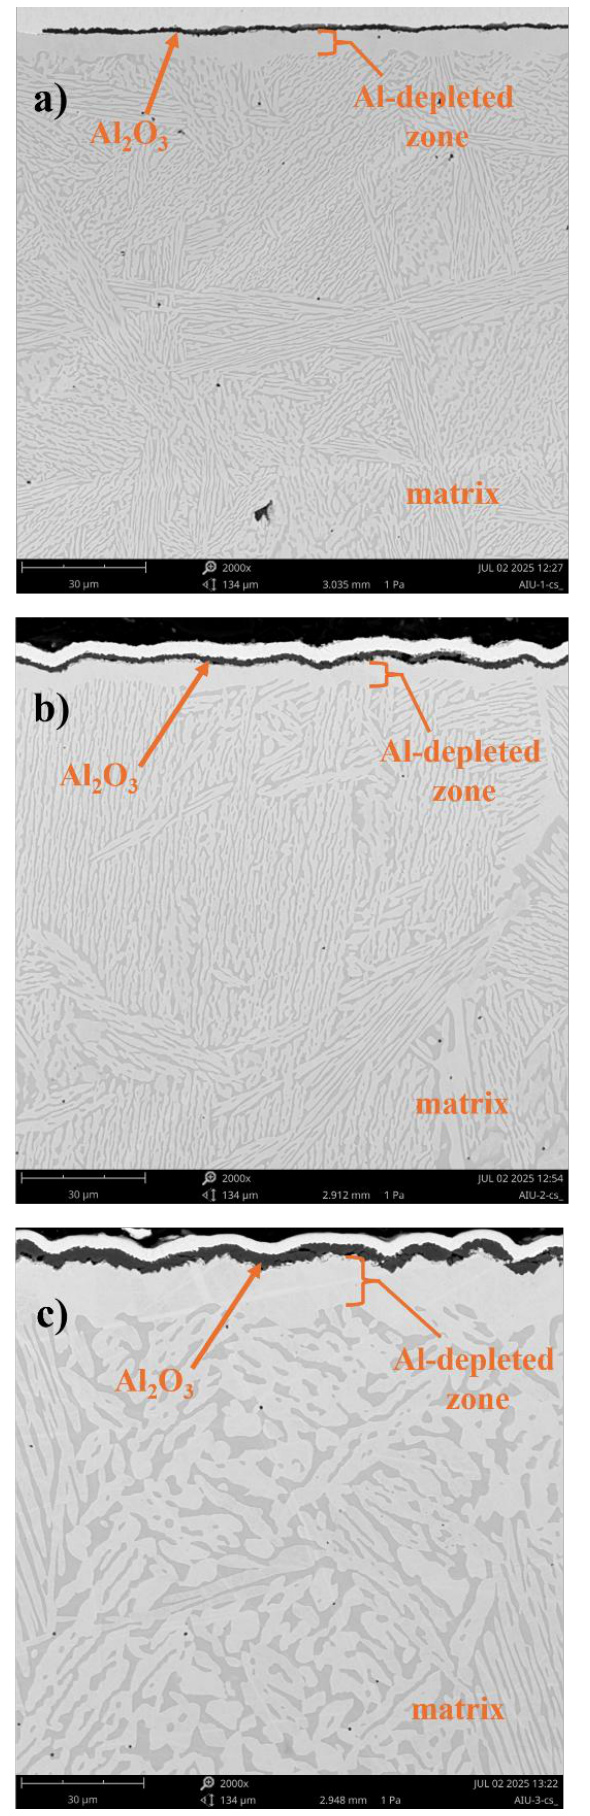
Fig. 12. Microstructure of the cross-section of the Ref sample after air oxidation for a) 24h, b) 100h, c) 1000h
A similar situation is observed in the cross-sectional images of the Ref+0.05Ti alloy samples (Fig. 14). On the surface of the materials exposed to high-temperature oxidation, only thin, compact Al2O3 layers are visible, adjacent to a metallic sublayer depleted in aluminum. With increasing exposure time, the thickness of both layers slightly increases, and microstructural coarsening becomes noticeable (Fig. 14 a-c). The chemical composition of all phases is illustrated in Figure 15.
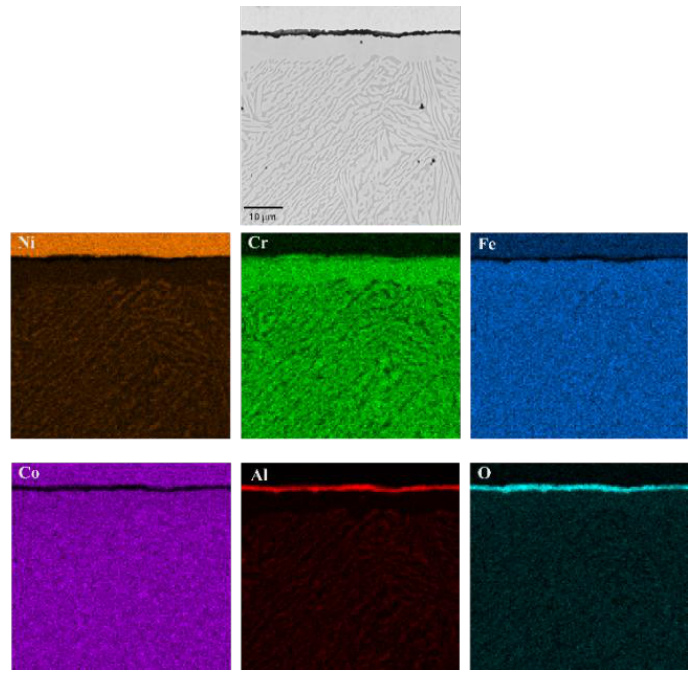
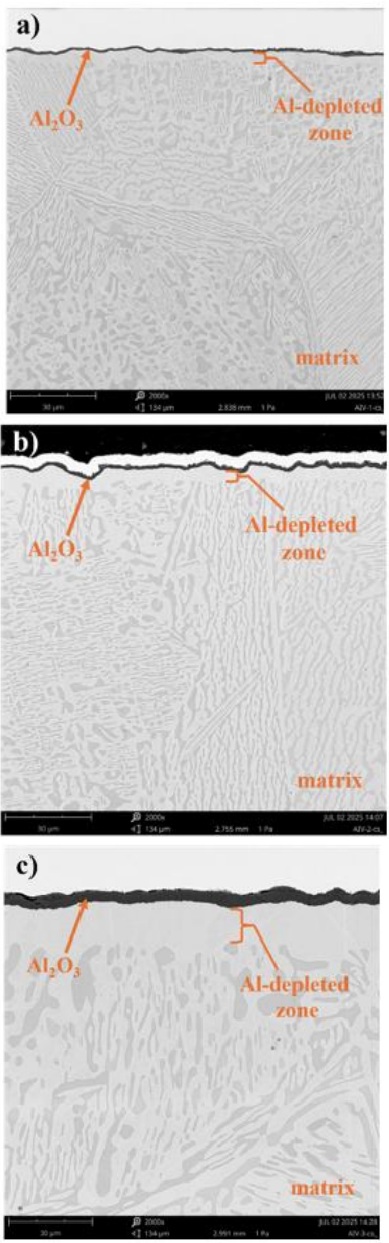
Fig. 14. Microstructure of the cross-section of the Ref+0.05Ti sample after air oxidation f or a) 24h, b) 100h, c) 1000h
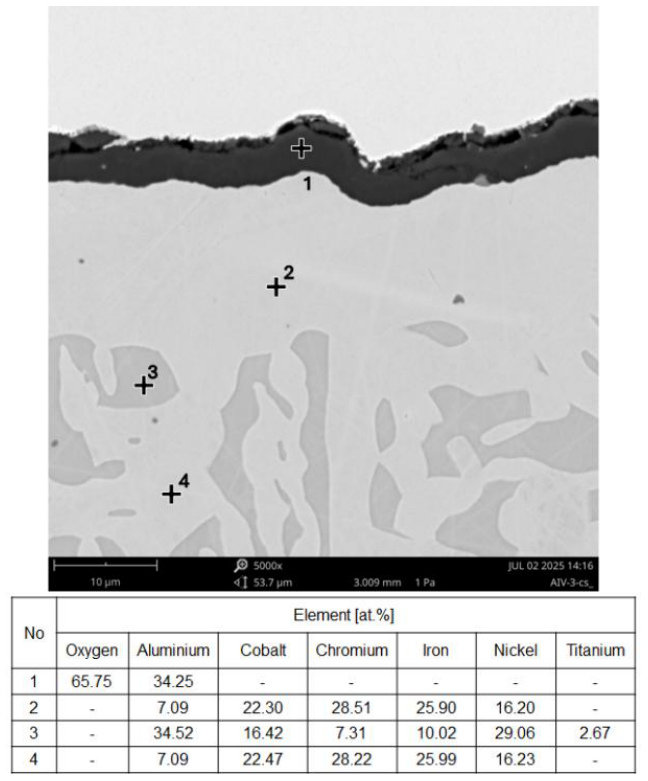
Fig. 15. EDS point analysis of the cross-section of the Ref+0.05Ti sample after air oxidation for 1000 h
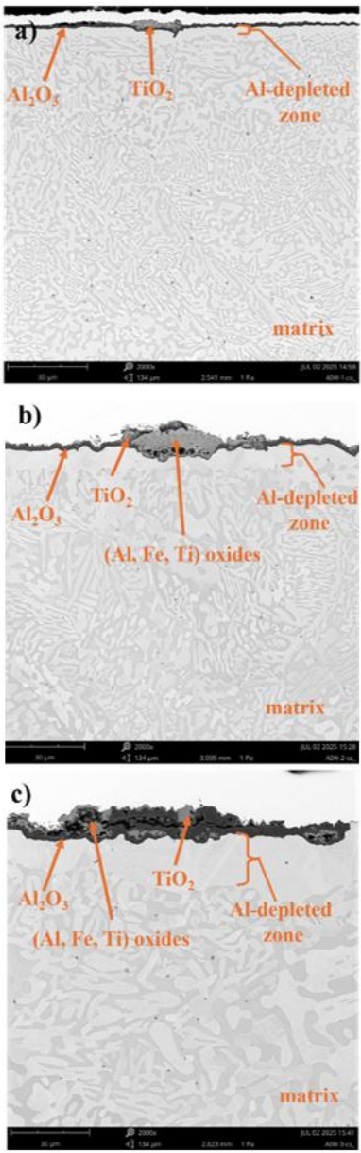
Fig. 16. Microstructure of the cross-section of the Ref+0.2Ti sample after air oxidation for a) 24 h, b) 100 h, c) 1000 h
A continuous Al2O3 layer also formed on the surface of the Ref+0.2Ti alloy. Beneath it, an aluminum-depleted layer is present (Fig. 16a–c). Locally, clusters of oxides with a porous structure and diverse chemical composition appear on the surface (Fig. 17a, b).
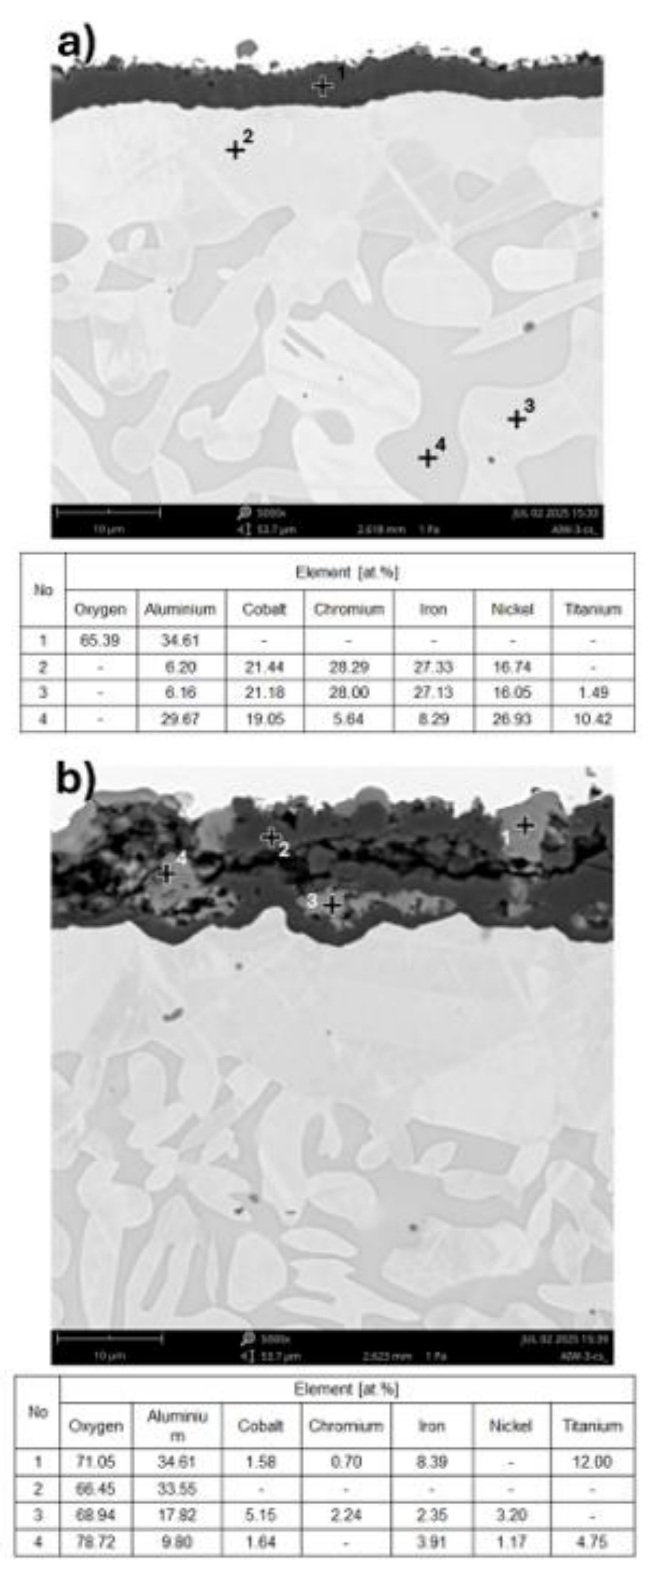
Fig. 17. EDS point analysis of the cross-section of the Ref+0.2Ti sample after air oxidation for 1000 h a) continuous Al 2 O 3 layer, b) cross-section of complex oxide precipitates
The cross-section images of the Ref+0.5Ti alloy samples differs significantly and confirms the surface morphology analysis of this material (Fig. 18a–c). After 24 hours of high-temperature exposure, a thick oxide layer (~10 μm) forms on the sample surface, clearly divided into three regions with distinct chemical compositions. An outer spinel layer can be distinguished, followed by a layer of Cr and Al oxides containing Ti. At the interface with the metallic matrix, a thin Al2O3 layer is visible, indicating internal oxidation of aluminum. This interface is irregular and undulated, which may promote oxide delamination (Fig. 18a). In Figure 18b, showing the cross-section after 100 hours of oxidation, the oxide layer is significantly thinner, suggesting delamination of porous oxides. Locally, complex multilayered oxide structures with high porosity can be observed. After 1000 hours of high-temperature exposure, the oxide layer becomes thick (~30 μm) and porous (Fig. 18c).
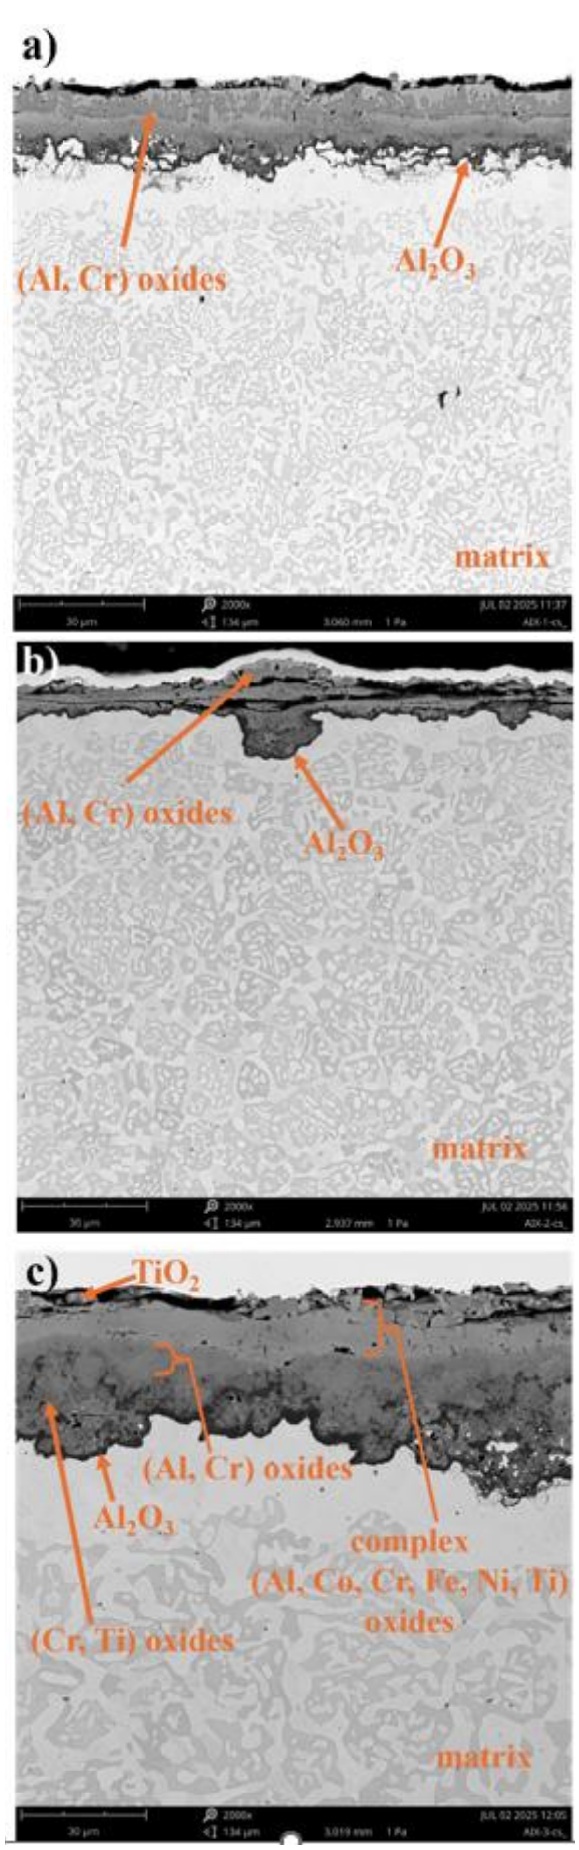
Fig. 18. EDS point analysis of the cross-section of the Ref+0.5Ti sample after air oxidation for 1000 h a) continuous Al 2 O 3 layer, b) cross-section of complex oxide precipitates
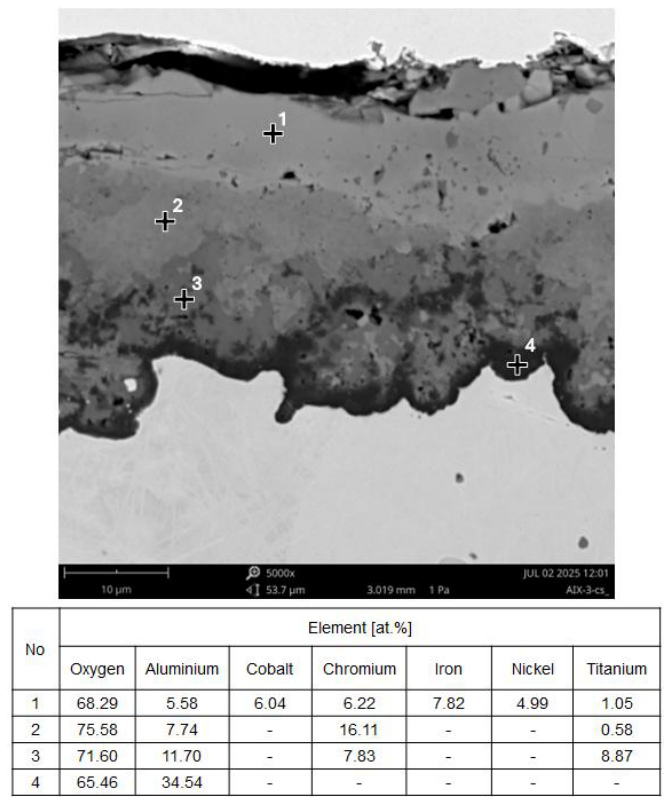
Fig. 19. EDS point analysis of the cross-section of the Ref+0.5Ti sample after air oxidation for 1000 h
In the oxide layer formed after 1000 hours of high-temperature exposure, four sublayers with distinct chemical compositions can be identified (Fig. 19). The outermost layer is structurally homogeneous and contains all alloying elements in approximately equal proportions (Fig. 19, point 1). Beneath it lies a thin layer of Cr oxides with some Al content (point 2). Below this is a porous spinel layer with a high Ti content (point 3). The innermost oxide layer is composed of Al2O3 (point 4). Similar layered oxide structures were observed by Jalowicka and Nowak [41] after oxidation of a titanium-containing nickel-base superalloy for 20 hours in synthetic air at 1050 °C.
The phenomenon of internal oxidation of aluminum in AlCoCrFeNi alloys without titanium has also been described by Butler [20, 42]. In turn, Zhi-Sheng Nong [40] investigated high-temperature oxidation of a similar AlCrFeNiTi alloy (without Co, but with Ti) at 900 °C. The oxidation process was characterized as consisting of two mechanisms: oxygen diffusion into the oxide layer and outward diffusion of alloying elements to the surface. In this case as well, the presence of titanium did not improve high-temperature oxidation resistance; sample mass increased steadily with exposure time up to 100 hours. As a result, a Ti-rich oxide layer formed on the surface, while the Al2O3 layer was located beneath it. Similar findings regarding the influence of titanium on the oxidation behaviour of the AlCrMoNbTi alloy were reported by Zhang [32, 33].
Conclusion
The obtained results clearly indicate that a small addition of titanium (up to x = 0.2) in the Ref alloy has only a minor effect on its microstructure and high-temperature oxidation behaviour.
The microstructures of the Ref, Ref+0.05Ti, and Ref+0.2Ti alloys do not differ qualitatively. In all cases, the structure can be described as biphasic, lamellar-dendritic. Only a refinement of the individual phase constituents is observed with increasing titanium content. Similarly, in high-temperature oxidation tests, the influence of titanium addition up to x = 0.2 can be considered as causing only a slight deterioration in oxidation resistance. The relative weight gains follow a trend similar to that of the unmodified alloy over 1000 hours of testing, which is associated with the formation of a protective, stable, and compact Al2O3 layer on the surface. The formation of this layer is accompanied by the development of a subsurface aluminum-depleted zone. For all the discussed alloys, the thickness of both layers increases slightly with prolonged high-temperature exposure. Microstructural coarsening is also observed. In the case of alloys with titanium additions up to 0.2, isolated precipitates of oxides of other alloying elements appear on the surface, which tend to delaminate, potentially contributing to a slight reduction in oxidation resistance.
In contrast, the changes occurring in the Ref+0.5Ti alloy are qualitatively significant. The microstructure transforms into a mosaic-like structure with numerous intermetallic phase precipitates located in the intergranular regions. The oxidation behaviour is also markedly different. Even during the first 24 hours of exposure at 1000 °C, no protective Al2O3 layer is observed. Instead, a layer of oxides of the alloying elements forms on the surface, which readily delaminates. Aluminum tends to oxidize internally. As a result, oxide weight gain occurs rapidly. Prolonged high-temperature exposure leads to significant thickening of the oxide layer, further chemical segregation within the oxide sublayers, and continued rapid mass increase of the sample.
In summary, if specific functional property requirements (e.g., wear resistance) for the Ref alloy suggest the addition of titanium, it is recommended-based on high-temperature oxidation behaviour-to limit its content to a maximum of 0.2.