
Introduction
Fracture mechanics is an important tasks in real industrial applications. The optimization of structures to conserve natural resources may lead to smaller dimensions. Therefore, the investigation of initial cracks can not always guarantee the safety of the structures during the whole life cycle and crack propagation has to be considered. Initial cracks and material flaws induced during the manufacturing process are often exposed to initial mixed mode loading conditions under operating conditions. This may complicate the fracture analysis and the computation of the fatigue crack growth in real structures [21]. An important issue in modern lightweight constructions and in the aerospace are thin-walled sheets. Here, cracks are often induced by cyclic operational loadings at holes for rivet and screw connections. The FKM-Guideline “Fracture Mechanics Proof of Strength for Engineering Components” [9] discusses several recommendations for the treatment of stationary cracks under mixed mode loadings. An important role in the safety analysis plays the two-parameter approach of the failure assessment diagram (FAD). The structural analysis of growing cracks as the consequence of cycling loadings requires advanced simulation concepts. A review of in-plane biaxial fatigue behavior of metallic materials are given in [22]. Non-proportional mixed-mode crack tip loading under uniaxial tension is investigated in [16].
Several numerical methods are proposed to compute the fatigue crack propagation. The finite element method (FEM) is applied for example in [4, 6, 7, 8, 13, 19]. The extended finite element method (XFEM) for plane structures is developed to avoid or reduce the remeshing process by [3, 14] and others. Due to the only boundary discretization the boundary element method (BEM) is very attractive for fracture mechanical problems and is used for example by [1, 20]. Various meshless methods are presented in [2]. In all of these works the geometry of the crack path is obtained by a step-by-step approach assuming a mixed-mode situation at the actual crack tip. The new tip of the propagating crack is computed forward in an explicit scheme. As discussed in the literature this requires very small crack increments. Otherwise significant inaccuracies in the crack paths can be obtained. Furthermore, only brittle fracture is investigated without the consideration of the very important plastic limit loads.
The complete description of the resulting fracture behavior of the components requires an accurate computation of the geometry of the growing crack. The underlying concept for the evaluation of the crack geometry is usually based on the criterion of local symmetry where the mode-II and mode-III stress intensity factors (SIF) are zero [17]. The results of the crack path simulations are the local mode-I SIFs as a function of the changing crack geometry and the given loading system. In contrast, the application of the FAD requires an additional numerical analysis of the plastic limit loads for the propagating crack. Another important aspect is that additionally cracks can be initiated during the crack growth process which has to be considered in an advanced numerical simulation algorithm. In order to solve plane structures with multiple curved interacting cracks a fully automatic simulation to analyze the corresponding crack growth and the plastic limit load at each crack propagation step is required.
In this paper, improved numerical simulation of multiple curved crack propagation problems in combination with the plastic limit loading analysis in plane structures are presented. Since the finite element method (FEM) is the dominating numerical method for the computation structural mechanical problems in engineering sciences a simulation program based on the FEM is developed. Here, the main focus of the work is a robust, accurate and fully automatic application according to the international guideline Fracture Mechanics Proof of Strength for Engineering Components [9] without any user interaction. In order to consider both possible failure mechanisms brittle fracture and plastic collapse the failure assessment diagram approach is implemented in the program. Additionally initiated cracks into the model during the crack growth simulation process are taken into account by a Coffin-Manson-model. Numerical results of specimen with multiple propagating cracks under proportional loadings are presented and compared with experimental findings to show the accuracy of the developed solution algorithm.
Problem Statement
We consider a two-dimensional, piecewise homogeneous solid containing multiple boundary cracks and internal cracks m (m = 1, ..., M) of arbitrary shape as shown in Fig. 1. Isotropic material properties are assumed for each domain Ωk (k = 1, ..., K).
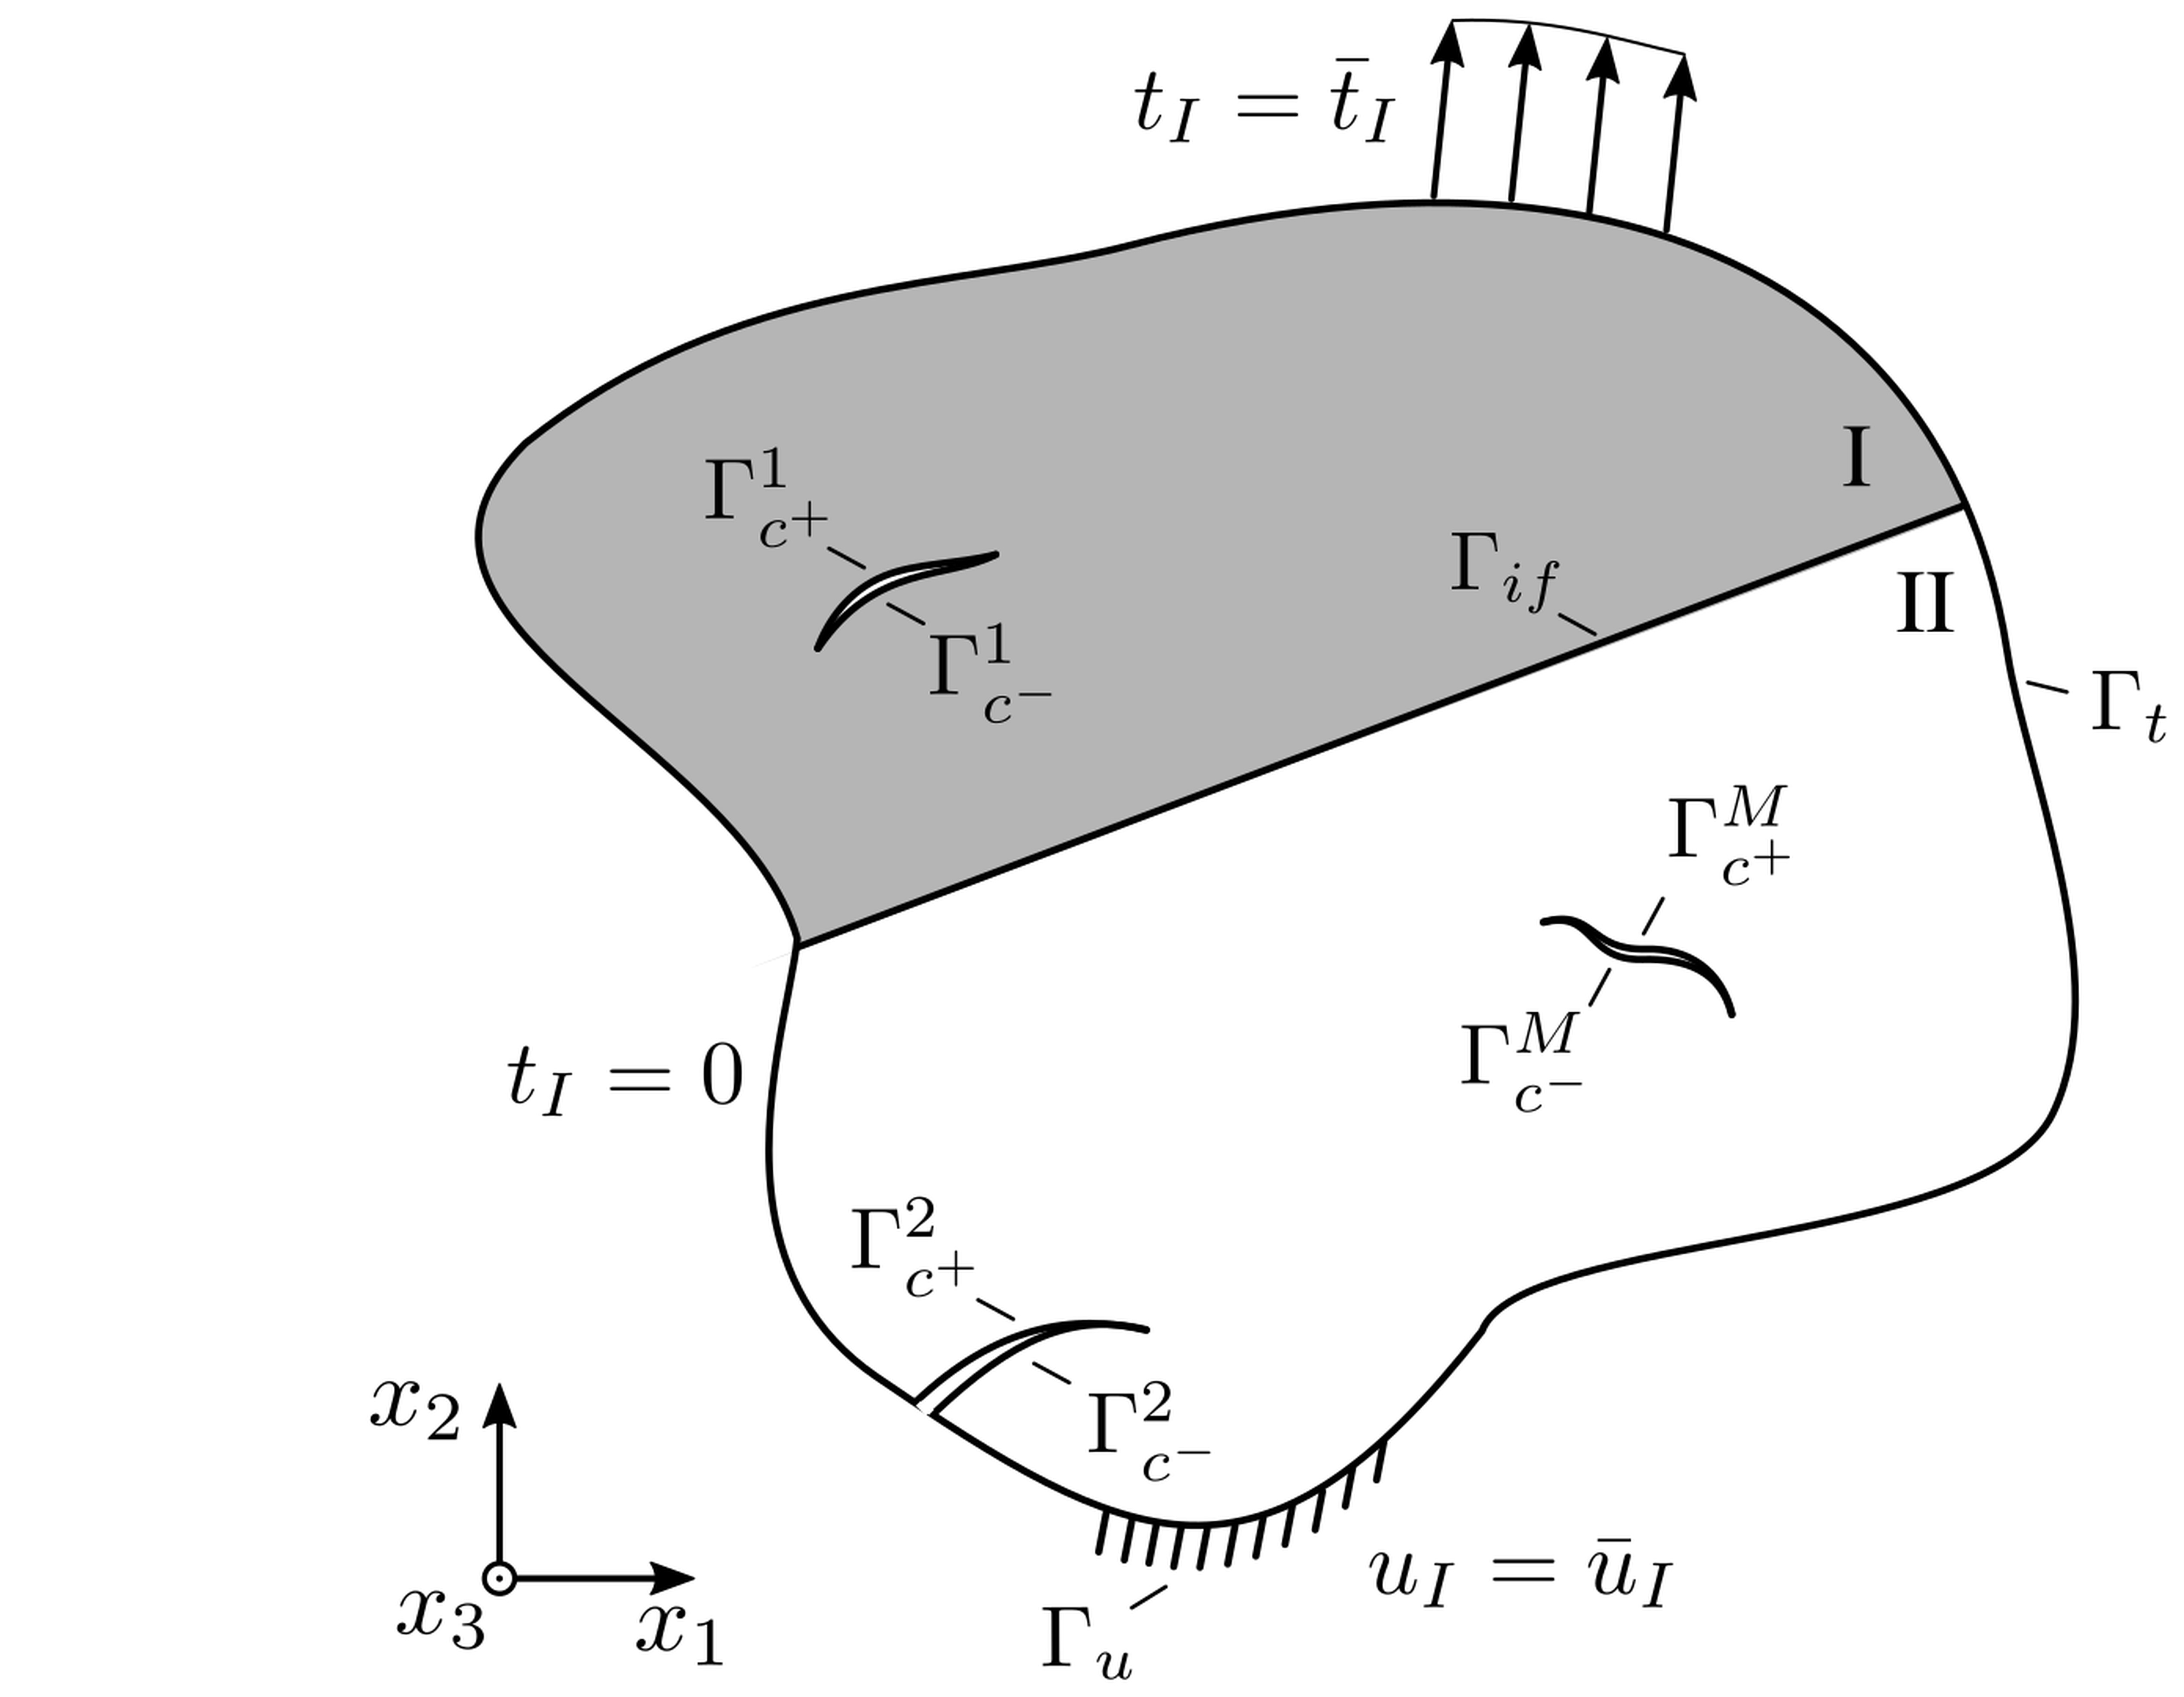
In Fig.1, ti and ui denote the traction and the displacement components, Γmc+ and Γmc- define the upper and the lower crack-faces, Γt represents the external boundary where the tractions ti are given, and Γu is the external boundary where the displacements ui are prescribed. Γif is the boundary of the interface between two homogeneous subregions Ωk. The stress field σj ahead of each crack tip m are defined by
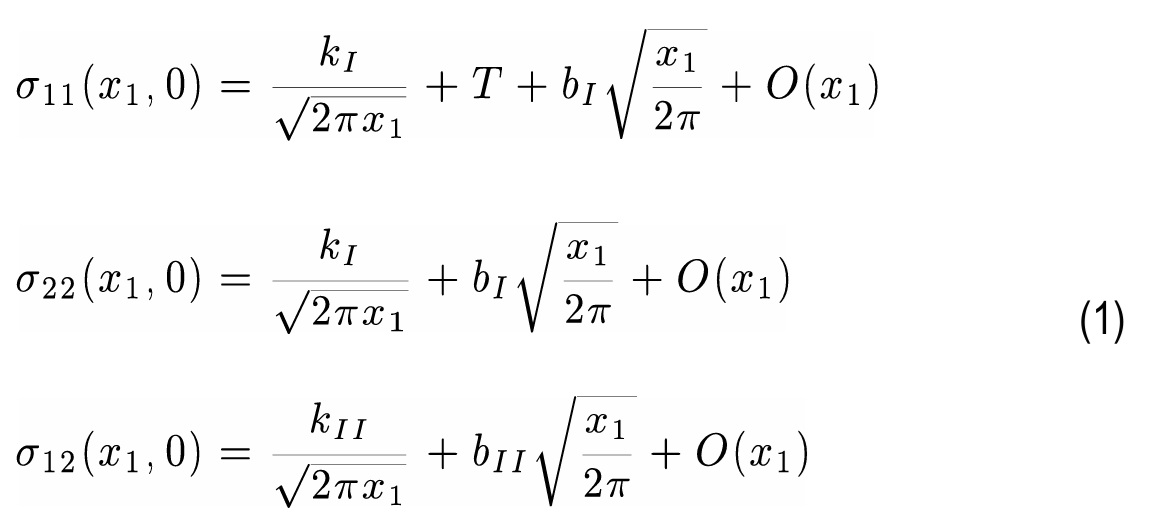
where kI and kII are the stress intensity factors (SIFs), T is the T-stress, bI, bII denote the higher order stress field parameters and O(x1) are higher order terms of the stress field. Cracks under such mixed mode loading condition show a smooth curved propagation behavior after an abrupt deflection out of its original plane as indicated in Fig. 2.
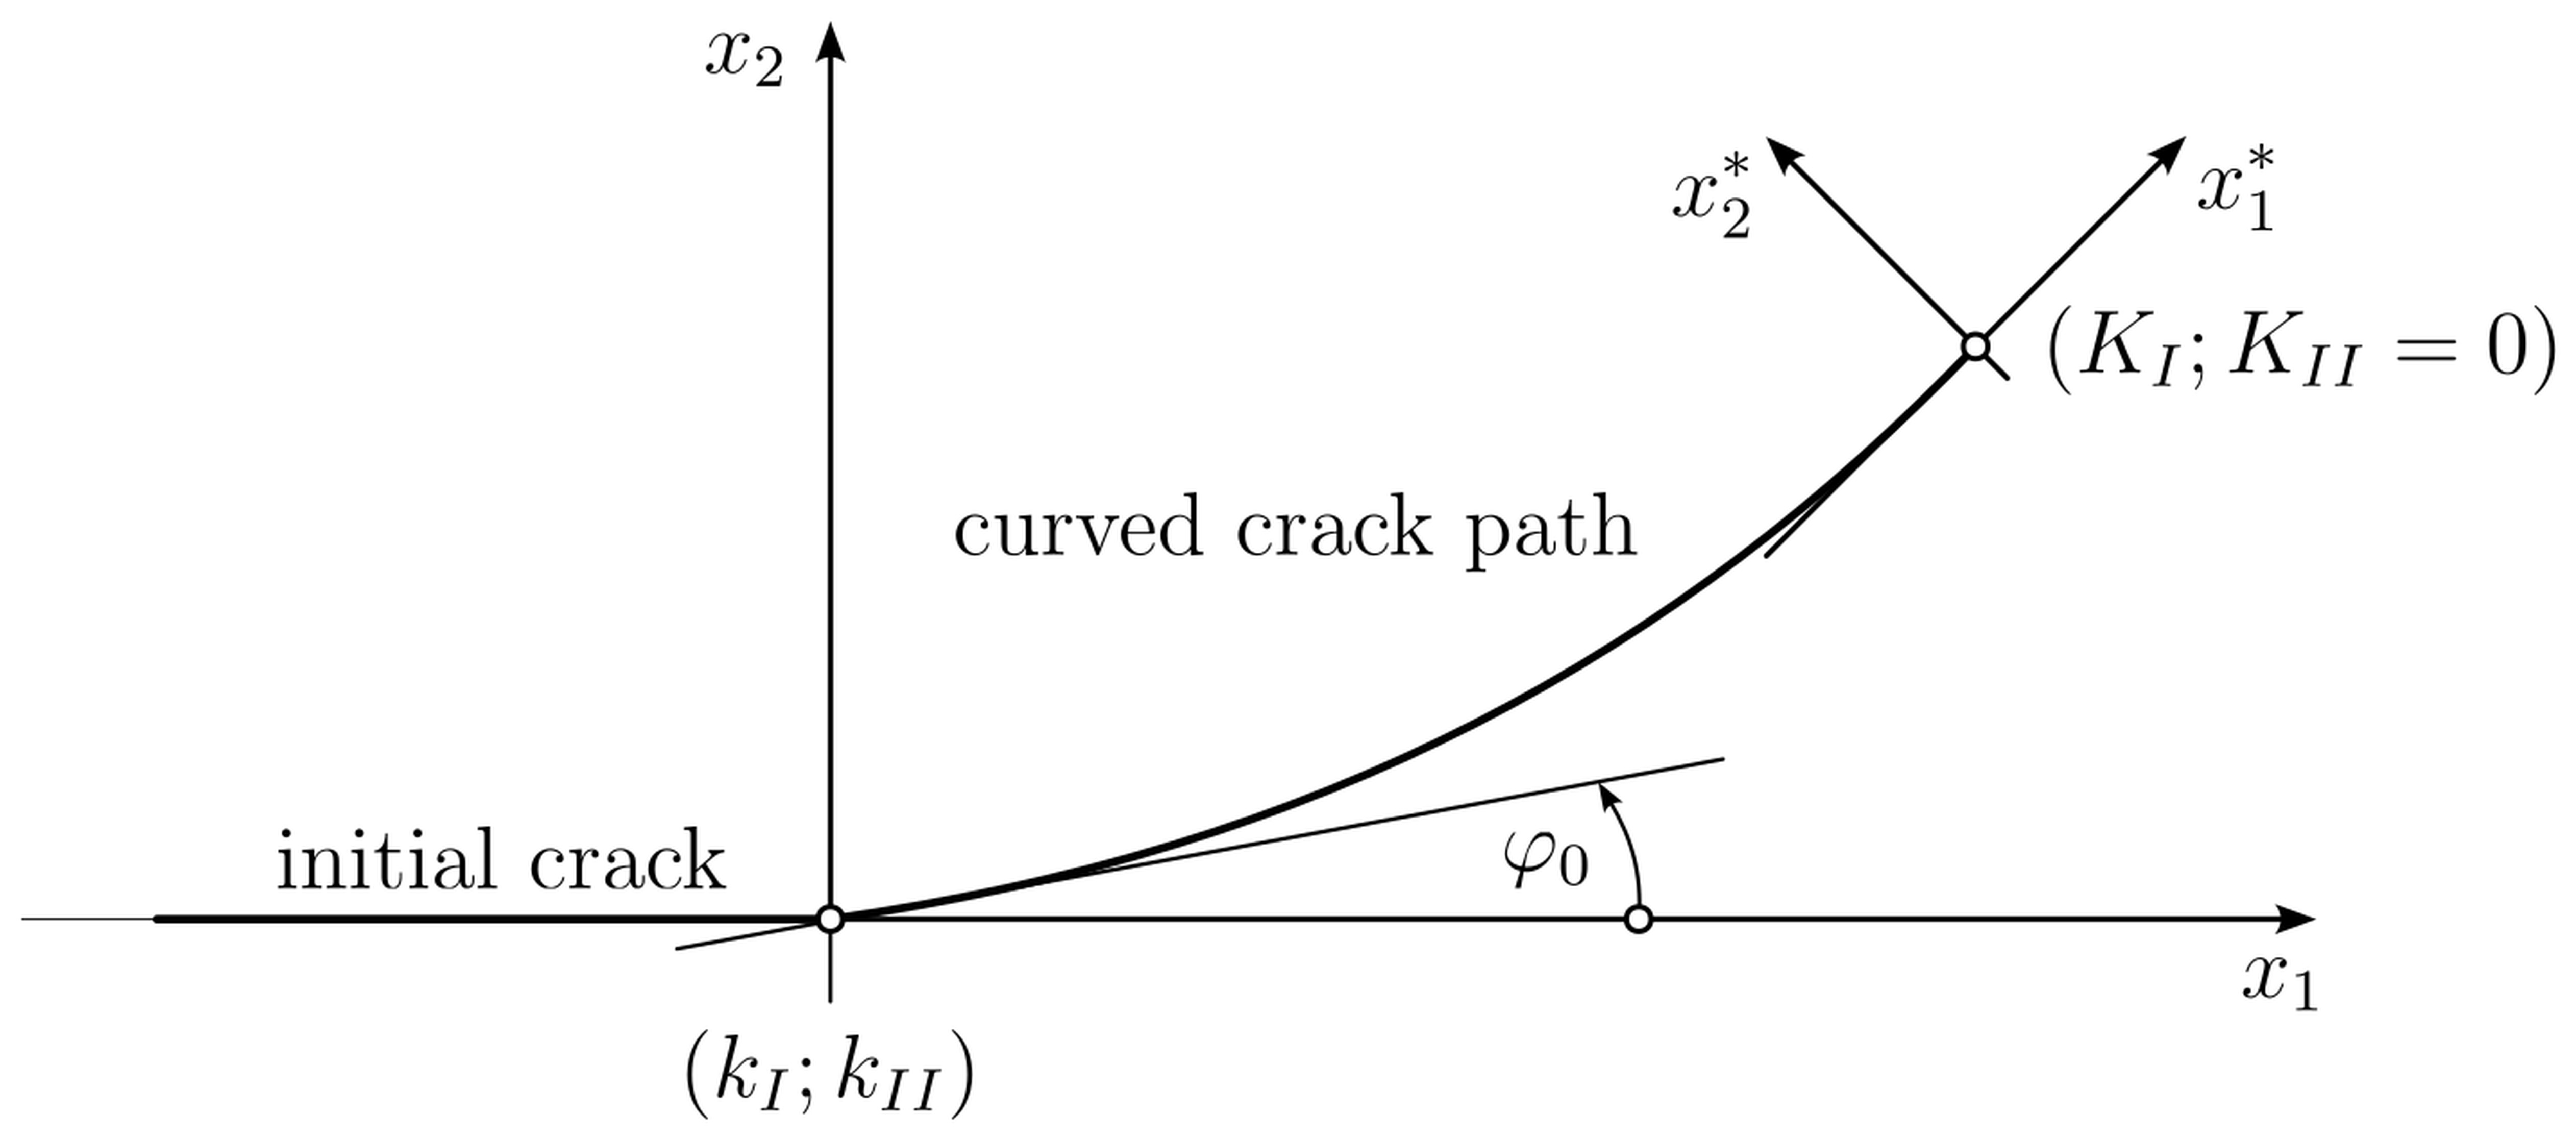
The geometrical description of the crack path can be based on the generalization of the criterion of the local symmetry [10]. In such a case the mode-II SIF vanishes and the stress field σij ahead of the deflected new crack tips m reduce to
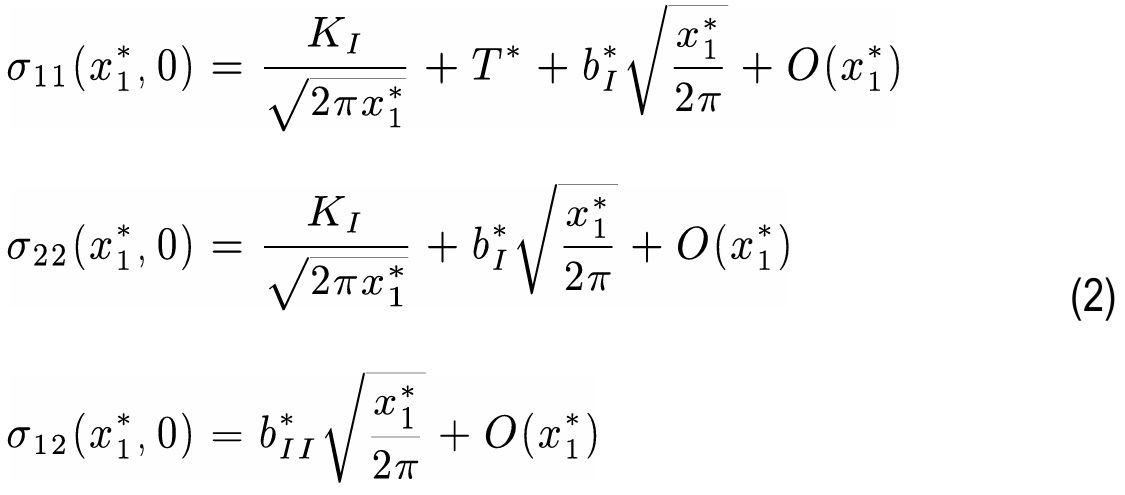
It should be mentioned that the continuous crack deflections may be caused only by the existing non-singular stresses.
Computation Of Crack Propagation
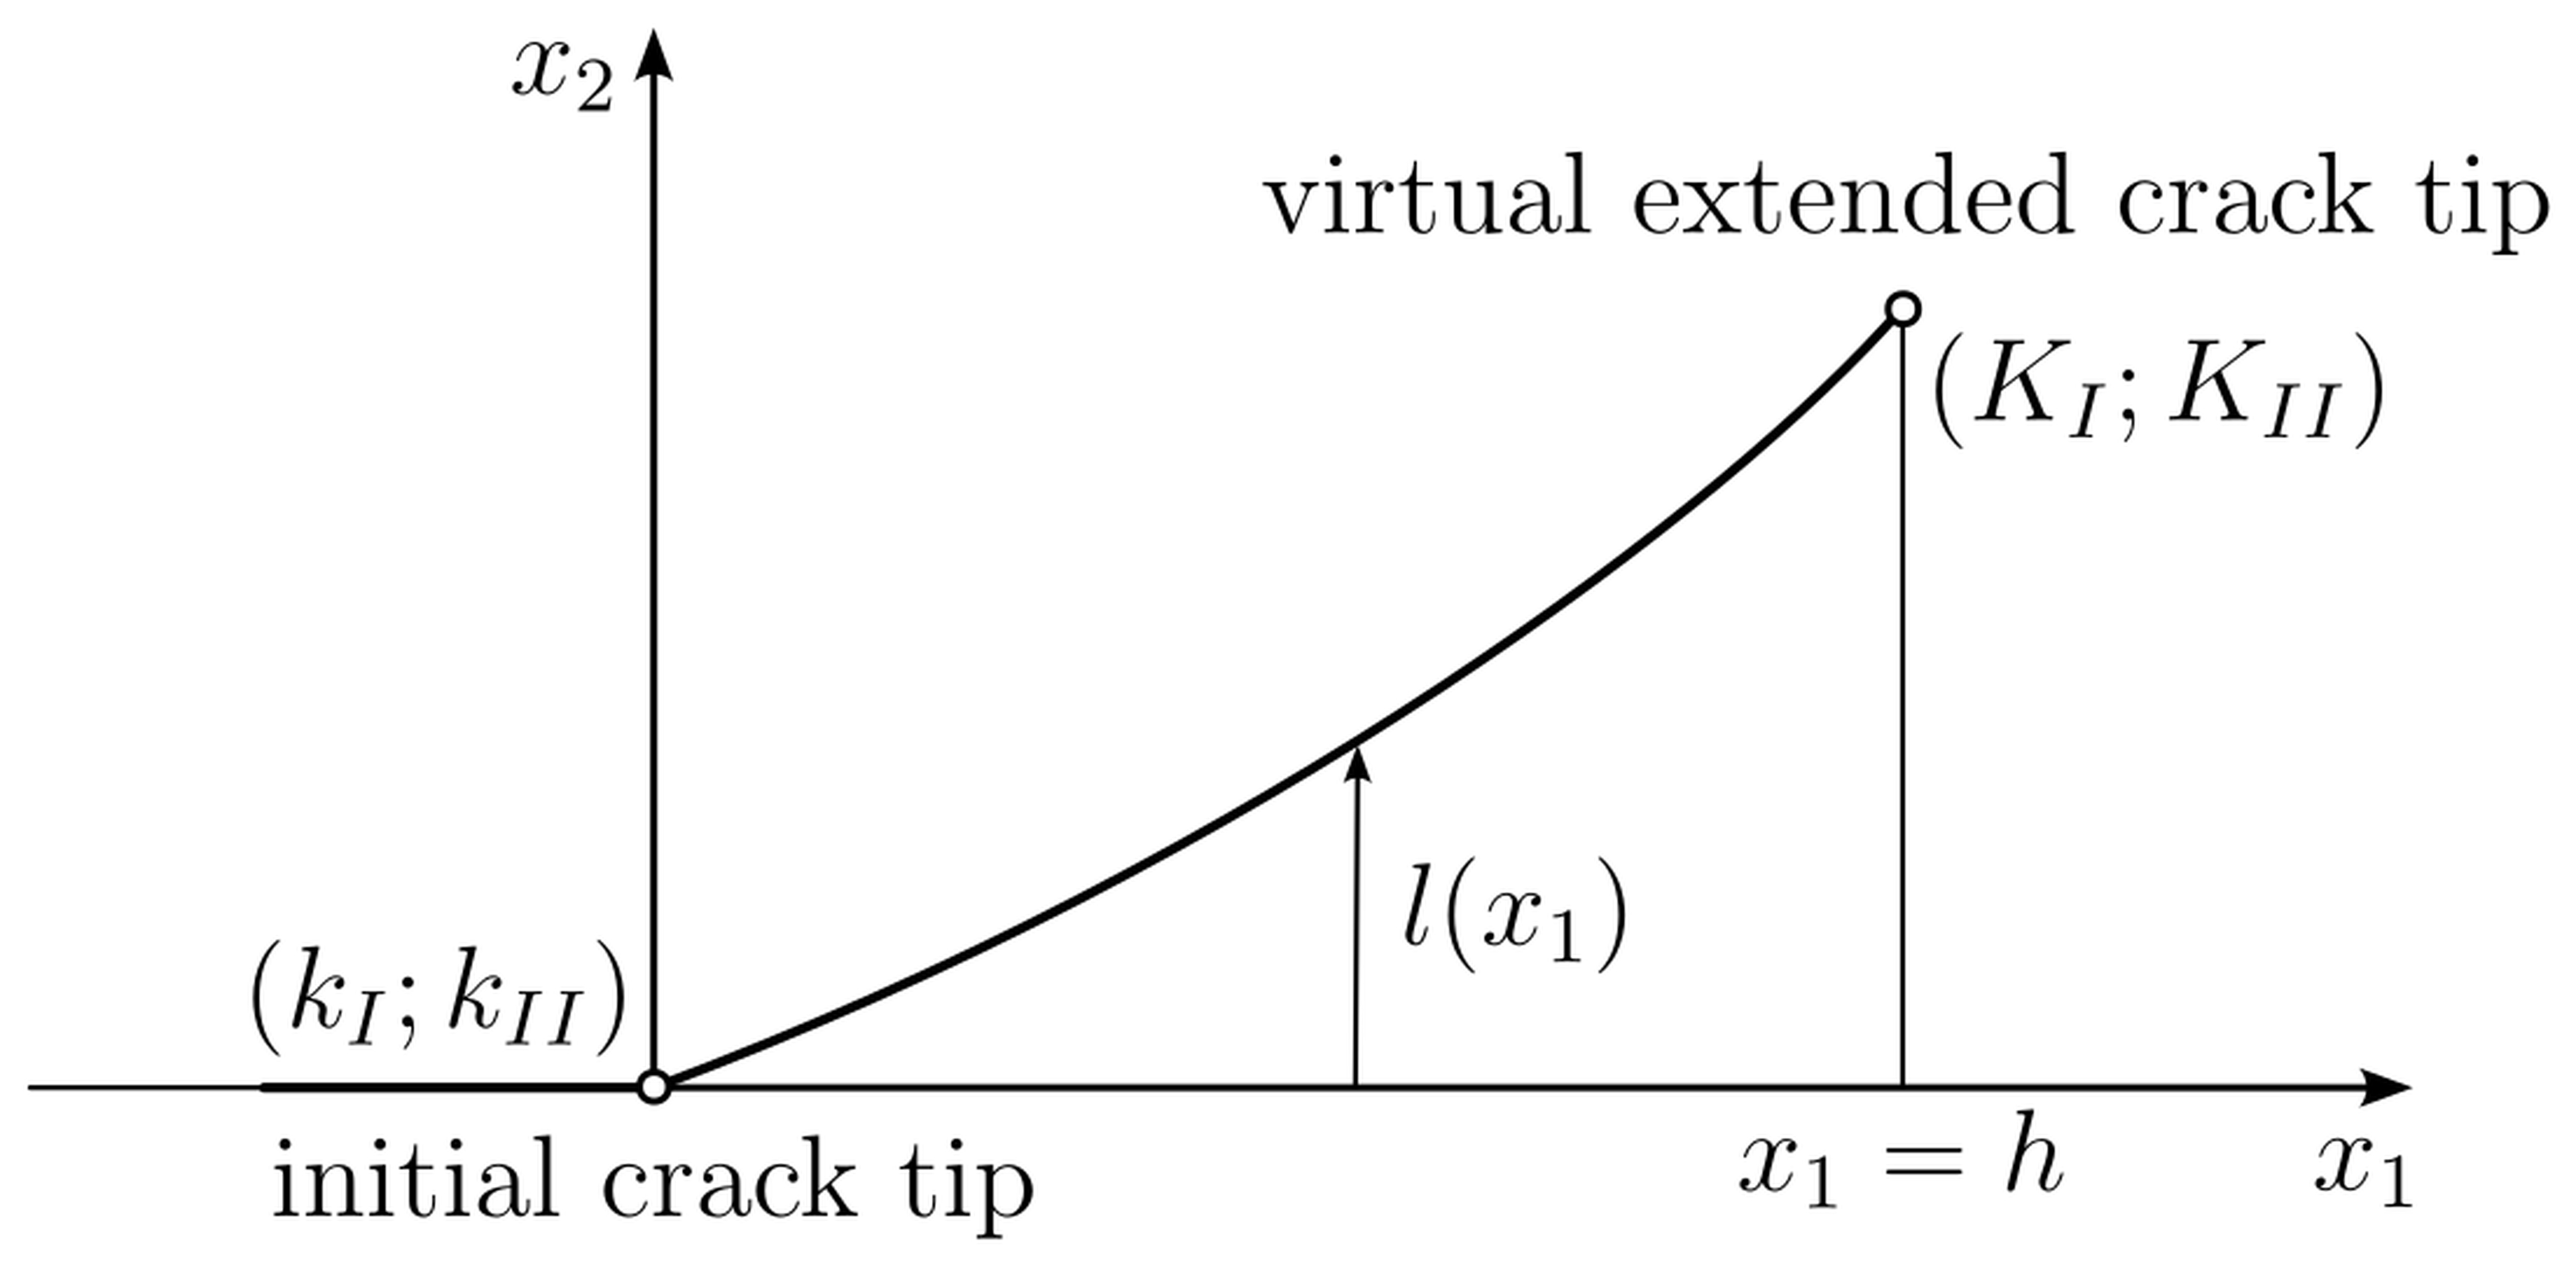
The crack path prediction can be computed by using the first order perturbation solution of a slightly kinked and curved crack as shown by Sumi [17, 18]. A virtual extended slightly kinked and smoothly curved crack path profile as shown in Fig. 3 has the form

where α, β and γ are the shape parameters.
By considering the criterion of the local symmetry for the crack propagation the mode-II SIF KII vanishes along the smooth crack path. Under this condition the shape parameters of the natural crack geometry are defined by [18]
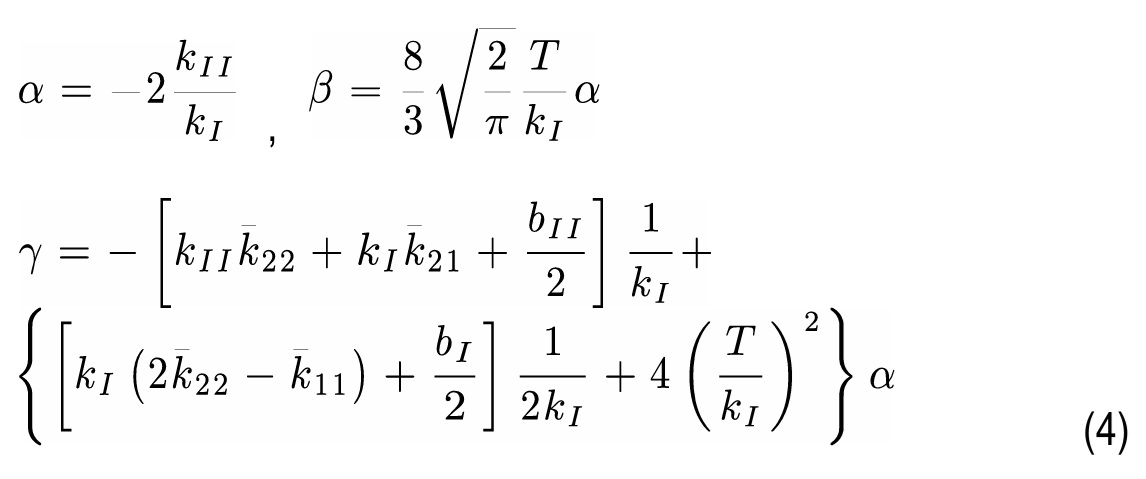
The quantities k11, k21, k22 prescribe the effects of the far field boundary conditions on the crack growth. For a initial crack tip under local symmetry condition with KII = 0 the Eqs. (4) simplify to
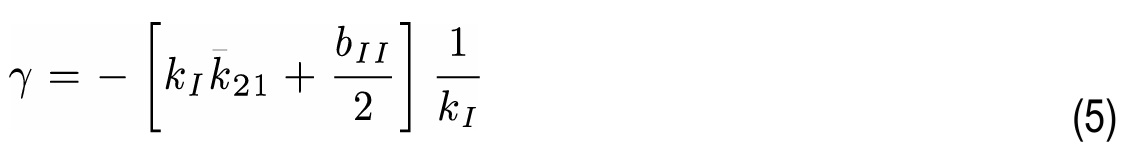
and the parabolic crack profile according to Eq. (3) reduces to
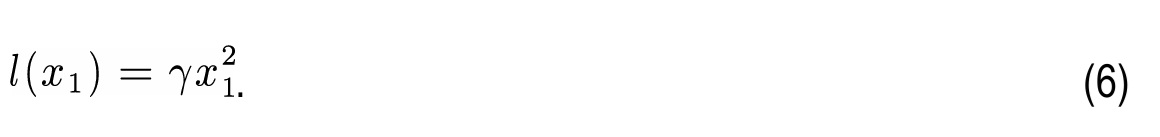
Therefore, such a initial crack will propagate with a continuous deflection without kinking. The SIFs for the virtual crack extension of the postulated straight crack may be expressed by
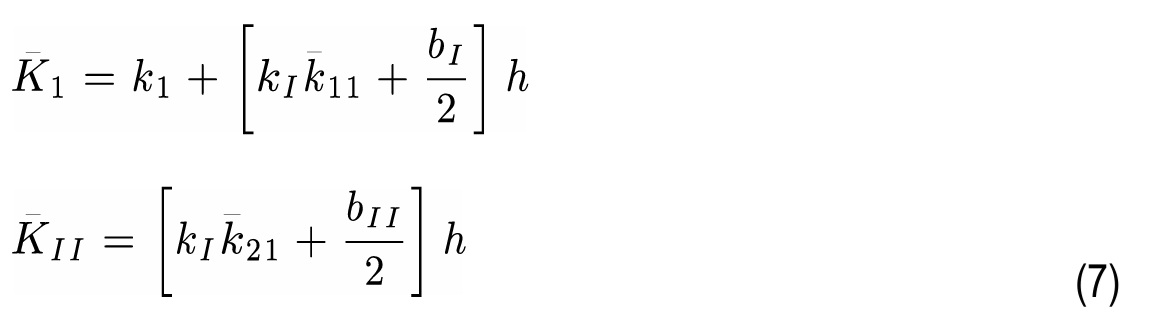
For a system of propagating cracks m (m = 1, ..., M) with compatible Δh, the geometrical quantities for each incremental steps of the simulated crack trajectories are defined by.
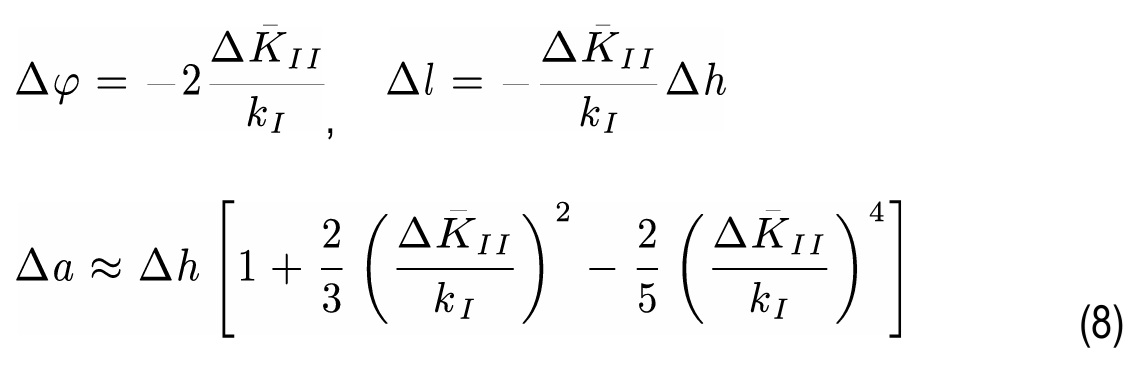
The simulation strategy of the curved propagation for each crack tip m is shown in Fig. 4.
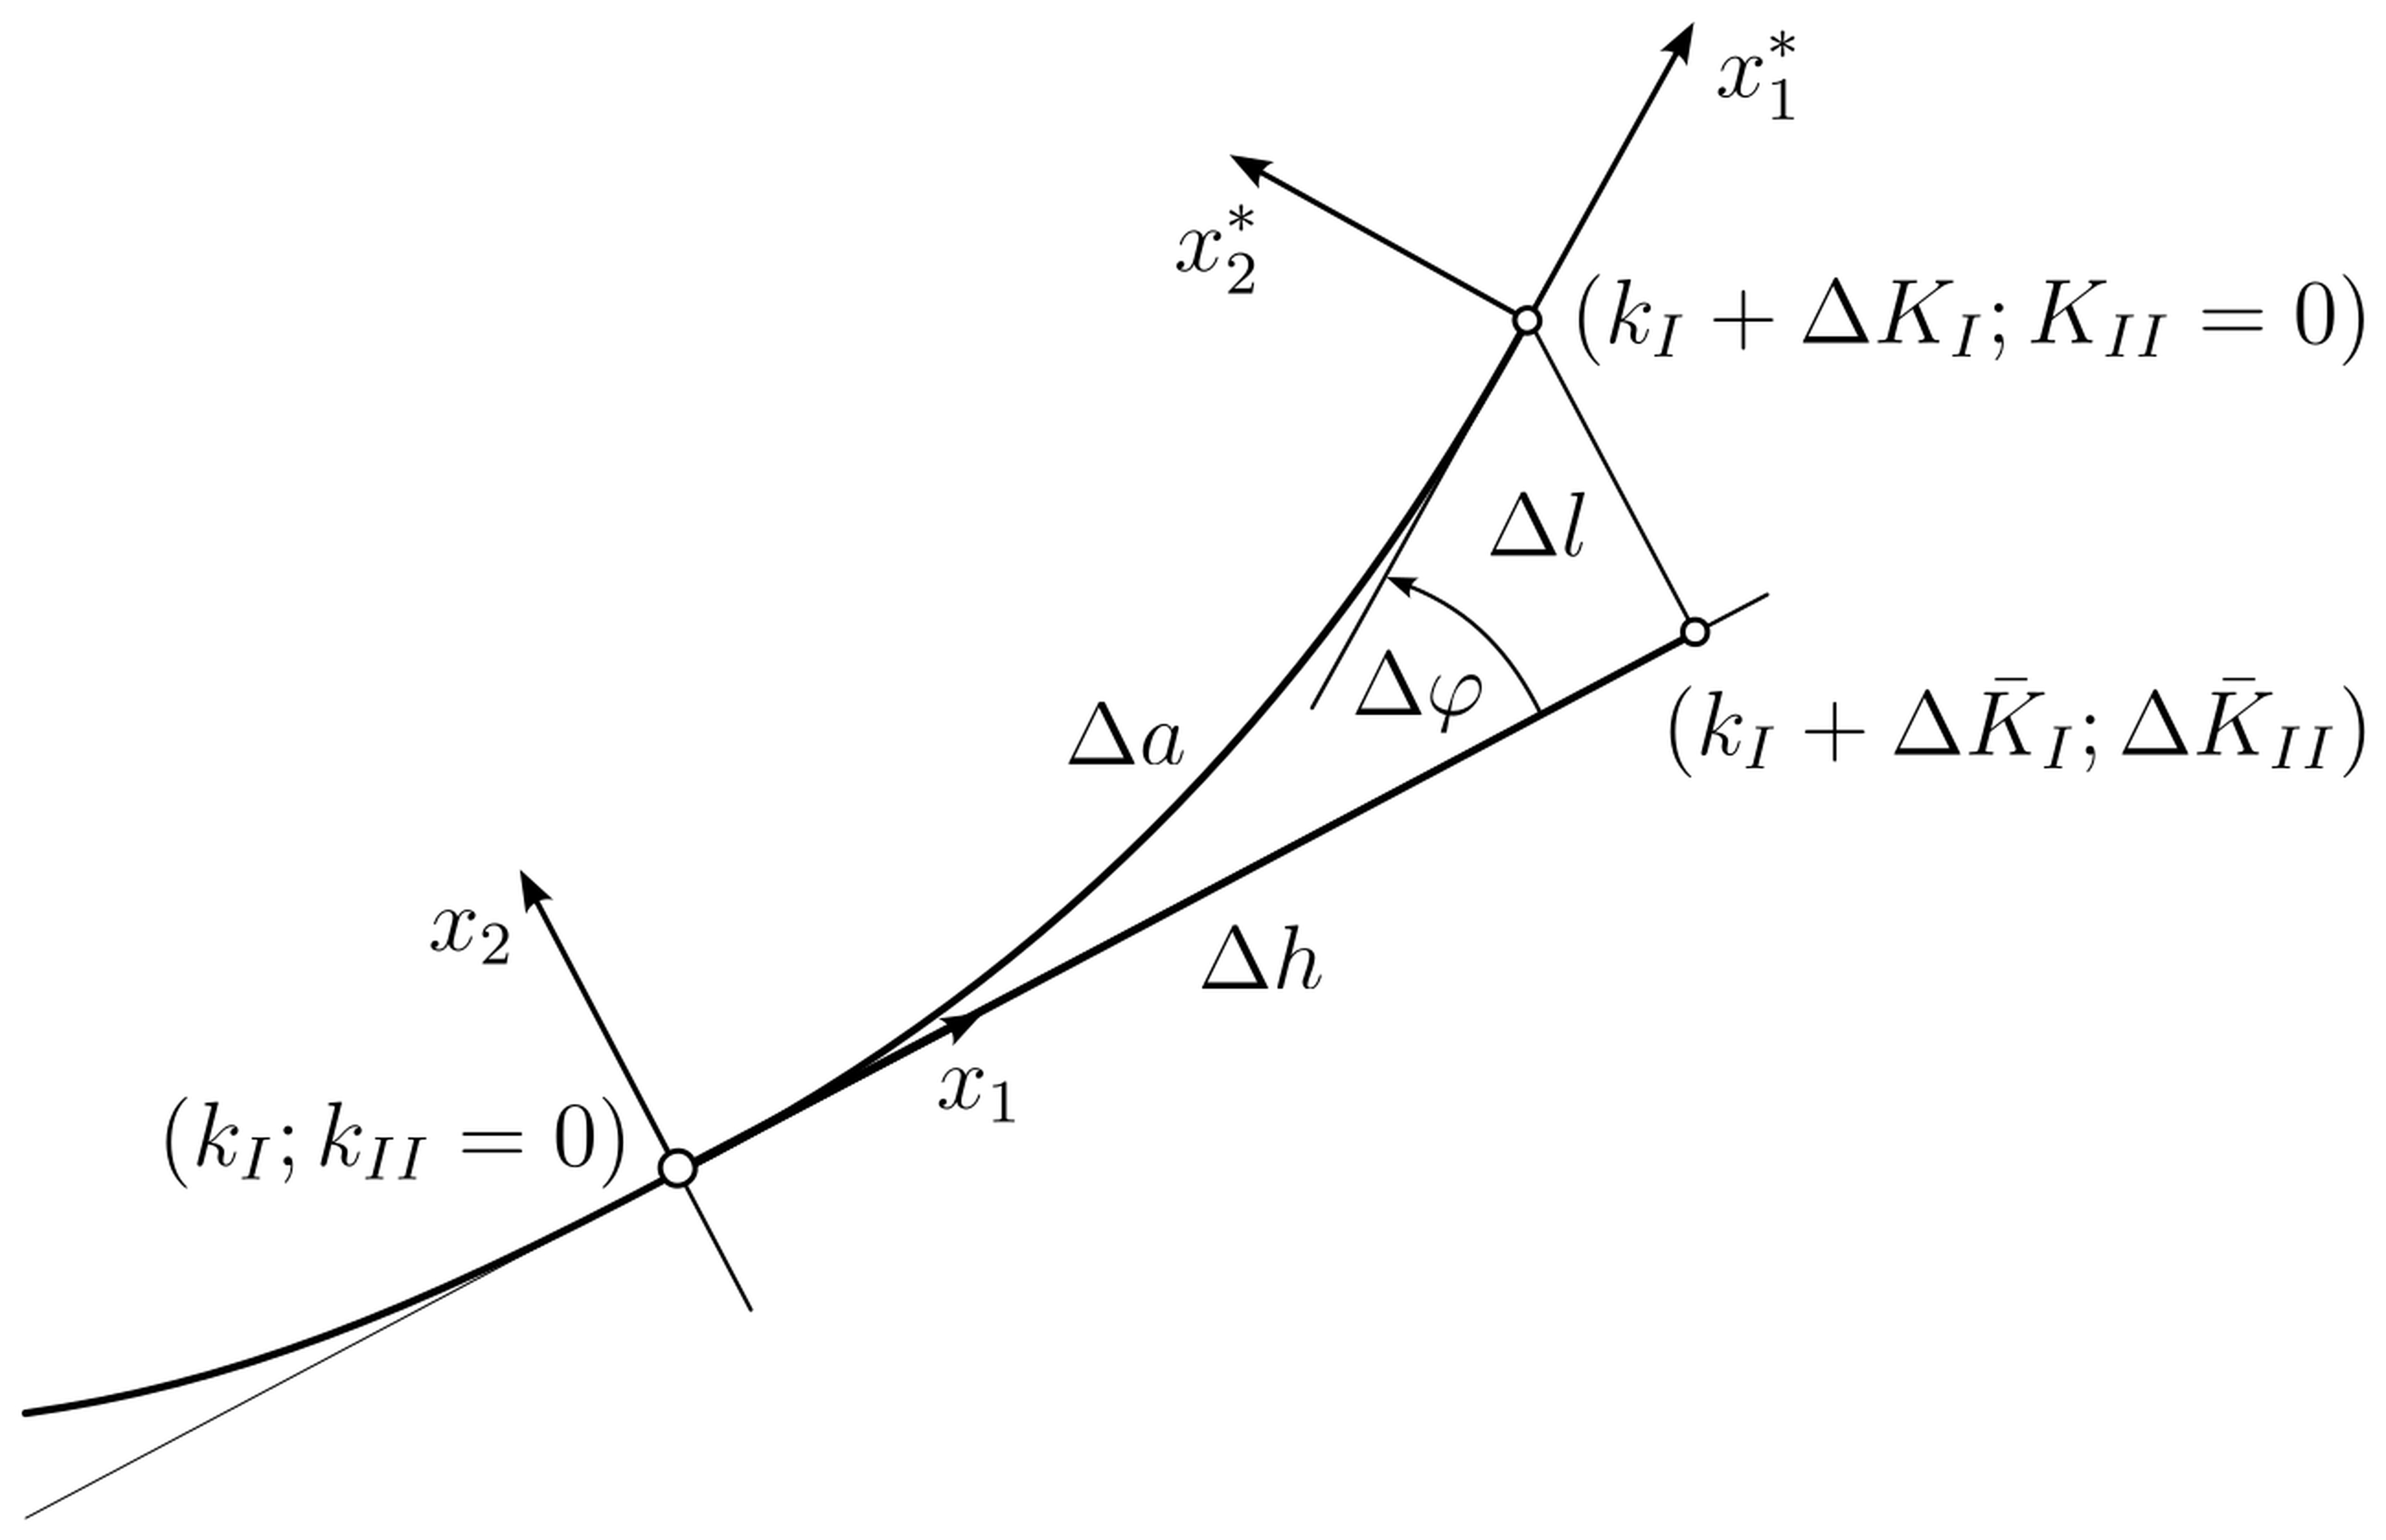
As shown in Fig. 4, according to the criterion of the local symmetry with KII = 0 the change of the slope and the locus of the crack tip is the consequence of ΔKI, ΔKII ≠ 0 for a virtual extended crack with Δh. For proportional loading conditions the computation of smooth crack paths is based on a virtual crack extension inside a predictor-step to compute KI and ΔKII in combination with a corrector-step to define the real crack geometry. The maximum increment Δhmmax of the virtual crack extension should be taken for the crack-tip m* with the maximum mode-I SIF.
The prescribed procedure can be extended for strongly curved cracks by an iterative incremental scheme for each crack-tip m. The corrector-step is repeated i-times until the condition
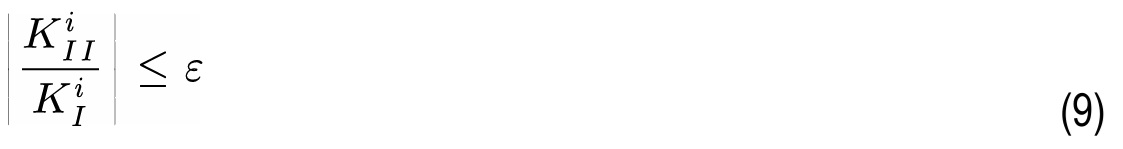
is satisfied. The iteration process is repeated until the error indicator ε is below a specified small tolerance value.
Several equations and criteria have been proposed to describe the fatigue crack propagation. If the Paris law is applied the relations
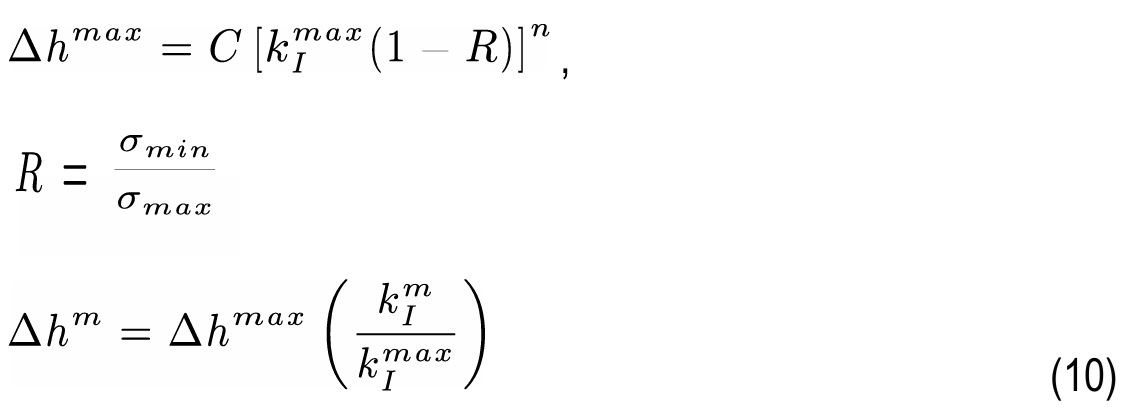
are obtained for a chosen number of loading cycles ΔN at each crack tip m [11]. Eq. (10) illustrates that the computation of the crack growth requires highly accurate SIFs in order to reduce numerical errors in the computation of the crack extension increments.
Failure Assessment Diagram
During the last decades, various assessment methods have been developed based on the fracture mechanics to asses the safety of structures with cracks. The widely used failure assessment diagram (FAD) approach considers the two mechanisms of failure brittle fracture and plastic collapse [9]. An assessment point with the parameters and is compared with the failure line computed from the material tensile properties. Two different situations for the SIFs have to be considered. For an initial mixed mode loading configuration the equivalent SIF has to be applied while the SIF has to be used for a pure mode-I situation. In the second parameter the tensile stress is the loading of the component and defines the corresponding plastic limit load [11].
Applying the FAD for real structures requires the computation of the parameter as a measure of plasticity effects. Therefore, an elastic-perfectly plastic material model with the lower bound theorem of plasticity is implemented to obtain the global plastic limit load . Only primary loading kinds are taken into account in the numerical algorithm. The plastic limit load is evaluated from the characteristic non-linear load-deformation curve.
For the practical application a iterative solution procedure is implemented in the developed FEM program. The plastic limit load is computed from the non-linear curve of the load-deformation. It should be mentioned, that the slope of this curve declines to zero during the growth of plastic deformations. It can be assumed, that the crack tips are the most loaded zones in the structure and the deformation and the slope of the load-curve has to be considered there. For this purpose, a node pair near the m-th crack tip with the maximum stress intensity factor is chosen as the deformation parameter. The crack opening displacements of these two nodes are zero for an unloaded situation and increase with the loading amplitude. This allows the computation of the load-displacement slope for the elastic and plastic case. In the numerical solution algorithm the plastic limit load is assumed if the evaluated slope of the elastic region is between 20 and 24 times higher than the plastic slope.
Linear Fatigue Damage Accumulation
As observed in real fracture mechanics problems additional cracks can be initiated during the crack growth process. In order to take such new cracks in the numerical solution into account, a damage model in combination with a linear fatigue accumulation is applied. The Smith-Watson-Topper (SWT) parameter based on the mechanism of the Coffin-Manson relationship is used for the lifetime predictions. The model takes the influence of the cyclic mean stress into account and can be written as
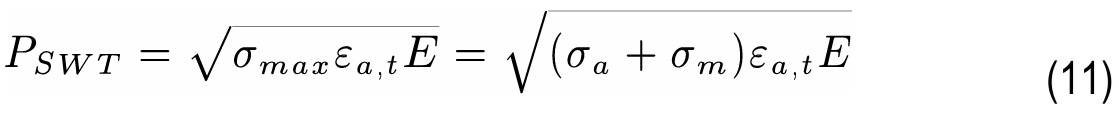
Here, is the total strain amplitude, is the maximum stress calculated from the stress amplitude, , is the mean stress and is the Young’s modulus. Taking the Wöhler line into account for the variable middle stress and strain the PSWT is defined by
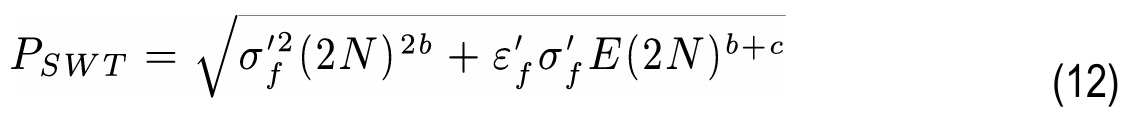
In eq. (12) and , denote the fatigue strength coefficient and the fatigue ductility coefficient, , and are the fatigue strength exponent, the fatigue ductility exponent and the number of the cycles. According to the Palmgren-Miner hypothesis the damage degree can be expressed as the sum of the cumulative damage fractions with
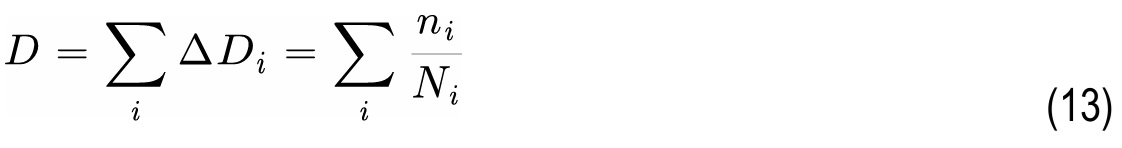
where is the number of the applied cycles and being the number of the cycles to failure. An initiation of a crack is assumed at D = 1.
Simulation Program
The principle structure of the developed simulation program with the applied steps are shown in the following Fig 5.
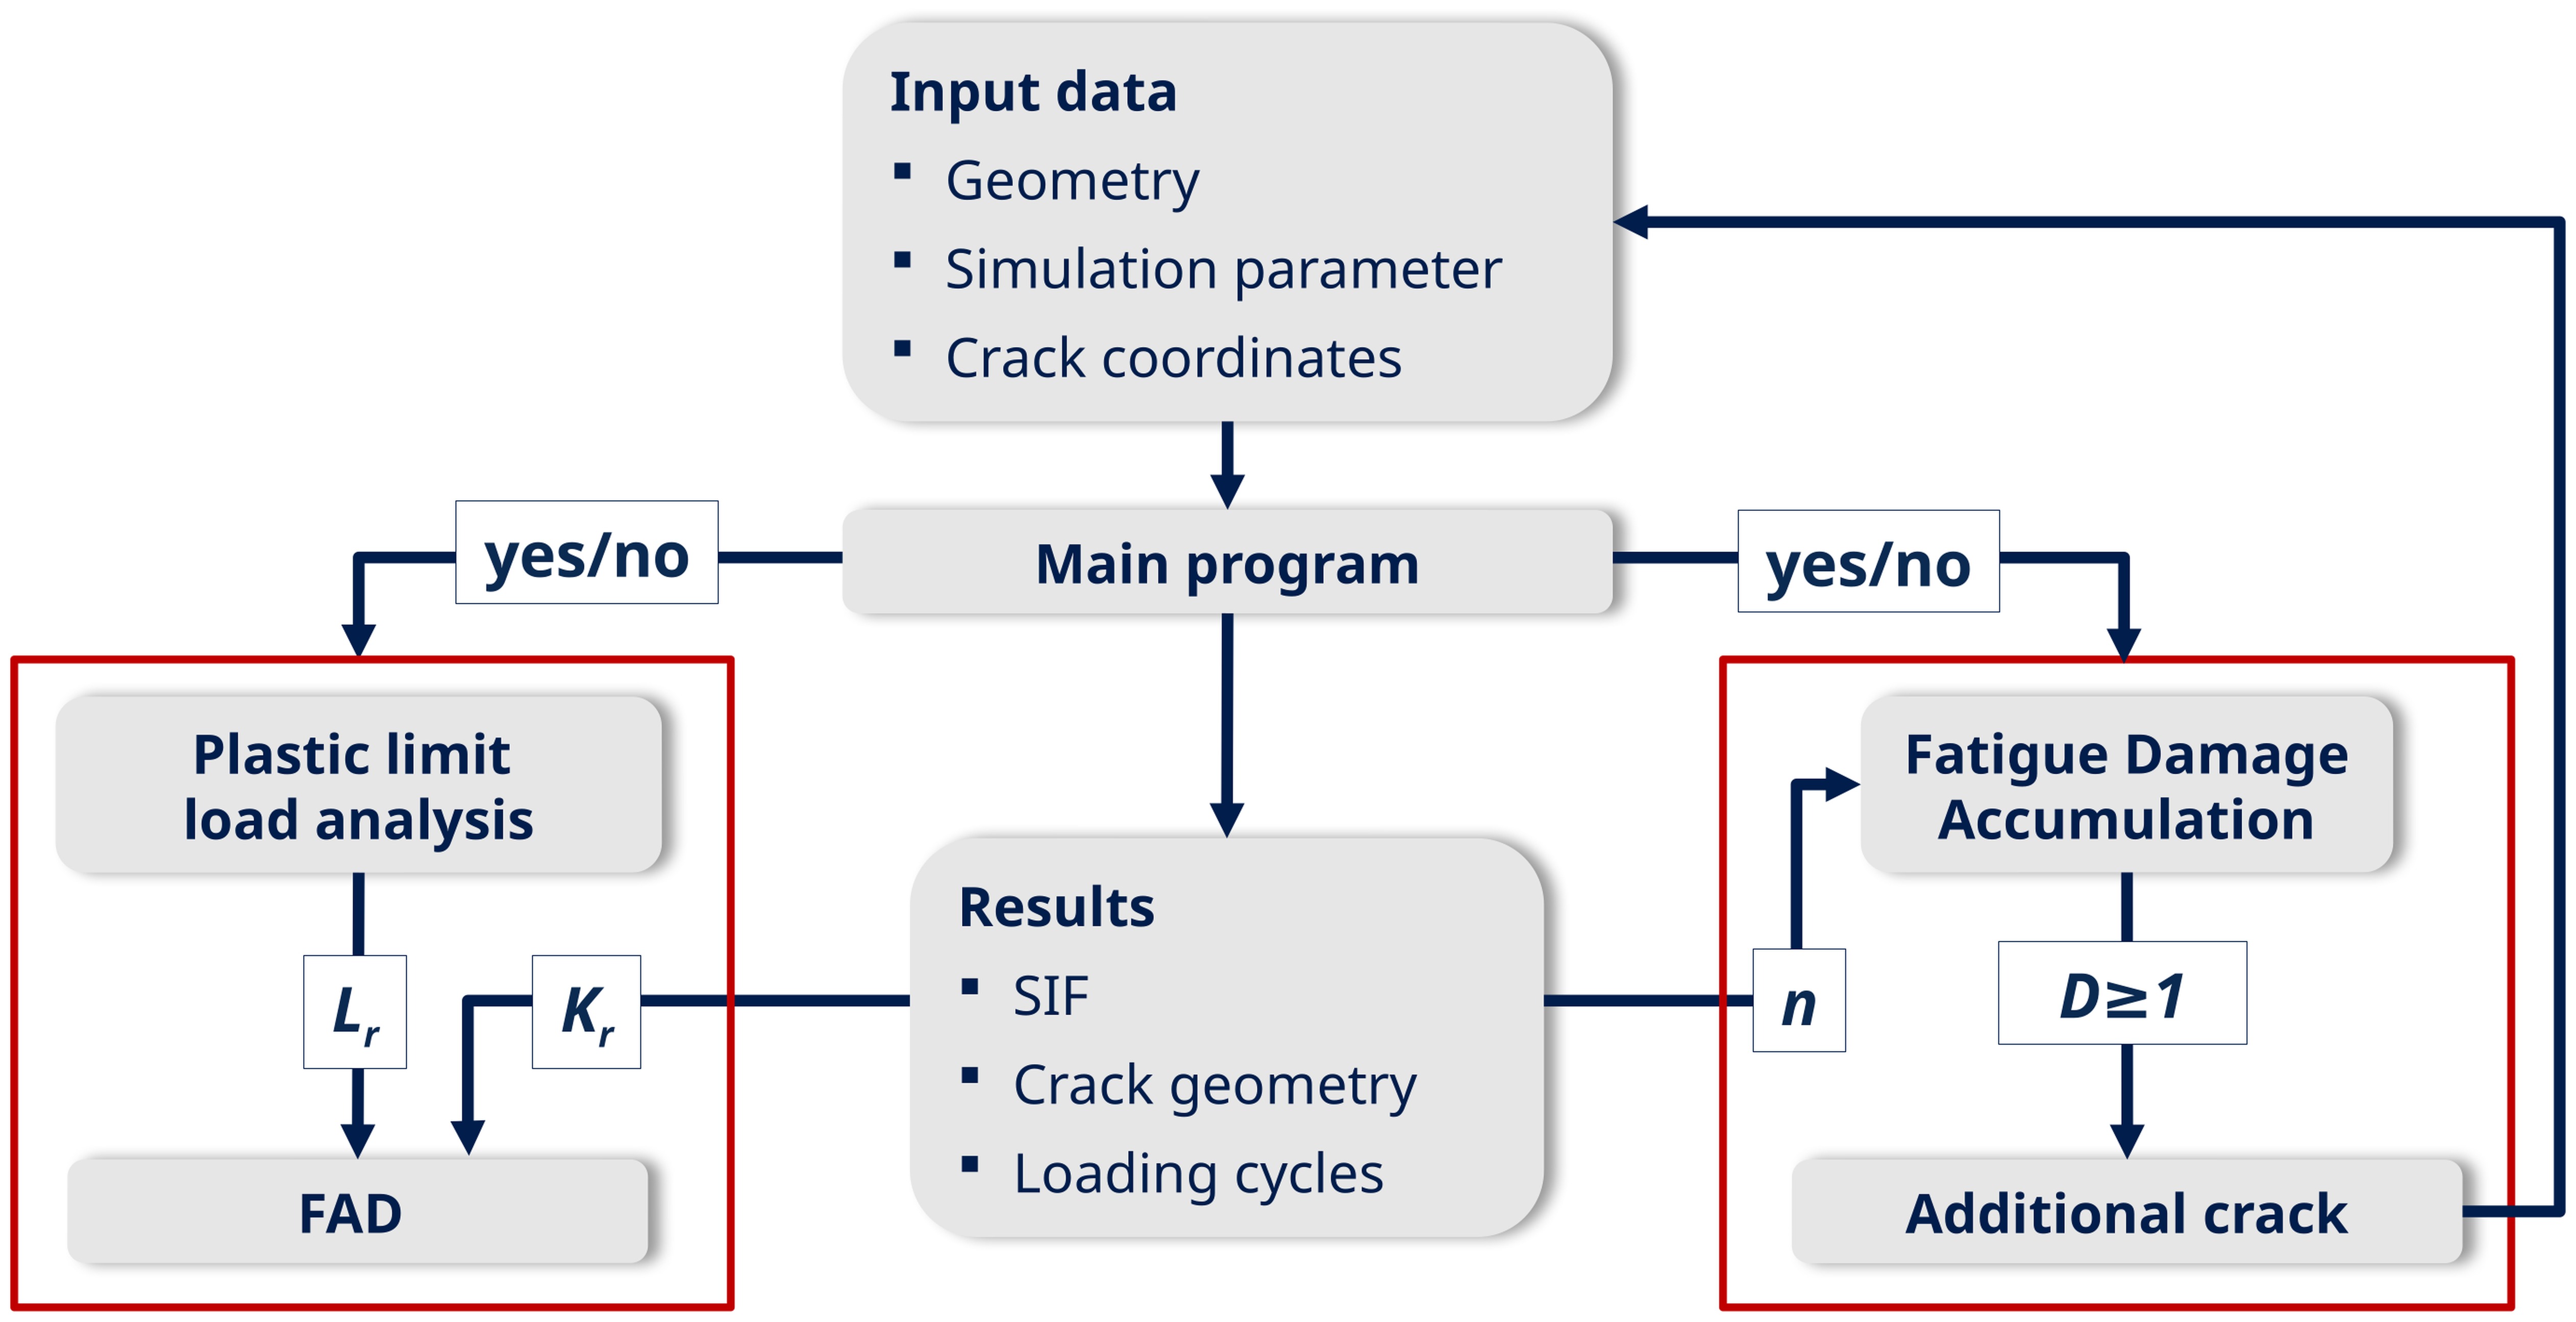
In the first part of the solution algorithm the stress intensity factors and the crack propagation for a linear elastic material behavior is computed. Further, the elastic slope is evaluated. In the following the same crack configuration with elastic-perfectly plastic material behavior is considered. The applied loading changes in the iteration procedure until the plastic slope criterion is satisfied. In the third part of the solution algorithm the damage parameter D is computed for each node at the boundary of the structure. If the damage parameter is equal or greater to one an additional crack is introduced in the model at this location. If the plastic zones between two crack tips connect each other the two cracks are joint together.
Numerical And Experimental Results
In the following, numerical results are presented and compared with experimental findings. Plane stress conditions and the von Mises plasticity are taken into account. The whole described approach has been implemented in an FEM program system. It should be mentioned, that the fully automatic strategy for proportional loading systems does not require any user interaction during the simulation process.
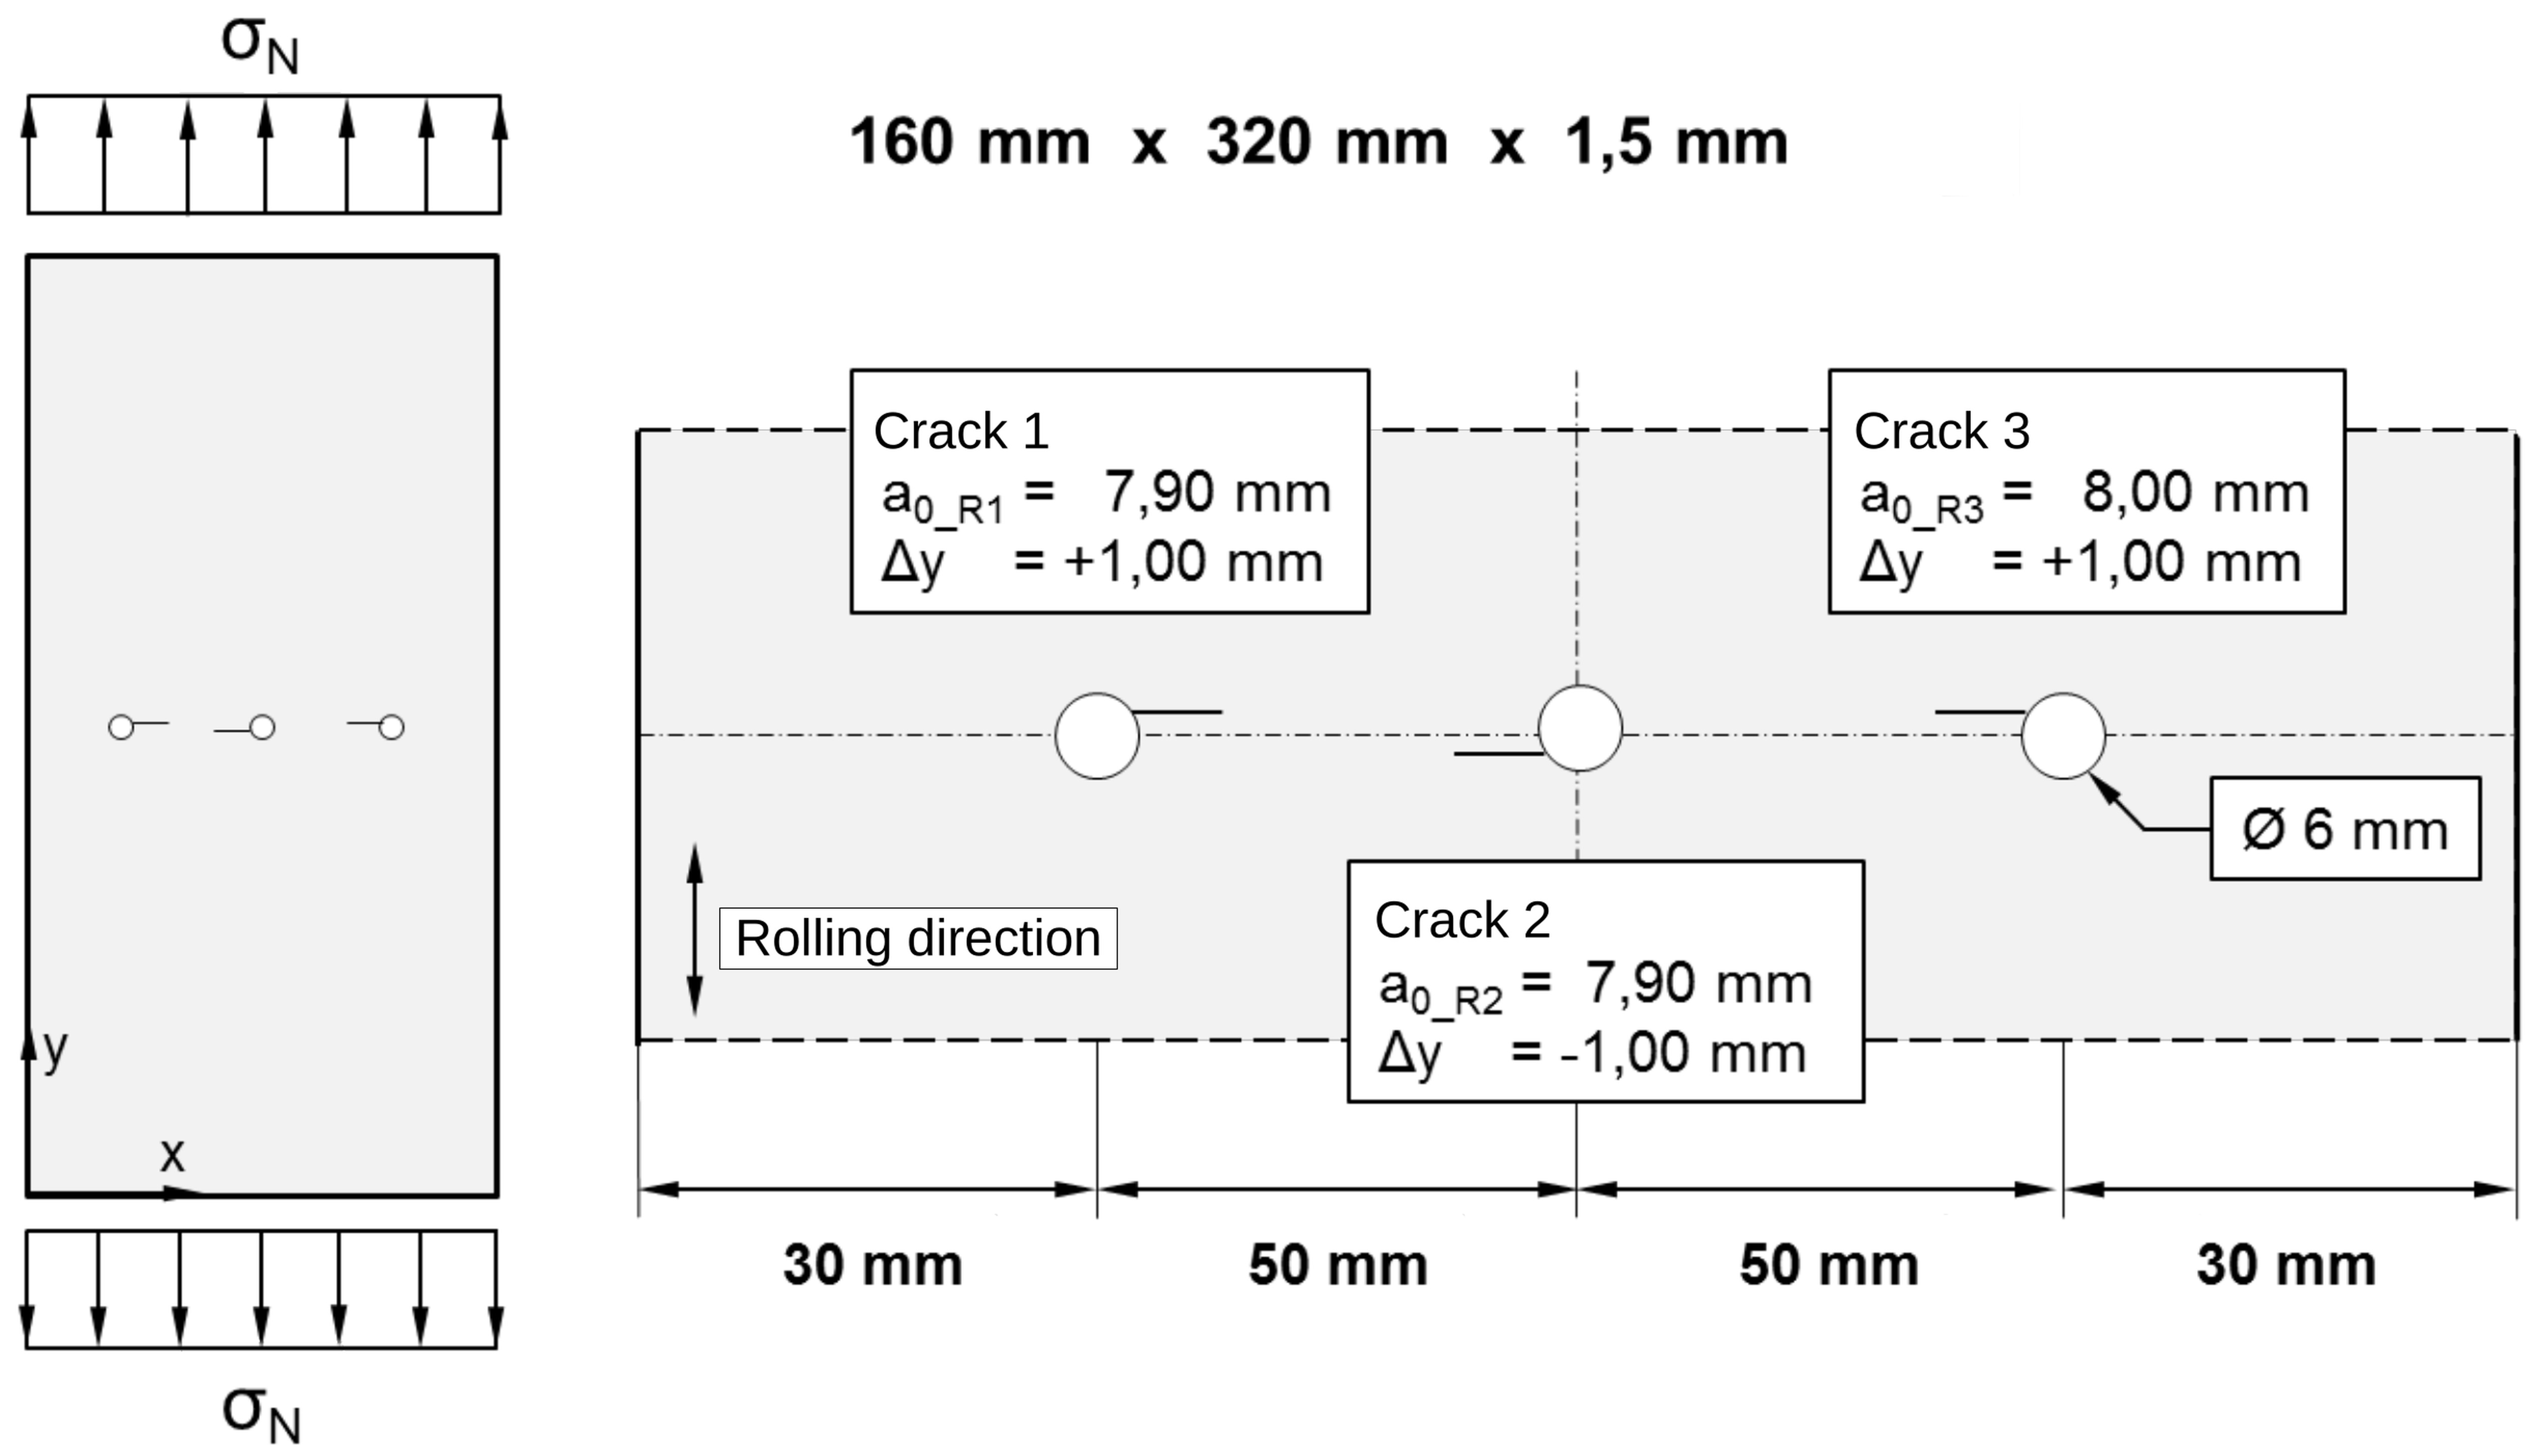
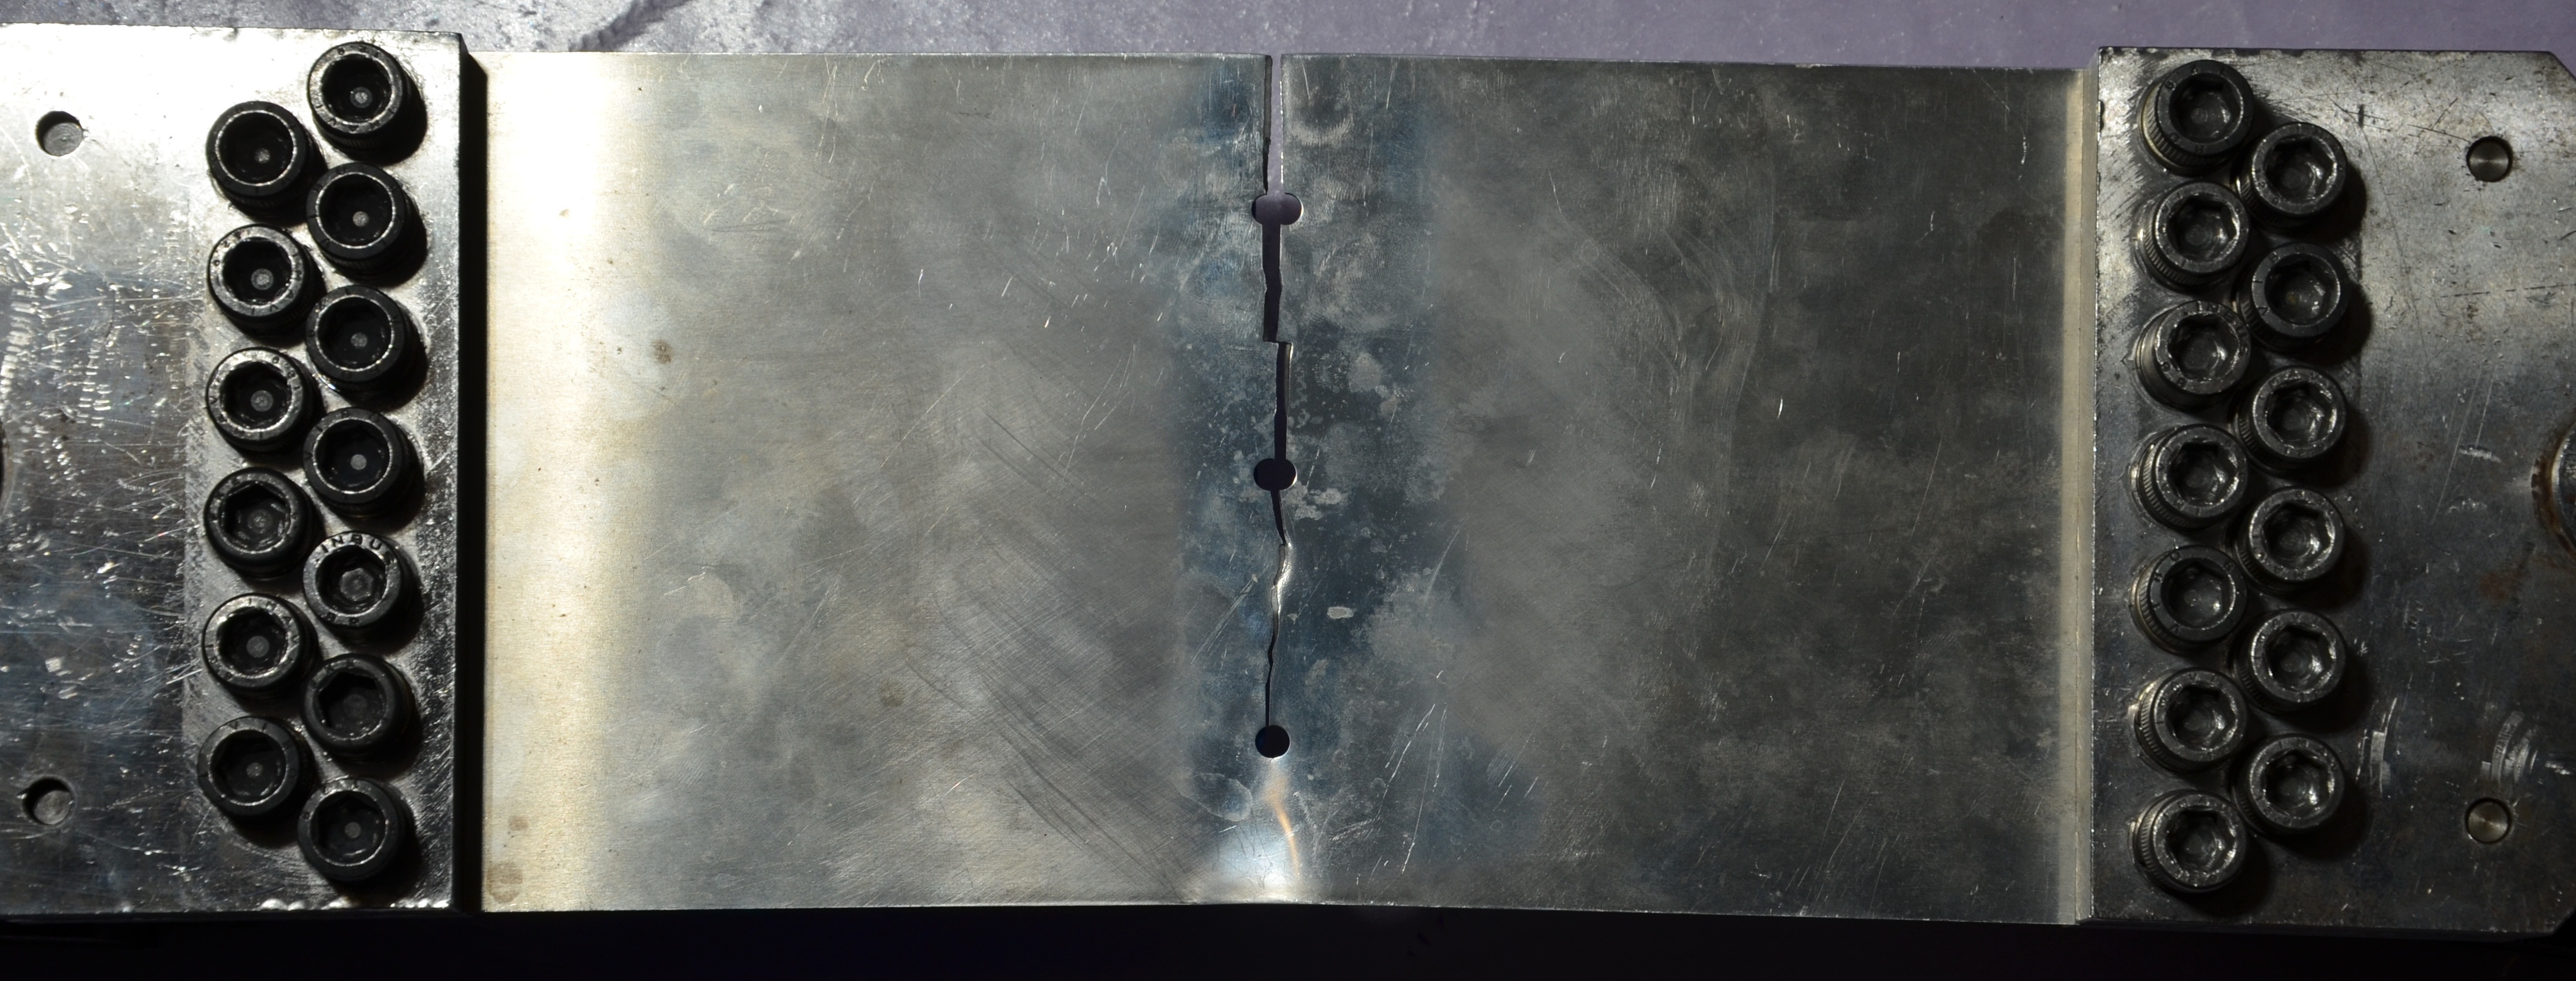
To verify the developed simulation concept, experimental investigations are carried out on a rectangular plate with the dimensions 160mmx400mmx1.5mm. The gripping was done on each end of the specimen on an area of 50 mmx160 mm with 13 screws M12 at a fastening torq of 35Nm. Three holes with a diameter of 6 mm and initial crack configuration were made by electro-discharge machined (EDM) as shown in Fig. 6. The thickness of the slits was 0.25 mm. Such a crack configuration can be observed in many thin-walled sheets at holes for rivet and screw connections.
For the numerical Model a homogeneous loading was applied on a specimen length of 320mm. The initial crack length a0 is determined in numerical simulations in advance of the test to satisfy that all three cracks initiate almost simultaneously at the beginning of the test and are capable to propagate. As material 2024-T3 aluminum alloy is used. Due to the rolling process during the manufacture, this material exhibits slightly orthotropic material properties. The difference in the elasticity modules longitudinal and transverse to the rolling direction is less than 10%. Therefore, such materials are assumed to be isotropic in the numerical computations of engineering applications [9]. The numerical simulation and experimental evaluation of the results are performed in the L-T direction, i.e., for a loading longitudinal to the rolling direction and the crack plane transverse to the rolling direction. The used material properties are defined by:
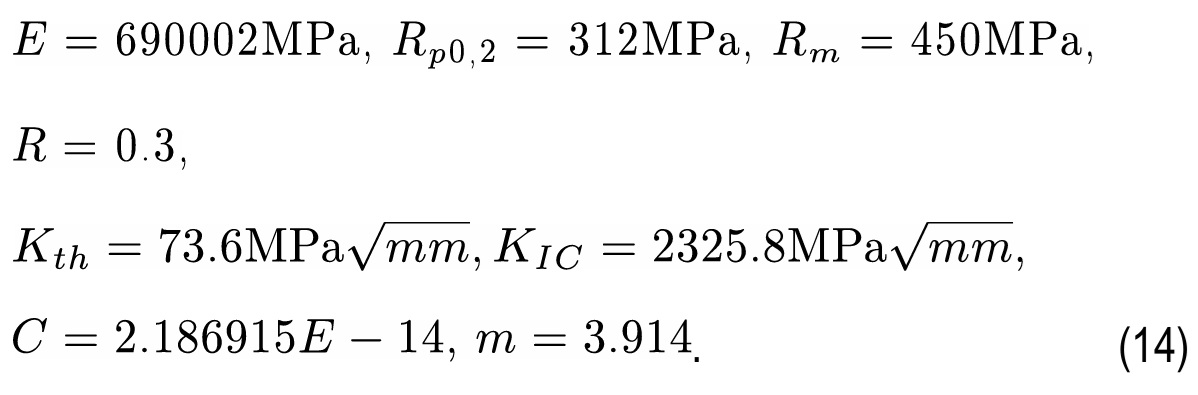
The static fracture initiation value KIC used for the calculation is a formally elastic converted JIC value, which was determined in accordance with ASTM E1820 on 10 mm thick samples of material from the same batch. The cyclic crack properties Kth, C and m were taken from the Material-Database delivered with AFGROW (Version 4.12.15.0) at R=0,3. C and m are given for the unit system MPa√m and MPa√mm.
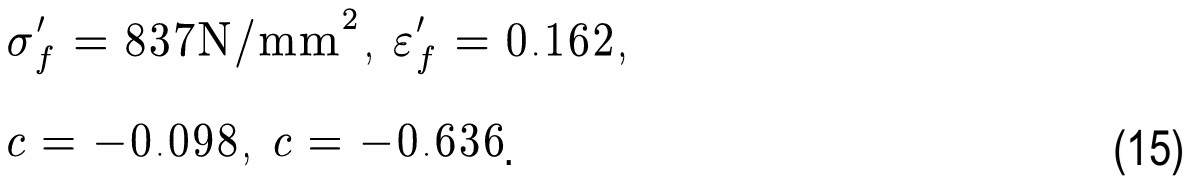
The applied Smith-Watson-Topper parameters are given in [5] by:
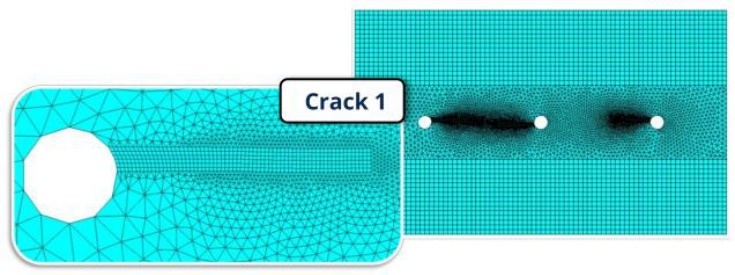
The used FEM mesh for the numerical simulation and the specimen with the gripping for the experimental evaluation of the computed results are shown in Fig. 7 and Fig. 8.
The experimental investigations are carried out on a servo-hydraulic testing machine (MTS 880) with a maximum force of 500kN under force control. The test specimen is cyclically loaded with 27.6kN, an R ratio of R=0.3 and a frequency of f=8Hz. Crack propagation is optically documented by using a high-resolution camera system [11].
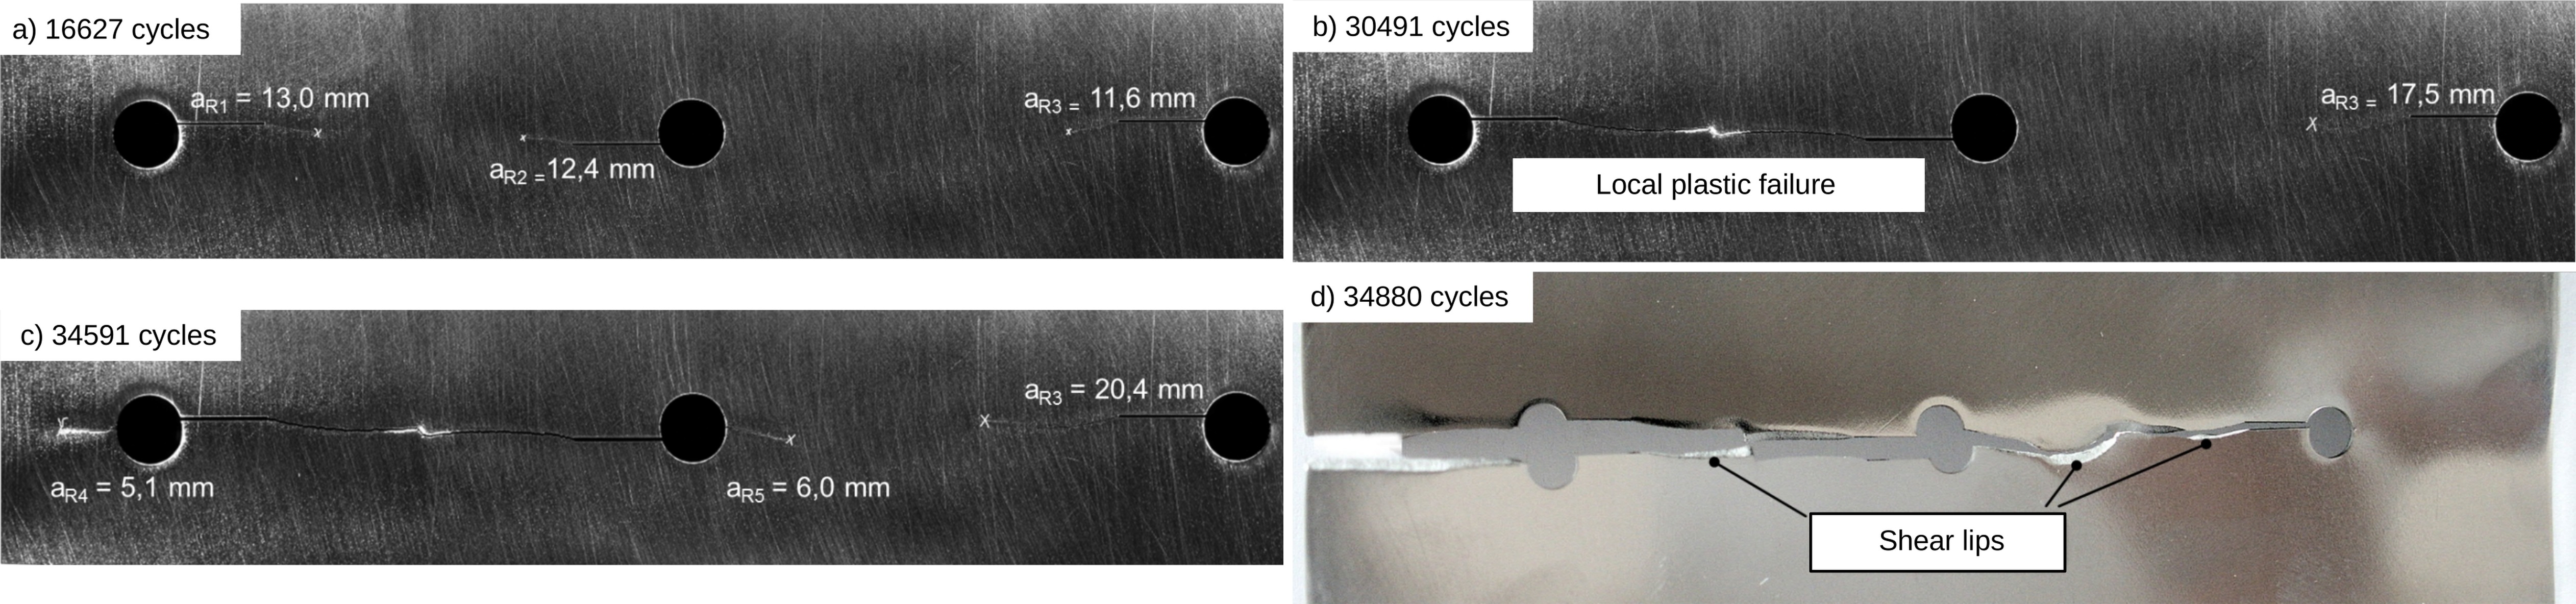
The crack paths established in the experiment and the failure of the specimen are shown in Fig. 9a) for the crack propagation of the three cracks after 16627 cycles, where crack 1 and crack 2 approaching each other. After approximately 30491 cycles, corresponding to b), the local plastic failure occurs between these two cracks, whereby the associated loss of load-bearing capacity does not lead to a global failure of the whole structure. As shown in c), two further cracks capable to grow initiate at the middle hole (crack 5, after app. 32000 cycles) and at the left hole (crack 4, after app. 33000 cycles). As can be seen in d), after 34880 cycles the global failure of the entire structure occurs as global plastic failure. Furthermore, d) shows the shear lips that formed during the experimental test.
A comparison between the simulated and experimentally determined crack paths up to a few cycles before the local plastic failure between crack 1 and crack 2 is shown in Fig. 10.
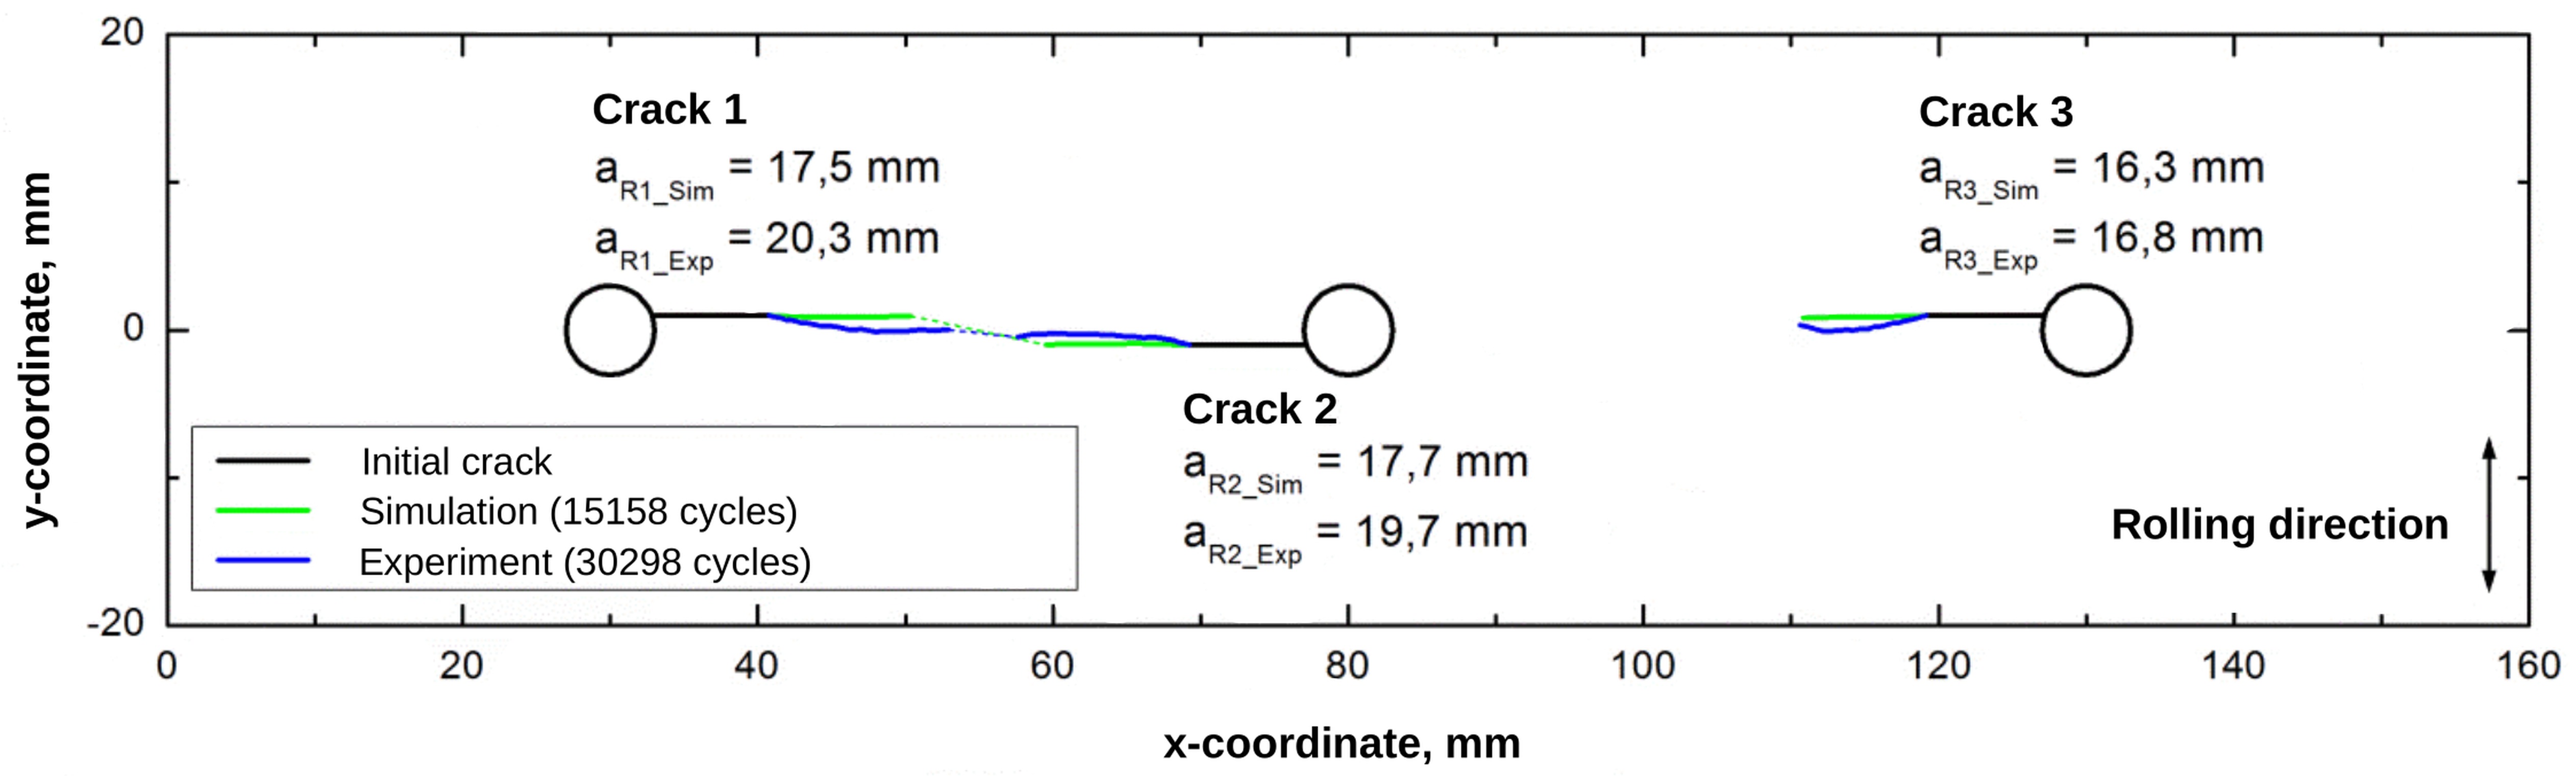
In the experiment, the buckling of the initial cracks is significantly more pronounced than in the simulation. As a result the trajectories determined experimentally show certain deviations from the calculated trajectories. Furthermore, the crack lengths show that the cracks grow more slowly in the experiment than in the numerical simulation. The local plastic failure is calculated in the numerical simulation at 15158 load cycles. This is by a factor of 2 smaller compared to the 30491 load cycles determined in the experiment.
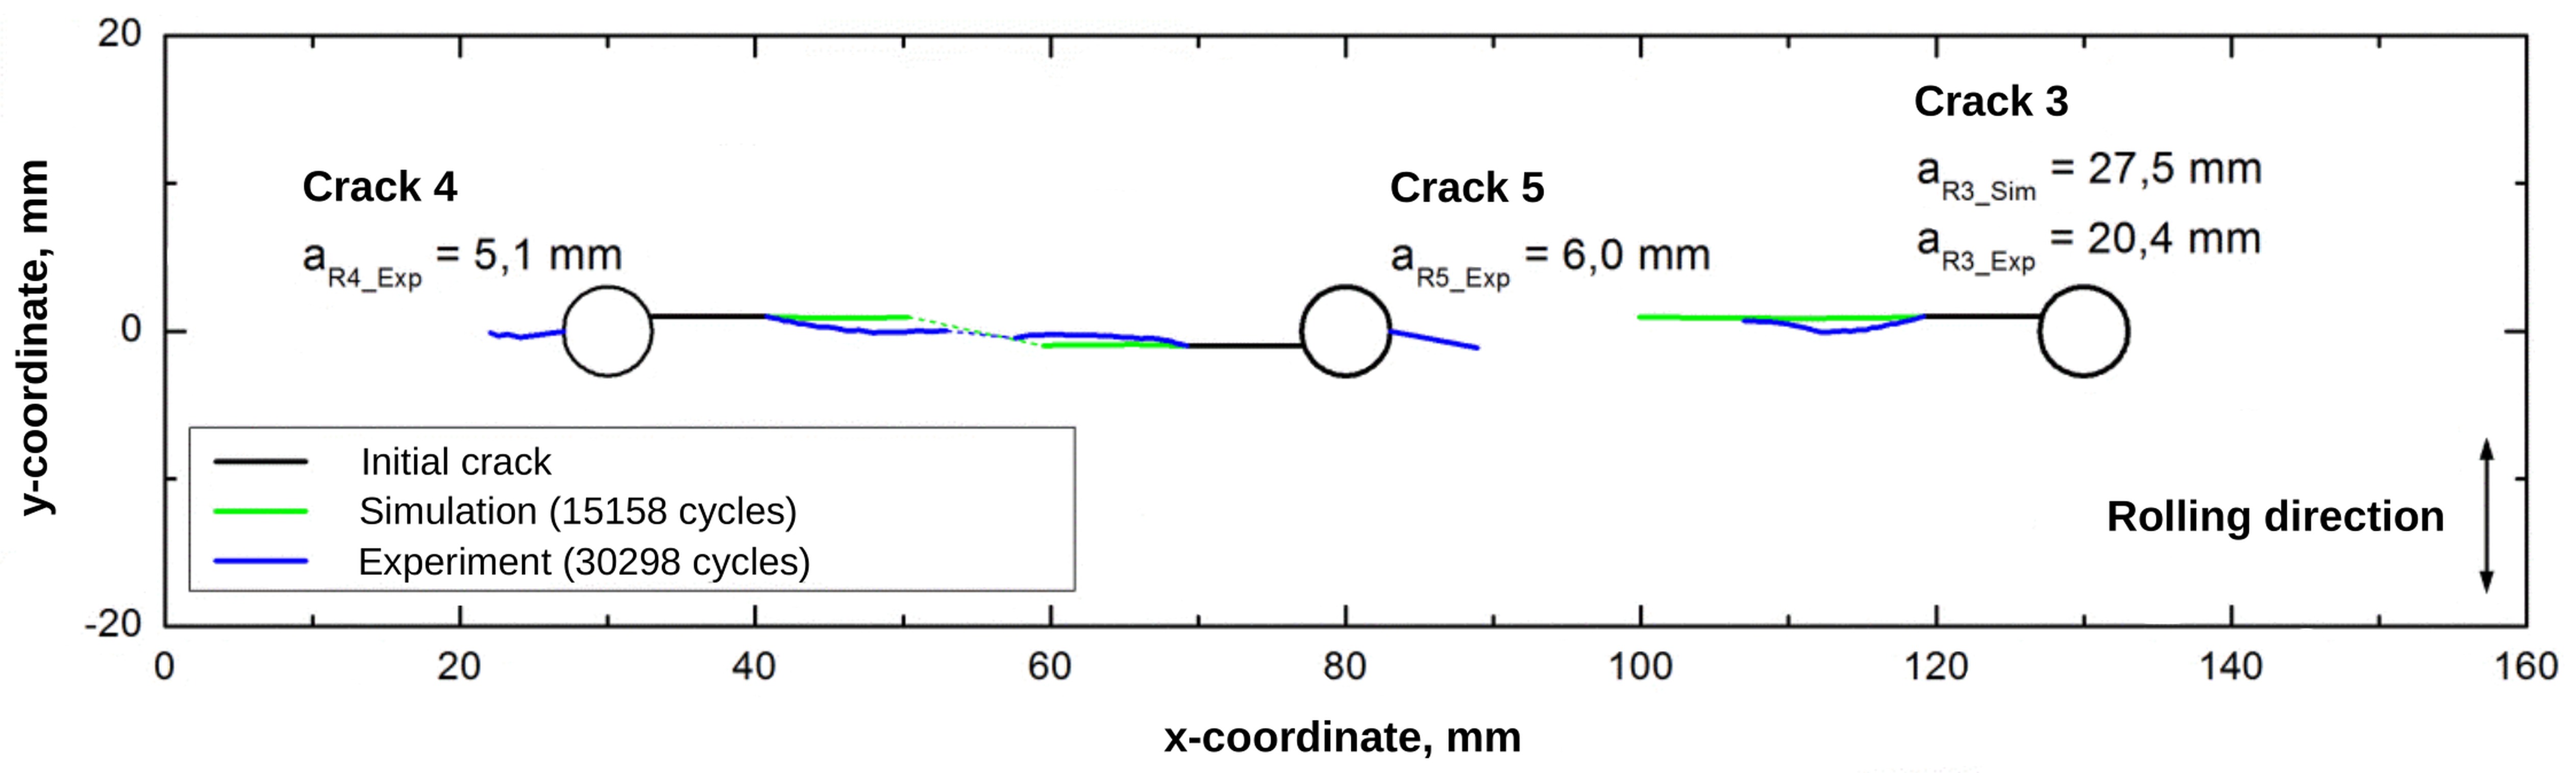
The Fig. 11 shows the simulated and experimental crack paths shortly before global failure. Global structural failure is calculated using a FAD evaluation for crack 3 (aR3_Sim = 27.5 mm) at 19006 cycles. The FAD evaluations in the Fig. 12 do not take into account the additional cracks 4 and 5. The number of cycles for the global structural failure calculated in this way is a factor of 2 smaller than the 34880 cycles determined in the experiment.
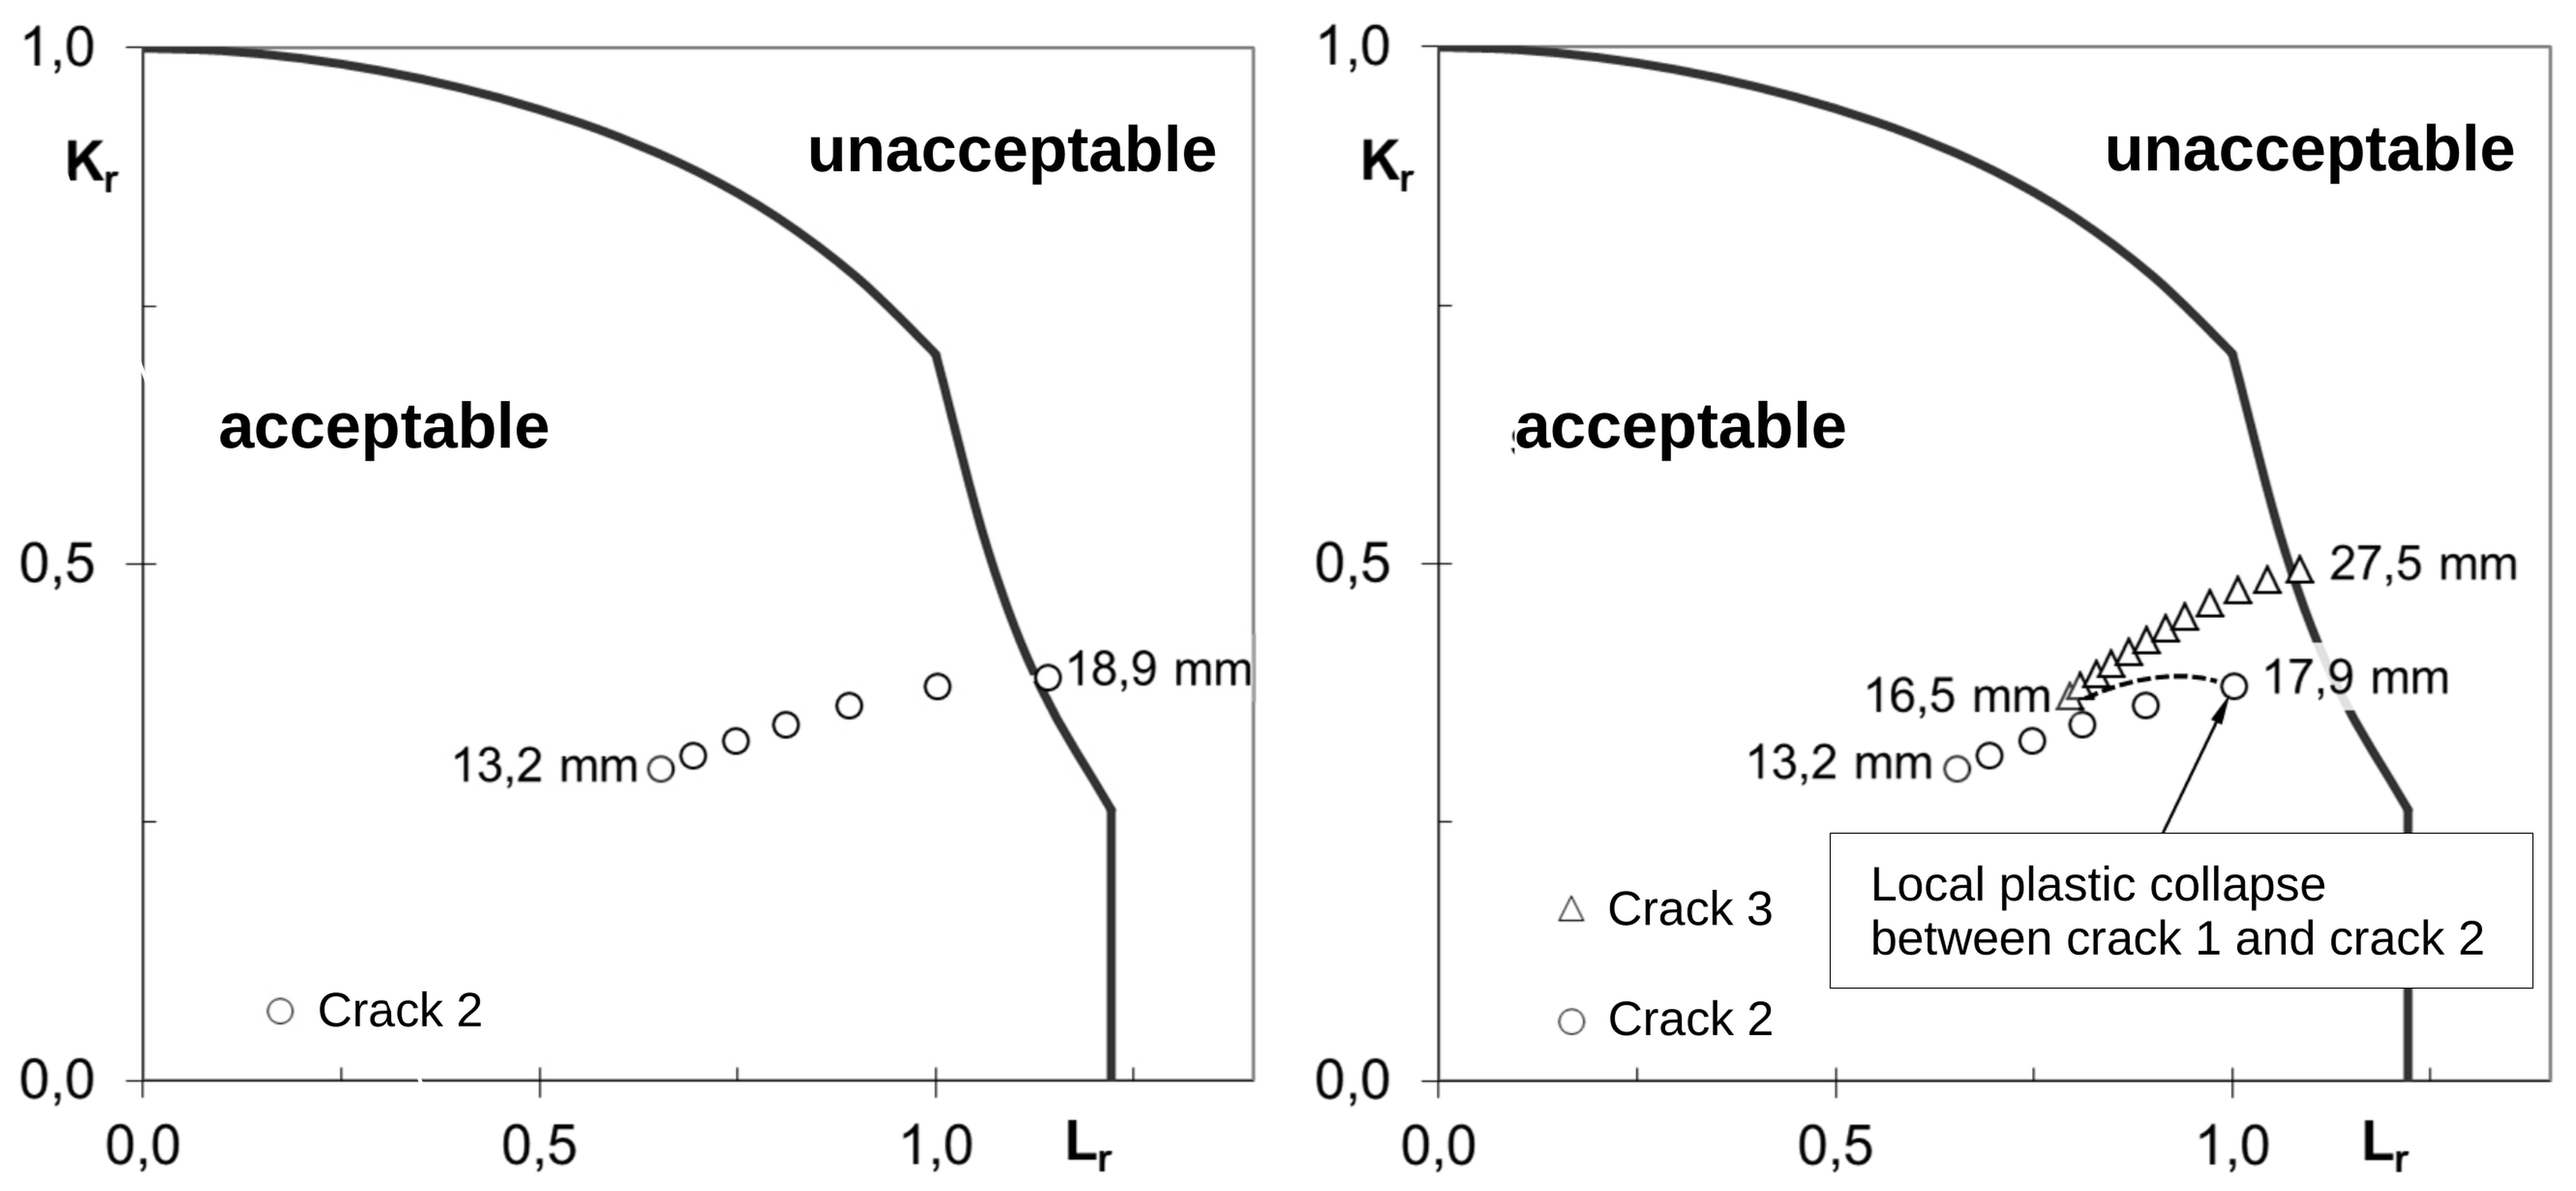
Fig. 12. Failure assessment diagram (FAD) without (left) and with (right) consideration of local plastic failure
As can be seen in the left FAD, the assumption that local plastic failure is equivalent to global plastic failure and therefore leads to a direct loss of load-bearing capacity of the damaged structure provides a very conservative statement about the remaining service life. In this specific case, the loss of load-bearing capacity is already calculated at a crack length of a2=18.9 mm or around 15600 load cycles. In comparison in the right FAD the crack lengths of a2=17.9 mm and a3=16.5 mm results in the local plastic failure between cracks 1 and 2, which does not lead immediately to the global failure of the component. After the crack tips 1 and 2 merge together the crack 3 continues to propagate until the actual loss of load-bearing capacity occurs at a crack length of a3=27.5 mm or 19000 load cycles.
Summary
The paper presents a fully automatic simulation of crack propagation in combination with a limit load analysis of plane structures with multiple cracks. Additionally initiated cracks during the crack growth process are included in the simulation procedure. For this purpose the Smith-Watson-Topper (SWT) parameter in combination with a linear damage accumulation has been applied. Local instabilities are taken into account in the numerical simulation. The experimental results indicate that local plastic failure occurs in the ligament between two approaching crack tips, which does not lead immediately to a complete loss of load-bearing capacity of the damaged structure. In the numerical simulation, the local plastic failure between the two crack tips was recorded using the implemented method and taken into account in the progressive crack growth simulation. The global structural failure was evaluated conservatively. The faster crack progression calculated in the simulation compared to the experiment can be explained, among other things, by the conservative description provided by the PARIS-ERDOGAN equation. In addition, there are significantly deviating crack propagation parameters in different material batches [15]. Furthermore, shear lips formed on the specimen during the experiment. These lead to deviating trajectory curves corresponding to the respective side of the specimen under consideration.
It can be summarized from the numerical results that the proposed numerical algorithm is robust and less sensitive to the selected crack increment. The developed program allows a fully automatic computation of the crack propagation and a plastic limit load analysis for plane structures without any user interaction. Additional cracks are detected with acceptable accuracy for the simulation of real structures. Further improvements require a multiscale solution procedure which are actually not included in the FKM guideline and applicable as black box for engineers. The obtained results show that the developed computational program provides a powerful tool for the simulation of multiple crack propagation in combination with flaw assessment using the failure assessment diagram. The results indicate that local plastic failure in the ligament between two approaching crack tips does not lead immediately to a complete loss of load-bearing capacity of the damaged structure.
A possible extension of the work is the investigation of non-proportional cyclic loadings. This is a complex issue since the principal stress axes rotate during the loading and the ratio of the stress intensity factors changes during the load period. The present work may be also extended for the computation of crack problems in three-dimensional structures.