INTRODUCTION
Laminated composites are advanced materials composed of layers with different properties, enabling design flexibility through varied orientations. Fiber-metal laminates (FMLs), which combine metal and fiber-reinforced polymer (FRP) layers, offer higher strength, stiffness, and fatigue resistance than traditional metals or composites. Despite these advantages, the effect of nanoparticles on the vibration behavior of FMLs remains poorly understood, making dynamic and free vibration analysis an ongoing research challenge. Merzuki et al. [1] studied aluminum-based FMLs and found that adding aluminum layers increased the natural frequency, with results matching finite element analysis [2]. Saini et al. [3] reported that cracks, fiber angle, and metal volume fraction all reduce the natural frequency, potentially causing resonance failures in cantilever beams. Danu et al. [4] employed finite element analysis to investigate hybrid laminates, demonstrating that the fiber type, ply angle, and support conditions significantly impact the vibration response. Hanten et al. [5] applied higher-order theories to model FML beam vibrations accurately, confirming their relevance in aerospace design. Ghasemi et al. [6] analyzed micro- and nano-FML cylindrical shells and found that aramid/aluminum laminates had the highest frequencies. Liu et al. [7] validated theoretical and experimental results for FML plates, showing good agreement. Mohandes et al. [8] compared CNT-reinforced FMLs and composites, revealing that CNTs significantly influence vibration frequencies. Merzuki et al. [9] demonstrated that higher stiffness results in higher natural frequencies. Zhang et al. [10] investigated low-temperature damping in composites and found that factors such as temperature and moisture significantly affect damping properties. El-Mahdy et al. [11] demonstrated that fiber composites increase rotor natural frequencies due to their high stiffness-to-mass ratio. Kim et al. [12] demonstrated that seawater absorption enhances damping but weakens bonding in CNT-modified composites, thereby affecting marine performance. Treviso et al. [13] reviewed damping in composites, emphasizing hybrid and nano-composites for tailored vibration control. Prasad et al. [14] combined numerical and experimental studies on FML plates, demonstrating that geometry and boundary conditions significantly impact natural frequencies. Aghamohammadi et al. [15] found that adding MWCNTs improves flexural strength (best at 0.5 wt%) but reduces impact resistance. Farsani [16] reviewed the use of nanoparticles in FMLs and joints, noting the limited studies on their effects under various surface treatments and fabrication conditions. Khurram et al. [17] demonstrated that functionalized MWCNTs and surface treatment enhance the bonding strength between metal and composite layers.Kolar et al. [18] analyzed layered composites using the Rayleigh-Ritz method, highlighting how thickness and fiber orientation affect free vibration and delamination. Merzuki et al. [19] found that glass/epoxy-aluminum laminates had higher natural frequencies than carbon/epoxy ones. Muddappa et al. [20] studied hybrid FMLs and showed that fiber type and loading conditions significantly influence buckling and vibration responses.Crack detection in structures, particularly beams, is crucial due to the potential catastrophic failure they may cause, with free vibration-based methods being commonly used for this purpose. However, the influence of varying crack geometries, such as V-shaped or U-shaped cracks, on the accuracy of these methods has often been overlooked. Khalkar et al. demonstrated that factors such as crack geometry, depth, and location affect the mode shapes of cantilever beams, with free vibration analysis being effective in detecting crack depth and location in materials like spring steel, regardless of the crack geometry [21]. Delamination is a critical flaw in fiber-metal laminated composite structures, reducing stiffness and altering dynamic responses, which is particularly concerning in industries like aerospace. Jarali et al. had employed machine learning and regression models, along with FEA simulations, to accurately predict delamination locations and severity by analyzing shifts in bending natural frequencies [22]. The hybridization of carbon and glass fibers in classical composites can lead to a positive hybrid effect, resulting in an improved failure strain compared to pure carbon-based composites. Research has shown that the volume ratio of carbon and glass fibers in Fiber Metal Laminates significantly influences the static tensile strain at failure, with the increased failure strain attributed to thermal stresses generated during the manufacturing process at elevated temperatures [23]. Liao et al. had focused on the dynamic progressive failure properties of glass fiber composite/aluminium hybrid laminates under low-velocity impact, utilizing finite element analysis (FEA) to simulate intra-laminar damage and interface delamination. The effects of layer thickness and impact energy on impact force-time/displacement curves have been explored, with good agreement found between experimental and numerical results, highlighting energy dissipation mechanisms due to failure and deformation in both composite and aluminium layers [24]. Kali et al. investigated the vibration characteristics of FMLs, with a particular focus on comparing acceleration behavior in the time domain and the shift in peak frequencies in the frequency domain. In one such study, three FML specimens were developed, and it was observed that replacing the central aluminum laminate with a bamboo strip resulted in a significant decrease in peak acceleration [26-29].Siva Kumar et al [32] examines the ballistic performance of fibre metal laminates (FMLs) made of glass and carbon fibre composites under different projectile impacts. Three bullet geometries—ogival, semi-spherical, and truncated flat—were assessed at pressures ranging from 10 to 30 bar using a compressed gas handgun. Hand lay-up and hot press shaping were used to manufacture laminates with thicknesses of 15, 20, and 30 layers. Experimental results showed that glass fibre FMLs had the highest impact load (724.1 N) and energy absorption (0.71 J). Carbon fibre FMLs with 20 layers achieved peak energy absorption of 0.68 J, while being stiffer. Glass fibre laminates provided superior impact resistance, whereas carbon fibre laminates displayed greater overall rigidity. To enhance the mechanical performance of CFRP/metal composite laminates under quasi-static loading, Hu et al [33] proposes a machine learning (ML)-driven framework for optimizing stacking sequence and orientation. The approach increases the number of datasets available for machine learning analysis by merging experimental data with finite element models. After evaluating nine machine learning algorithms, it was found that decision tree, KNN, and random forest models are the most effective at predicting bending strength, while the gradient boosting offer the most accurate forecasts for tensile strength. Tree-based models performed rather well overall, especially with CFRP/DP590 laminates. This paper presents a novel approach to designing and optimizing composite materials by integrating computational, machine learning, and experimental techniques. Ma et al. [34] studied the free vibration behavior of Kevlar/glass/epoxy hybrid composite laminates. Natural frequencies and mode shapes were analyzed using ABAQUS software for different fiber hybridization configurations in quasi-isotropic laminates. The numerical results from ABAQUS were compared with ANSYS simulations, showing close agreement with an error range of 1.03%–2.30%. The comparison between experimental and numerical data revealed errors ranging from 1.15% to 13.51%, primarily due to the mesh size. The findings confirm that ANSYS results closely match experimental outcomes, demonstrating the effectiveness of numerical methods for free vibration analysis of hybrid composite laminates. The purpose of this study [35] is to improve the damage resistance of carbon fiber-reinforced composites that are vulnerable to impact-related brittle failures. To enhance peak displacement, toughness, and load-bearing capacity, epoxy matrices were supplemented with amine-functionalized multi-walled carbon nanotubes (0.3–1.2 wt.%). Delamination decreased by up to 27.73%, and matrix cracking was avoided, despite a slight increase in external damage. The benefits were attributed to the impact-energy-absorbing microstructures and strong nanoparticle-matrix interactions. Previous studies have explored the dynamic behavior of fiber-reinforced polymers (FRPs) using theoretical, analytical, and numerical methods. However, most of these works focused mainly on the mechanical properties of fiber metal laminates (FMLs), such as tensile and impact performance. Only a limited number of studies have investigated the dynamic or vibration behavior of FML structures, and even fewer have conducted experimental work in this area. Therefore, a clear gap exists in the literature regarding the experimental vibration analysis of FML beams and the influence of nano-fillers, such as multi-walled carbon nanotubes (MWCNTs), on their vibration characteristics. This research is novel because it combines theoretical, numerical, and experimental methods to study the vibration behavior of MWCNT-reinforced FML composite beams. The study systematically investigates how different MWCNT filler contents (3%, 4%, and 5% by weight) and beam geometries (especially beam length) affect the natural bending frequencies and vibration amplitudes of FML beams. Such a detailed comparison across multiple methods and parameters has not been widely reported before, making this work a unique contribution.
Objectives of the Research Study
To study how different MWCNT nanoparticle weight fractions affect the natural frequencies and vibration behavior of FML composite cantilever beams.
To examine the effect of beam geometry, particularly beam length, on the dynamic stability and structural integrity of FML composite beams.
To validate the experimental results using numerical and theoretical models, ensuring that the data from FFT analysis, finite element analysis (FEA), and equivalent discrete models are consistent.
MATERIALS AND METHODS
Selection of materials
The materials used in the preparation of fiber metal laminate (FML) composite beams include aluminum sheets (AA5052-H32) with a thickness of 0.5 mm, woven E-glass fiber, an epoxy-type adhesive (consisting of resin and hardener), and Multi-Walled Carbon Nanotubes (MWCNT) as nano-fillers. The FML was created using a configuration of aluminum alloy, MWCNT, and epoxy glass fiber. The composite was made with pure epoxy monomer (Araldite AV138), to which varying amounts of fine MWCNT powder were added to enhance dispersion using 200 ml of ethanol. After five minutes of mixing at room temperature, a curing agent (HV998) was introduced to the mixture, and the epoxy resin and hardener were combined in a 10:4 ratio. The composite material was allowed to cure at room temperature for 19 hours. The 0.5 mm-thick aluminum alloy sheets (AA5052-H32) were first cleaned and degreased. Different weight ratios of MWCNT were mixed with the resin and hardener mixtures for layer fabrication. To reduce moisture content, the fibers were sun-dried before use. The layering process began with a wooden base to contain the skin material. The aluminum sheet was coated with an epoxy layer containing varying concentrations of MWCNTs. After activating the matrix agent, the upper aluminum sheet was bonded to a woven roving glass fiber and filled with a nanofiller epoxy resin. The mixture was evenly spread, and trapped air was released using a roller. Subsequently, the upper aluminum alloy sheet was placed on top of the uniform layer of epoxy resin mixed with nanofillers, and after rolling, a drying period of ten to fifteen minutes followed. The FML composites were finally laminated under a constant load for 19 hours to form the FML composite beam. Specimens were prepared in the rolling direction using a water jet machining technique. Tab. 1 presents the properties of the aluminum alloy sheet used in this work.
Tab. 1.
Material properties of Aluminium sheet (AA5052-H32) [31]
| S. No. | Property | Unit | Value |
| 1. | Young’s modulus, E | N/m2 | 70.6×10⁹ |
| 2. | Density, ρ | kg/m3 | 2680 |
| 3. | Poisson’s ratio, μ | _ | 0.33 |
Determination of material constants
The material constants of the glass fiber composite sheets were determined separately. A universal testing machine was used to conduct uniaxial tension tests on the composite beam [31] specimens. The test data provided the young's moduli, shear moduli, and poisson's ratios of the composite beam specimens. Tab. 2 presents the details of the material constants.
Tab. 2.
Material properties of prepared FML composite beams [31]
Details of the prepared test specimens
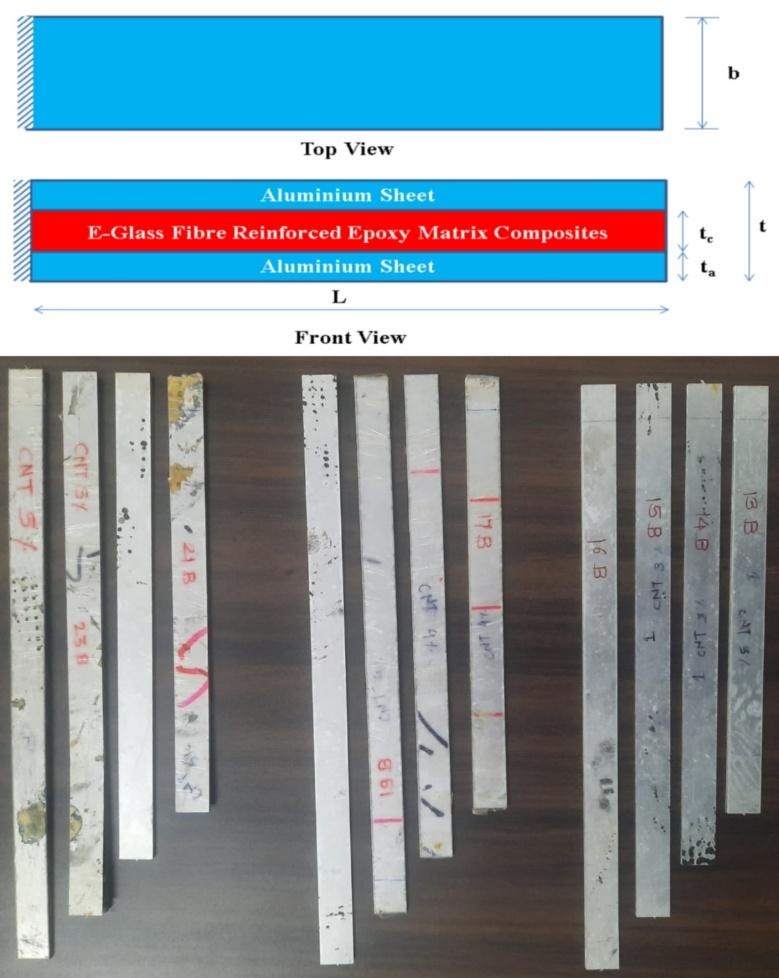
The present research considered twelve specimens of 2/1 FML composite beams. Twelve e-glass fiber epoxy sheets and twenty-four aluminum sheets were used in the 2/1 configuration of the composite FML beams. The twelve specimens of e-glass fiber/epoxy composite laminates incorporated different percentages of nanofillers. Tab. 3 presents the details of the proposed twelve specimens. Each composite specimen was prepared with a thickness of 0.5 mm and a width of 15 mm. Among the proposed twelve specimens, three were prepared with a length of 200 mm, three with a length of 225 mm, three with a length of 250 mm, and the remaining three with a length of 275 mm. Fig. 1 shows the schematic and fabricated view of a 2/1 configuration FML (Al/E-GF Epoxy/Al) composite cantilever beam.
Tab. 3.
Fabricated 2/1 configurations FML composite beam specimens
Experimental Investigation
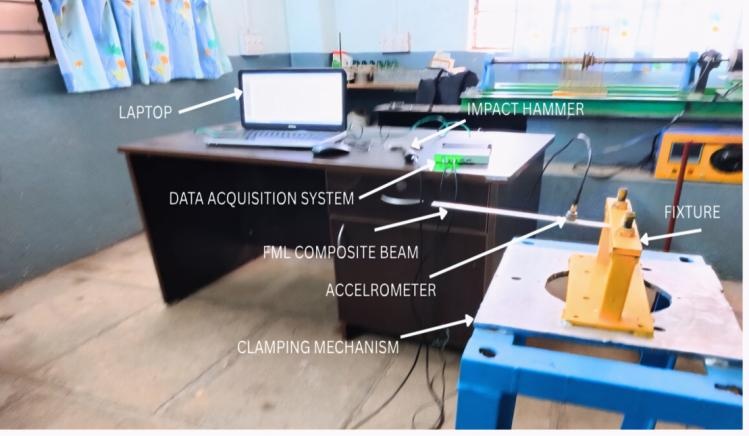
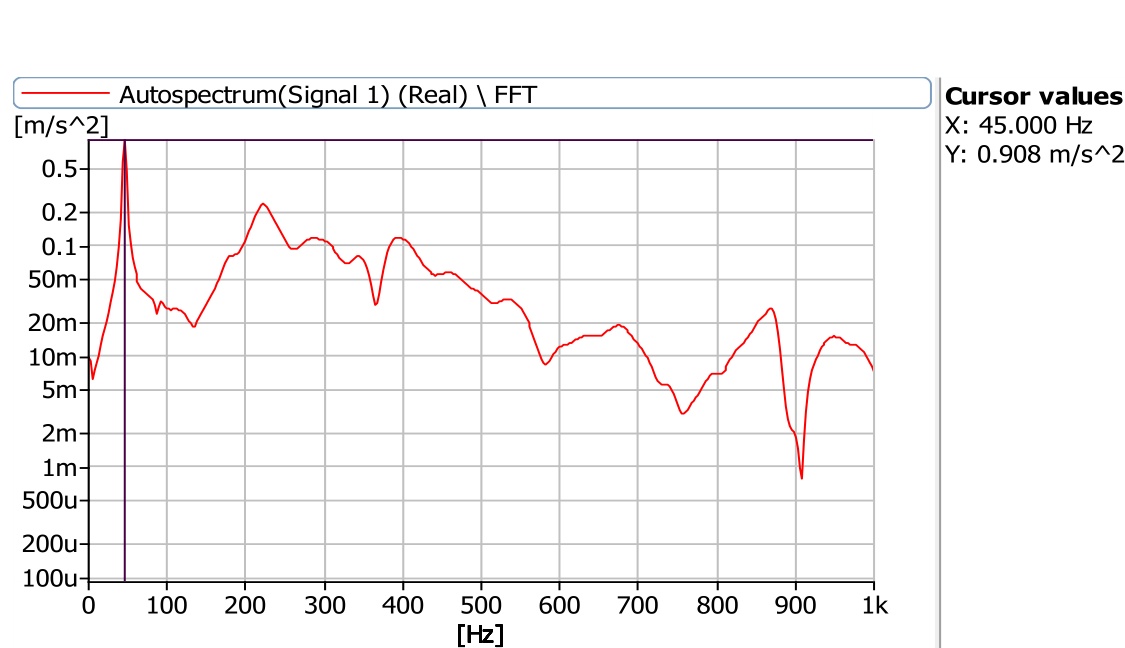
A free vibration test was conducted on the proposed FML composite cantilever beams. Fig. 2 shows the experimental setup. The tests used a four-channel FFT analyzer connected to the Dewesoft FRF system, an accelerometer, an impact hammer, and a laptop. The hammer was used to excite the beams in bending mode to determine their natural frequencies. Vibration data were measured using PULSE software. The impact hammer excited the beam at specific points, and the accelerometer, attached with beeswax, captured the resulting vibrations. Figure 3 represents the autospectrum from Fast Fourier Transform (FFT) for a 200 mm long, 15 mm wide FML beam reinforced with 3 wt.% MWCNTs, which display the first, second, and third natural frequency of the beam as 45 Hz, 222.5 Hz, and 675 Hz, respectively. The selected frequency range was 0-1000Hz, and experimental values were recorded by varying the accelerometer's position on the beam. The auto-spectrum data obtained from the accelerometer were initially recorded in the time domain and subsequently processed in the Pulse data acquisition software. The raw vibration signals were converted into the frequency domain using the Fast Fourier Transform (FFT) method. During this process, the raw time-domain data were saved, and parameters such as frequency range, frequency spacing, acceleration, and velocity response were defined according to the study's requirements. The plots of frequency versus vibration amplitude were then generated directly from this processed dataset within the Pulse software environment, rather than using screenshots, by exporting and re-plotting the saved raw data.
THEORETICAL ANALYSIS
Determination of the vibration parameters
The following step-by-step procedure explains the idea to compute effective mass, stiffness, damping factor, angular natural frequency, and damping constant of the tested FML specimens. These parameters are required to develop the mathematical model in order to obtain the time displacement plots.
The total mass of the FML composite cantilever beam was first determined by calculating the product of the beam’s density and its volume. Subsequently, the effective mass of the composite beam was calculated. It is important to note that the effective mass
A force of 20 N was applied at the free end of the FML beam. This force is essential for determining the displacement at the free end of the beam. Once the displacement is measured, the stiffness
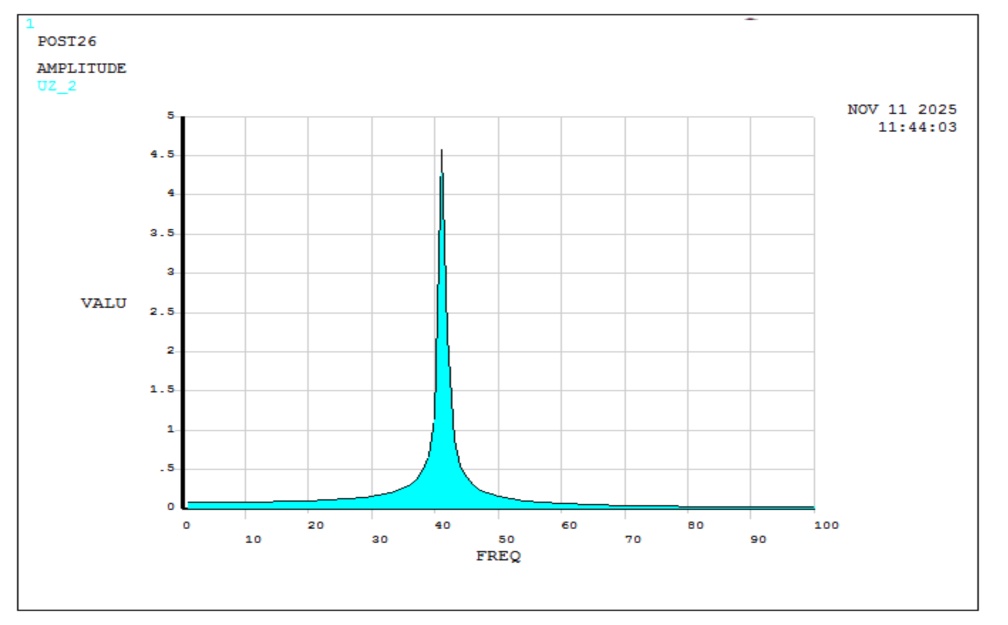
A harmonic analysis was performed on the FML composite beam model to obtain the relationship between amplitude and excitation frequency. The resulting graph was [30] subsequently used to determine the damping factor
The angular natural frequency
The damping constant
Tab. 4.
The vibration parameters for the twelve different configurations of FML composite beams
Implementation of the mathematical model in MATLAB
The transverse vibration of the FML composite cantilever beam was modeled as a single-degree-of-freedom system. An equivalent single-degree-of-freedom system model [30] and its corresponding free-body diagram are shown in Figs. 4 (a) and 4 (b), respectively. In this model, the FML composite cantilever beam is represented as a freely damped single-degree-of-freedom system.
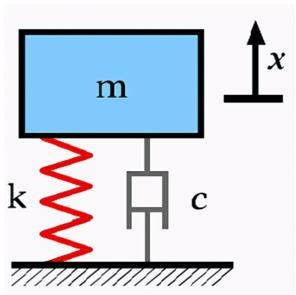
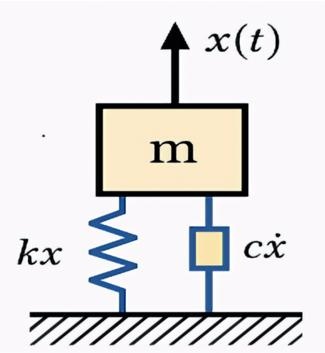
The differential equation for the discrete Spring-Mass-Damper system is given below:

This is the linear differential equation of the second order and its solution can be written as

where,




This is the characteristics equation [30] of the system; this is the second order equation and it is quadratic in nature.

The general solution of this is written as

The motion governed by the above equation is of the oscillatory type.
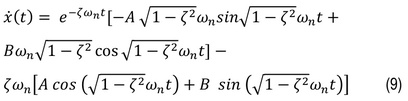
By applying the initial conditions, i.e. initial displacement = 1, and, initial velocity = 0, the constant values will be obtained and it is shown in Eqs (10) and (11).


After substituting Equations 10 and 11, Equation 8 will be modified as presented in the Eq (12).

The effectiveness of the analogous model shown in Fig 5(a) was confirmed by calculating the initial angular and linear natural frequencies using Eqs (13) and (14), respectively. The first natural frequency that was computed and the numerically acquired natural frequency were then compared. The two natural frequencies are shown in Tab. 5.


Implementation of the mathematical model in MATLAB
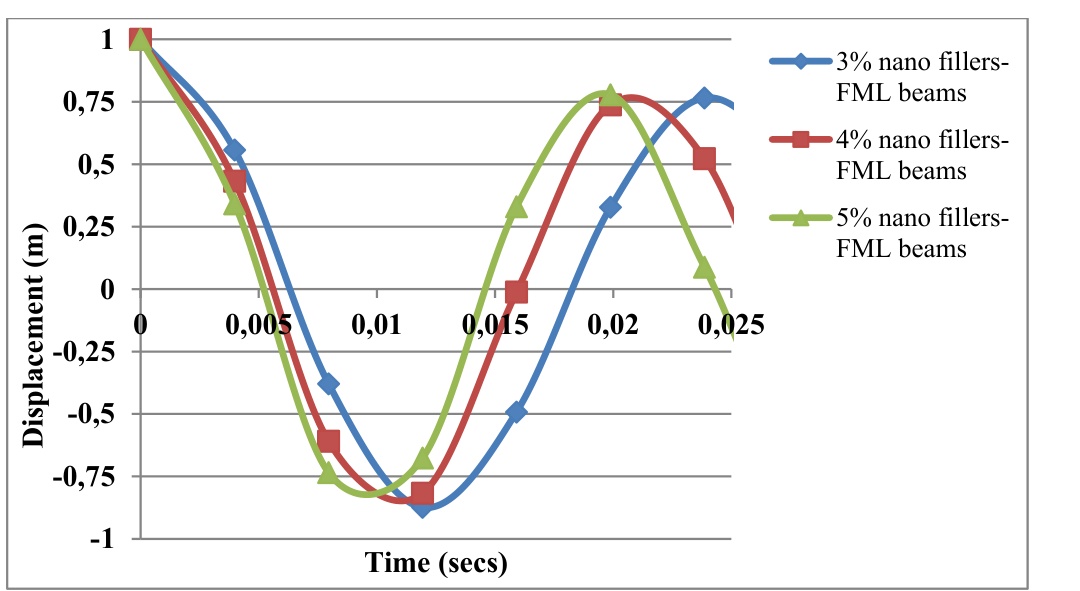
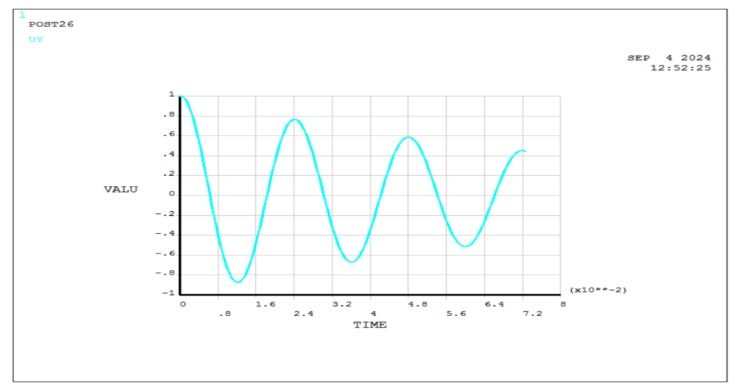
An algorithm developed in MATLAB was used to calculate the beam displacement at various time intervals. Eq. (12) was used to calculate the response of the vibrating system over time. In the MATLAB program, this equation was implemented, and the angular natural frequency and the damping factor for each scenario were input into the application. The incremental time step was chosen as one-sixtieth of the periodic time, while the total simulation time was set to two times the periodic time. To perform the theoretical analysis is in MATLAB, the raw simulation output data were saved and post-processed to extract time displacement response characteristics.
The graphs presented in the paper were plotted using this processed data derived from the raw MATLAB output, ensuring that all figures reflect directly computed results. Fig 5 shows the time-displacement graphs produced by the MATLAB application.
Tab. 5.
Experimental and theoretical natural frequency for the twelve different configurations of FML composite beams
FINITE ELEMENT MODELING AND ANALYSIS
Finite Element Modeling
Simulations were carried out using ANSYS Classic Version 12.1 in three main steps: Preprocessing, Solution, and Postprocessing.
Preprocessor
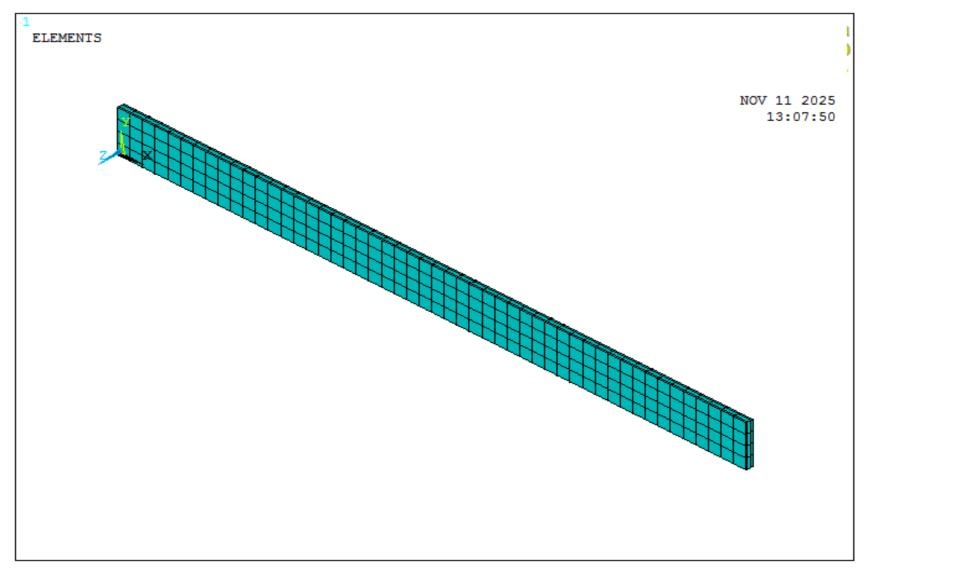
Material properties, element type, and geometry were defined. The SHELL181 element was chosen for static, modal, and harmonic analyses, as it represents displacement and rotation with six degrees of freedom per node and is suitable for layered composites [23, 24]. The FML beam had three layers—two aluminum sheets and one glass-fiber/epoxy core—defined using the SECTYPE command. Fiber orientation was aligned along the length of the beam. A quadrilateral mesh with 0.004 m element size was generated, i.e., Fig 6(a), and cantilever constraints were applied at one end. Element connectivity, quality, and material attributes were checked before solving.
Static Analysis
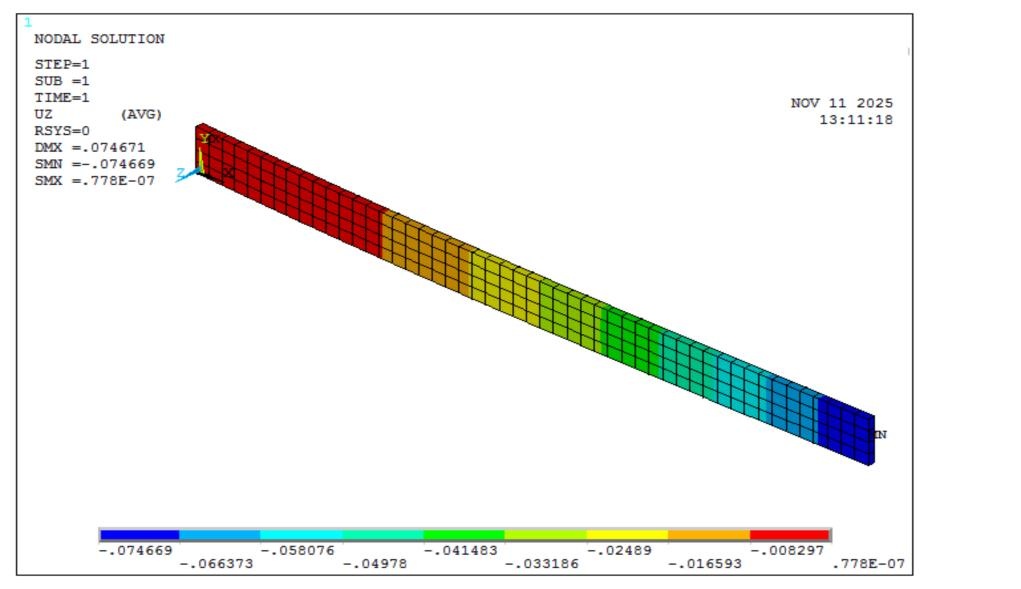
A point load of 20 N was applied at the free end of the clamped cantilever FML beam to determine the displacement. The static analysis was performed to calculate the stiffness of the beam, which is given by the relation stiffness = force/deflection [25]. The deflection plot of the FML composite beam obtained from the static analysis is shown in Fig 6(b).
Modal Analysis
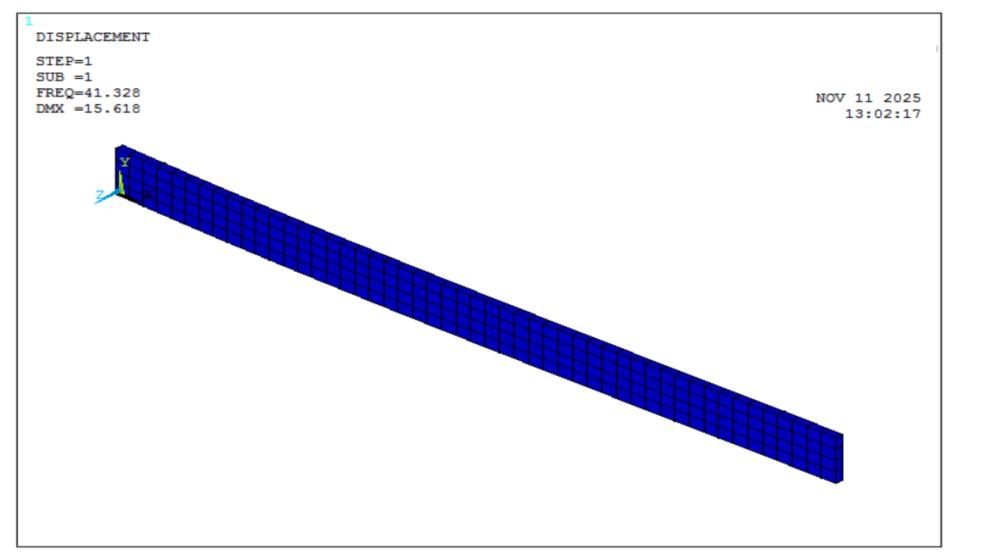
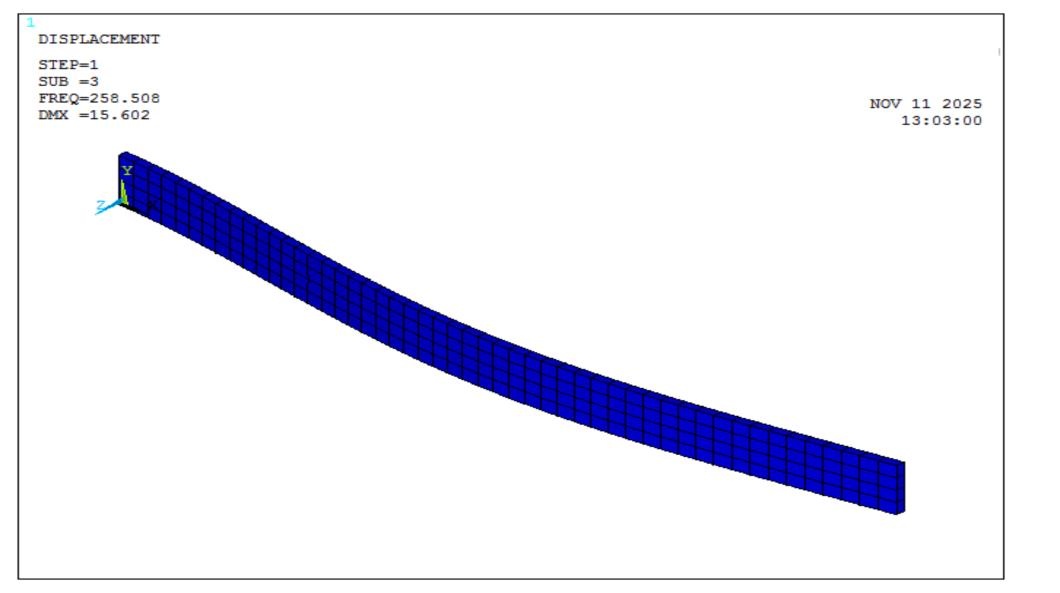
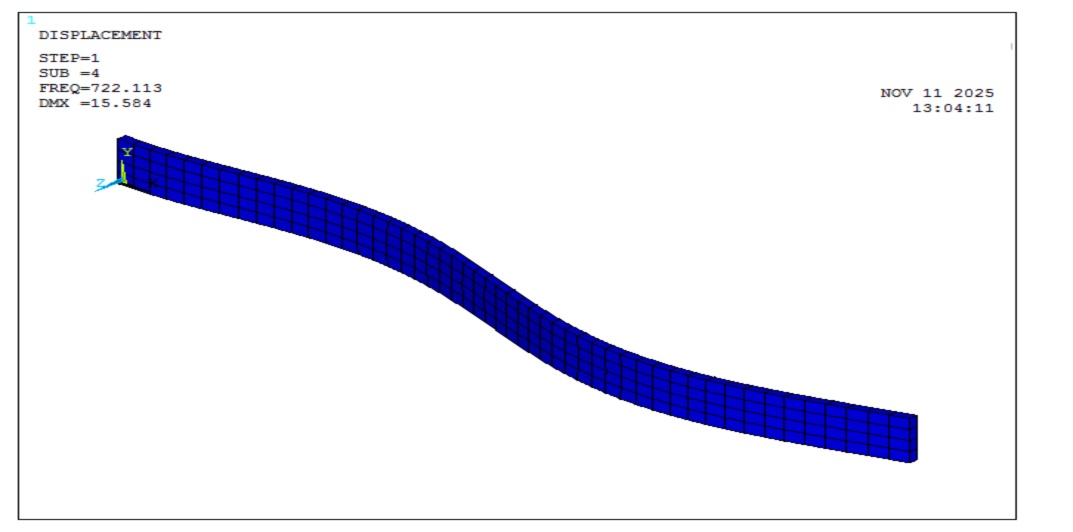
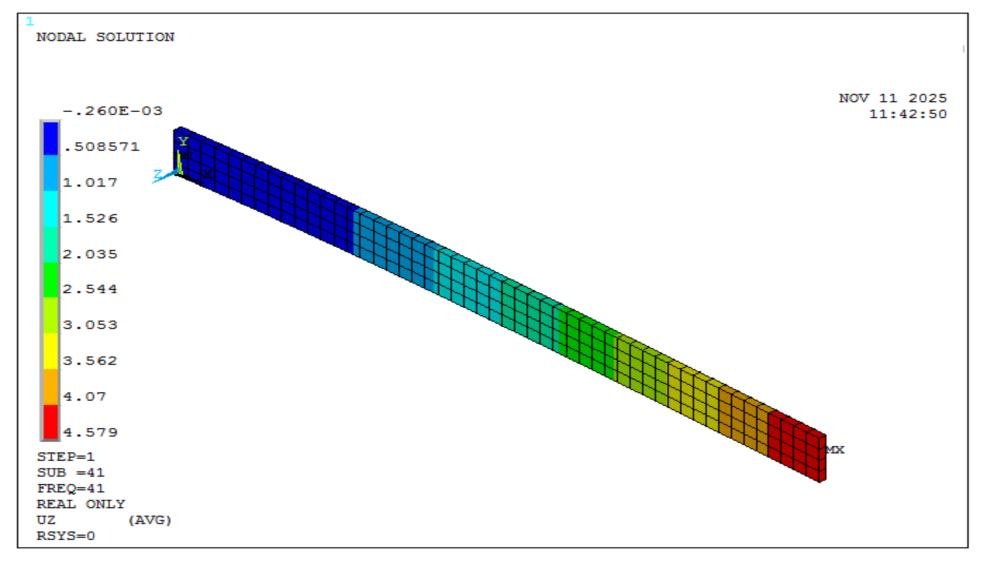
Natural frequencies and mode shapes were obtained through modal analysis [22]. Figs 7(a) – 7(c) show the mode shapes for the H1 configuration.
Harmonic Analysis
Harmonic analysis simulated the beam’s response to sinusoidal
loads [26]. A step load and frequency sweep produced an
amplitude–frequency curve to determine bandwidth frequencies (f₁ and
f₂) and natural frequency (fₙ). These frequencies were then utilized
to calculate the damping factor (ζ) of the composite beam, using the
formula,
Transient Dynamic Analysis
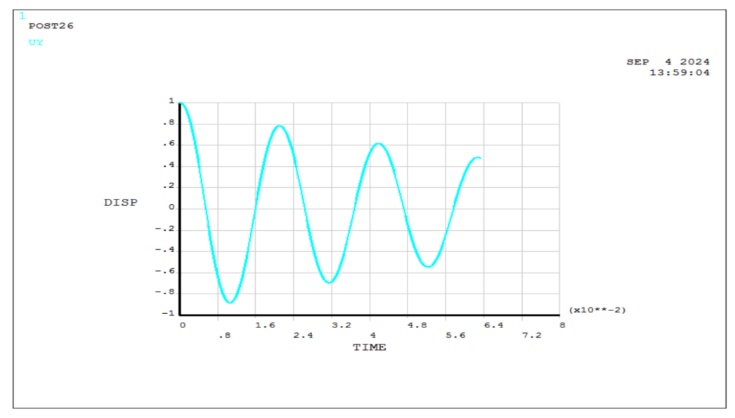
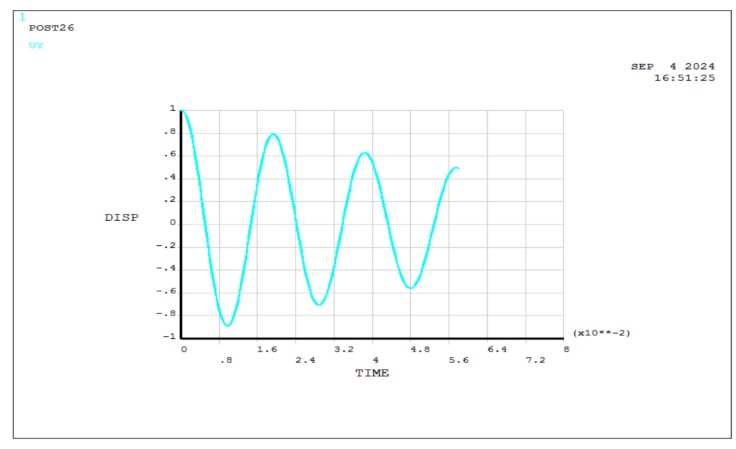
The COMBIN40 element was used in the transient dynamic analysis of the spring–mass–damper system. It has one degree of freedom per node and allows inclusion of mass, springs, dampers, sliders, and gaps. Node positions were selected based on design criteria, with static force and stiffness set to achieve unity displacement. The integration time step was chosen as 0.01666 times the periodic time to ensure simulation accuracy. A sine input was applied to generate displacement versus time plots over nearly three cycles. Results were visualized using POST26, with Figs 8(c) – 8 (e) showing the displacement-time response for the H1, H5, and H9 configurations, and the numerical vibration amplitude ratios summarized in Tab 6.
RESULTS AND DISCUSSION
From Fig 8(b), it is found that the vibration amplitude is largest at the free end of the beam. It gradually decreases from the free end to the fixed end of the beam when the beam vibrates at the first bending natural frequency.
Fig. 9 presents the experimental and numerical natural frequency of FML composite cantilever beams. In this study, the vibration parameters of a sandwich beam composed of fiber metal laminates (FML) incorporating nano-powders, specifically multi-walled carbon nanotubes (MWCNT), were determined through numerical, theoretical, and experimental methods [28]. MWCNTs were used as Nano fillers in epoxy resin at weight percentages of 3%, 4%, and 5%. The length of the composite cantilever beam was varied to assess the effect of different beam lengths on the natural frequencies. The frequency response data from the vibration tests were recorded using a Fast Fourier Transform (FFT) analyzer [29].
The calculated results and the experimental natural frequency data exhibited good agreement. The glass fiber thickness increased with the higher percentage of nanoparticles – 3%, 4%, and 5% in the glass fiber epoxy (as shown in Tab 3). As the thickness of the composite beam increased, its stiffness also increased. Consequently, Fig. 9 illustrates that the natural frequency of the FML composite beam increases with the nanoparticle fraction. Tab 6 presents the amplitude ratios for twelve distinct FML beam configurations determined using both theoretical and numerical methods. The vibration amplitude ratios obtained from both methods showed good correlation. The vibration amplitude ratio, defined as the displacement between the starting and ending points of one cycle, remained higher for the 3% FML specimens. For the 4% and 5% FML specimens, the amplitude ratio decreased. A lower vibration amplitude ratio indicates greater dynamic stability in the FML composite beam.
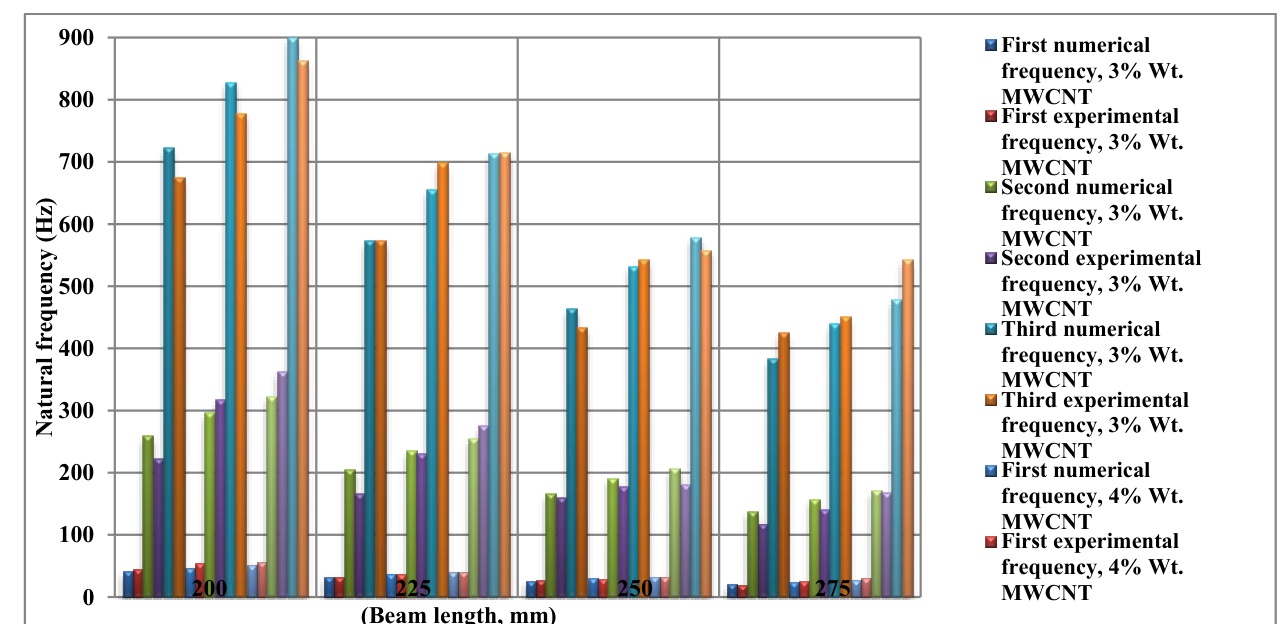
Fig. 9. Experimental and numerical natural frequencies for different configurations of the tested FML composite cantilever beams
Tab. 6.
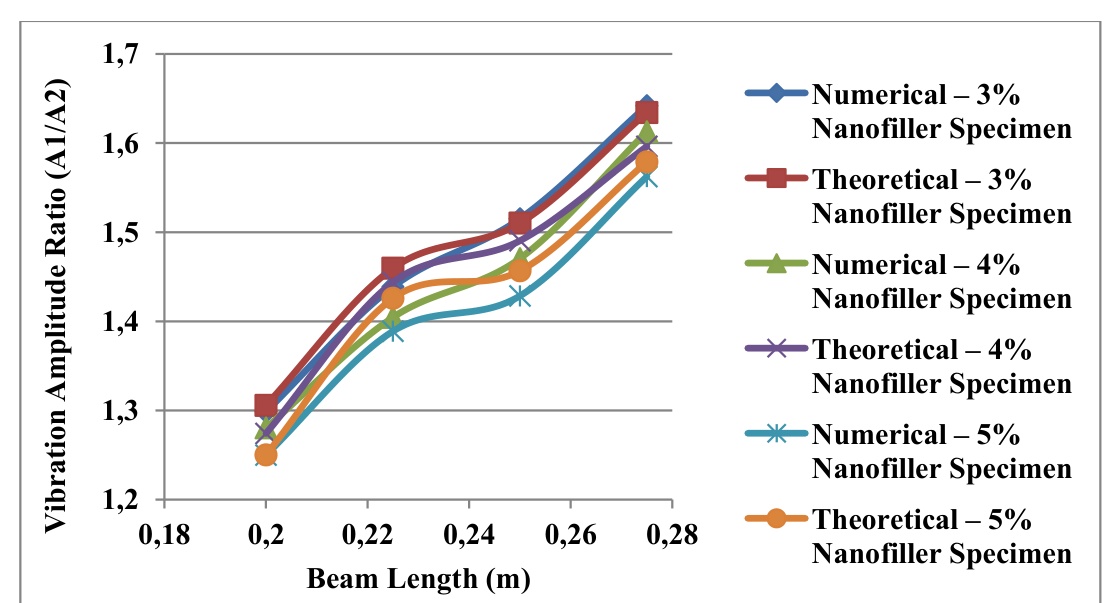
Numerical and theoretical vibration amplitude ratios for different configurations of the tested FML composite cantilever beams
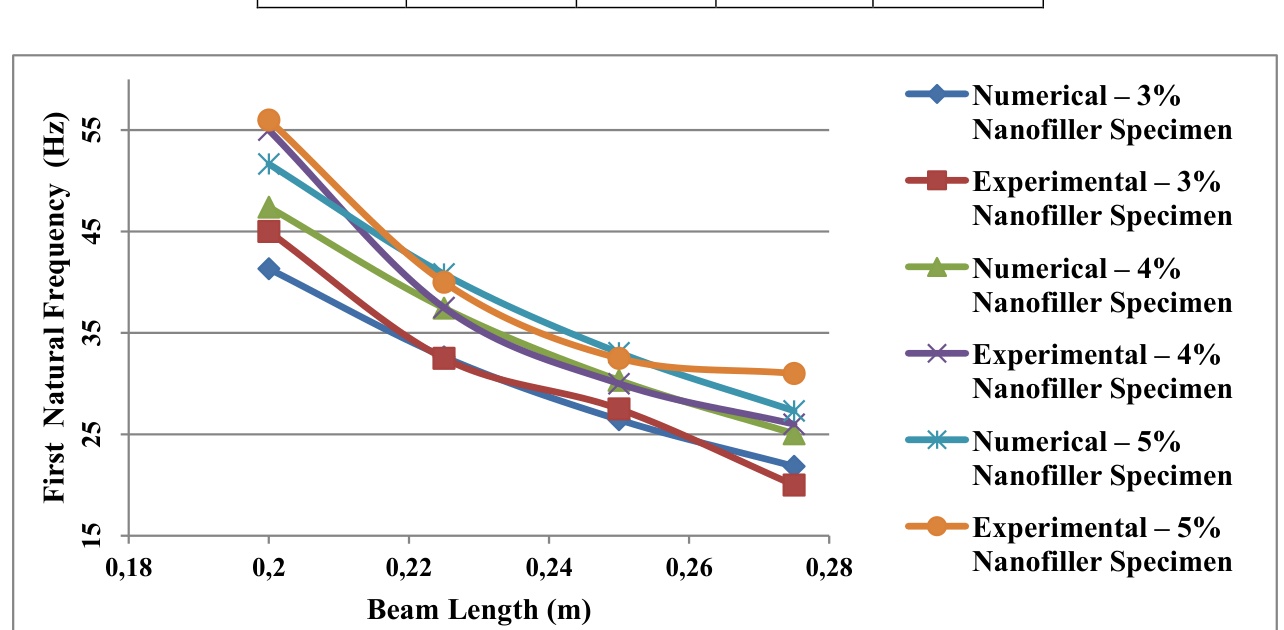
Fig.10 (a)First bending natural frequencies, both experimental and numerical, for several FML composite beam configurations
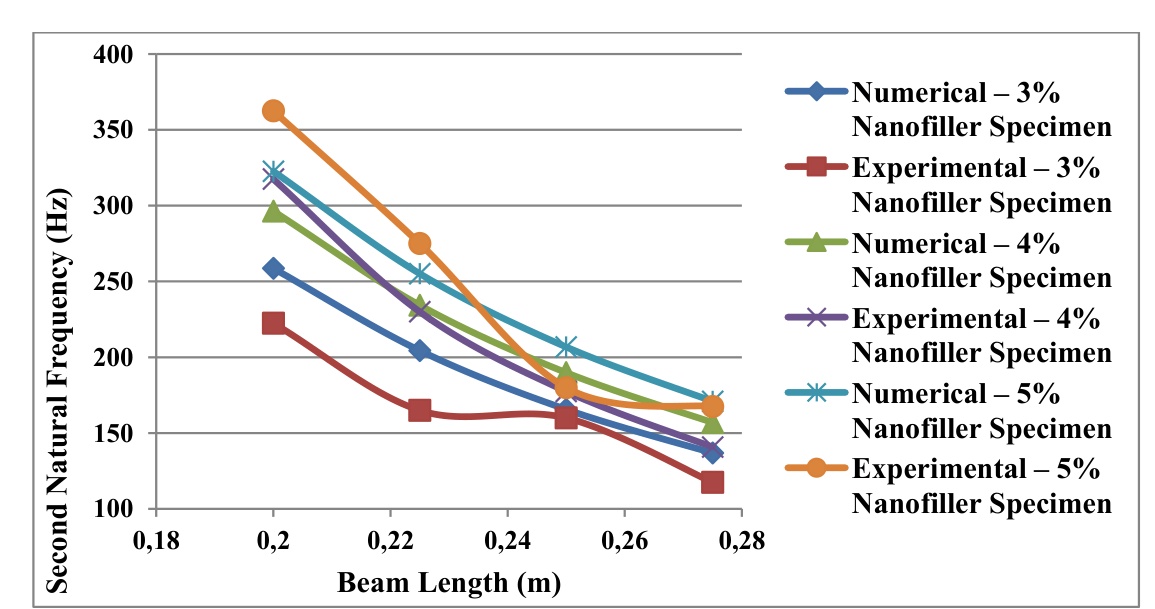
Fig.10 (b)Second bending natural frequencies, both experimental and numerical, for several FML composite beam configurations
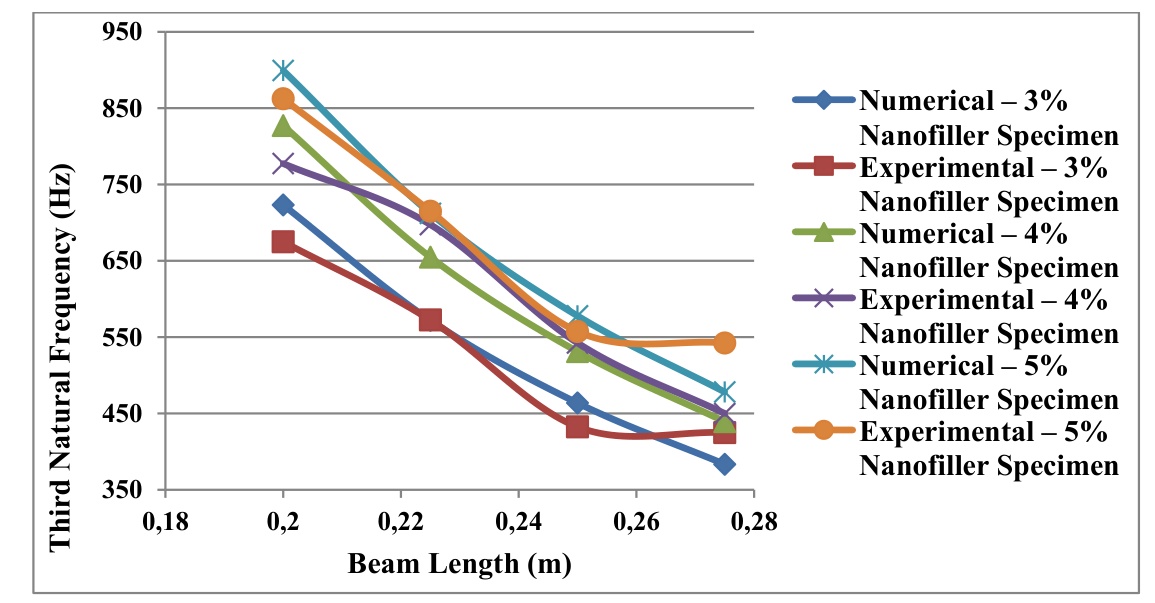
Fig.10 (c)Third bending natural frequencies, both experimental and numerical, for several FML composite beam configurations
Figs 10(a)-10(c) illustrate that as the length of the composite beam increases, the natural frequencies (i.e., first, second, and third natural frequencies) decrease. This trend holds for all specimens with different configurations, namely the 3%, 4%, and 5% MWCNT specimens. Additionally, it is observed that the natural frequencies are relatively higher for the 5% MWCNT specimens compared to those of the 3% and 4% specimens with the same configurations. The analysis plots depicting the variation of natural frequencies with respect to the weight percentage of MWCNT incorporation are shown in Figures 12(a)-12(c).
The difference between the numerical and experimental results was found to be minimal for each weight percentage of MWCNT (3%, 4%, and 5%), which is a favorable outcome. Furthermore, it was observed that as the MWCNT percentage increases from 3% to 5%, both the numerical and experimental natural frequencies exhibit an increasing trend. The results clearly indicate a noticeable improvement in the natural frequencies as the MWCNT percentage increases. Specifically, the first natural frequencies of the composite beams were found to be 41.328 Hz, 47.411 Hz, and 51.659 Hz for the 3%, 4%, and 5% MWCNT specimens, respectively. The study focused on the first three bending modes of the laminated FML composite beam. As the amount of nanoparticles in the FML composite cantilever beam increases, the beam becomes stiffer due to the enhancement of interactions between the metals, fibre-reinforced epoxy, and the nanoparticles, resulting in higher natural frequencies. Therefore, Figs 10(a)-10(c) demonstrates that the natural frequencies for the bending modes increase from 3% to 5% as the average weight percentage of nanoparticles increases.
Figs 11 shows that, for the same configuration (i.e., beam length and width), the vibration amplitude ratios (A1/A2) for the 3% MWCNT specimens are higher than those for the 4% and 5% MWCNT specimens. This indicates that as the percentage of nanoparticles increases, the vibration amplitude ratio decreases. A decrease in the vibration amplitude ratio corresponds to a reduction in the logarithmic decrement, which in turn indicates a decrease in the damping effect. Therefore, it can be concluded that for the same configurations, the FML beams with 5% nanoparticles exhibit a comparatively better dynamic stability property due to the increased oscillation rate of the vibrating composite beam.
From Figs 5, it is observed that the collapse in vibration amplitude is most significant for the 3% MWCNT composite beam, and it begins to decrease for the 4% and 5% composite specimens of the same configuration. For the H1, H5, and H9 configurations, the vibration amplitude ratios are 1.2987, 1.2804, and 1.25, respectively. This suggests that the reduction in vibration amplitude at the end of the first cycle is higher for the 3% specimen (H1) than for the 4% (H2) and 5% (H3) specimens in the same configurations. Specifically, the reduction in the vibration amplitude of the 3% MWCNT specimen is 2.38% greater than that of the 4% MWCNT specimen. Furthermore, the reduction in the amplitude of the 3% MWCNT specimen is 3.75% greater than that of the 5% MWCNT specimen.
CONCLUSIONS
The vibration behavior of fiber-metal laminate (FML) composite cantilever beams was examined using FFT-based experiments and ANSYS simulations for various 2/1 beam configurations. Key findings include:
Bending natural frequencies increase with the addition of MWCNT nanoparticles, especially at 3–5 wt%.
Higher nanofiller content (3–5 wt%) reduces vibration amplitude ratios, indicating improved stiffness.
Beams reinforced with 5% MWCNT show the greatest dynamic stability.
Damping is most significant in the 3% MWCNT specimens compared to those with 4% and 5%.
Theoretical vibration amplitude ratios align well with numerical predictions.
Natural frequencies from the equivalent discrete model closely match both experimental and numerical results.
An increase in beam length reduces the natural frequencies.
At the first bending mode, the vibration amplitude decreases from the free end toward the fixed end.
These results support the application of FML composites in structural health monitoring and integrity assessment. Future work should explore nanoparticle concentrations above 5% (e.g., 6–7%) to determine whether the observed frequency-enhancement trend persists or reverses due to potential nanoparticle agglomeration.