
INTRODUCTION
Numerical simulations are a useful tool for reproducing the behavior of real-world systems using mathematical models and computer algorithms. The main aim of developing this field is to analyze phenomena that are costly, time-consuming, and difficult to study under real-world conditions [1]. They also allow, at the design stage, for predicting process paths, analyzing various solutions, and optimizing them without the need to conduct experiments [2]. Advancing computer technology enables the performance of highly complex calculations in a reasonable amount of time [3]. The reliability of numerical calculations performed by computer programs depends directly on the quality of the input data, such as experimentally determined material parameters. For commercially available prepregs, manufacturers usually provide only general material information, whereas the complete mechanical and strength properties of the final autoclave-cured laminate required for finite element modeling are not available. Therefore, comprehensive experimental characterization of the manufactured composite is necessary before reliable numerical analyses can be performed. The mathematical model and program algorithms, based on material data, define and predict how the simulation process will be carried out. Before performing numerical simulations, it is necessary to conduct laboratory tests to determine mechanical properties such as Young’s modulus, shear modulus, and Poisson’s ratio, as well as tensile, compressive, and shear strength. Experimental studies are particularly important for determining the material properties of polymer composites [4]. These are heterogeneous, anisotropic materials manufactured using several known production techniques [5]. Their mechanical and strength properties depend primarily on the fiber and matrix types and the manufacturing parameters [6]. Determining the parameters in polymer composites requires more complex testing than for homogeneous materials. The main methods used to study deformations and determine strength parameters, particularly in polymer composites, include strain gauging and optical techniques, each with its own advantages and disadvantages [7]. The basis of the first of these methods is strain gauge strain measurement, which guarantees very high measurement accuracy, but the measurement itself is only point-based [8]. Another disadvantage is the need for contact with the specimen, and in the case of heterogeneous materials such as polymer composites, their application is more debatable. The arrangement of fibers and matrix in a polymer composite is responsible for local changes in the material’s properties and strength. In scientific research, strain-gauge-based techniques are widely used in unidirectional polymer composites [9]. This technology was employed to determine the mechanical properties of the entire composite and its individual components. Using tensile and shear tests on the composite, it was possible to determine isotropic material parameters [9]. By utilizing the phenomenon of electrical resistance and its measurement in carbon fiber reinforced plastics, it is possible to measure deformations under tensile stress [10]. It has also been demonstrated that changes in the electrical properties of polymer composites correlate with deformation and material damage [11]. The testing methodology using strain gauges shows that, for this purpose, it is also necessary to properly prepare the specimens in accordance with the standards [8]. The use of strain gauging allows for the very precise, point-by-point determination of the properties of carbon fiber reinforced plastics and the determination of Young’s modulus, transverse elastic modulus, Poisson’s ratio, ultimate stress, and strain [12]. The tests also allow determination of the properties of transversely isotropic carbon fiber composite materials, which were compared with results from ultrasonic tests [13]. Strain gauging can also be used to determine data for longitudinal and transverse tensile testing and for longitudinal compression testing of cross-woven carbon fiber composites [14].
Investigations of the properties of polymer composites often require more complex techniques [15]. This group includes Digital Image Correlation (DIC), which involves analyzing images of the specimen surface to observe deformation under load [16,17]. The advantage of this method is non-contact measurement and the ability to obtain a full strain field [18,19]. These are particularly desirable features when determining the properties of heterogeneous polymer composites [15]. The disadvantages of this method include more complex data analysis and the need for high-quality and expensive optical equipment [20]. The Digital Image Correlation technique is successfully used to determine the parameters of composites [21]. The effectiveness of Digital Image Correlation in the analysis of composites is demonstrated by numerous scientific studies, the number of which is steadily growing [22]. Digital Image Correlation is used to characterize the mechanical properties of various hybrid composite types in tensile tests. This method allows the determination of Young’s modulus and tensile strength and, thanks to measurements in both the longitudinal and transverse directions, also enables the determination of Poisson’s ratio [23]. DIC also allows tracking the development of strain fields in composites with various fiber types. This enables the detection of strain distributions resulting from loading that differ from the normal distribution throughout the composite material [24]. DIC technology also enables the determination of the Young’s modulus of carbon fiber reinforced plastics (CFRP) subjected to aging under the influence of time and temperature [16]. This technology is also used in tensile and adhesion testing of composite reinforcements. Using DIC enables determination of a crack's location and width, as well as the mechanism of load transfer through the composite fibers [25]. By leveraging DIC's real-time visualization of the tested objects, this technique can also be combined with FEM analysis to monitor crack propagation in steel-composite joints [26]. The Digital Image Correlation technique also performs very well in fatigue tests, allowing for the observation of delamination in CFRP [27]. Delamination in polymer composites is a very common phenomenon, which is why it is frequently the subject of research. The combination of DIC with FEM enables a more complex analysis of this effect [28]. Numerical models can be experimentally validated using the 3D Digital Image Correlation technique [29]. Thanks to the composite material failure model developed based on the Hashin criterion and validated using DIC, it is possible to predict crack initiation and propagation without costly laboratory testing [29]. The analysis of composite damage images obtained from DIC has also been extended to include neural networks. Thanks to this approach, it is possible to classify DIC strain field images at the pixel level [30]. Digital Image Correlation is used not only for laboratory testing but also for finished engineering products. One example of the effective use of DIC for analyzing composite structures is its application to the inspection of helicopter rotor blades [31]. The combination of three-dimensional DIC with photogrammetry also allows for the detection of cracks in the helicopter fuselage, which is made of glass fiber reinforced plastics (GFRP) [32].
Despite the extensive application of Digital Image Correlation for the characterization of composite materials, the available literature provides only limited information on complete experimental datasets describing the mechanical and strength properties of autoclave-manufactured bidirectional GFRP and CFRP laminates produced from commercial prepregs under identical manufacturing and testing conditions. Such comprehensive datasets are essential for reliable finite element modeling and experimental validation of numerical analyses.
Therefore, the aim of this study is to experimentally determine a complete set of engineering constants and strength parameters for autoclave-cured bidirectional GFRP and CFRP laminates using standardized ASTM procedures and Digital Image Correlation. Furthermore, the study aims to provide a consistent comparison of both composite systems manufactured under identical conditions and to establish a reliable experimental database for future finite element simulations of polymer composite structures and machining processes.
RESEARCH METHODOLOGY
Material specimens
Material specimens for testing the mechanical and strength properties of polymer composites based on glass and carbon fibers impregnated with epoxy resin were prepared in accordance with ASTM standards. These specimens were made from prepreg fabrics with a thickness of 0.25 mm. The standards precisely specify the dimensions and method of specimen preparation, as well as the conditions for conducting measurements. Material specimens for tensile testing were prepared in accordance with ASTM D3039 [33], which recommends specimens with dimensions of 250 x 25 x 2.5 mm (length x width x thickness). The ASTM D3039 standard also specifies the manufacturing tolerances for the specimens. It allows a tolerance of +/-1% on the width dimension, corresponding to +/-0.25 mm, and a tolerance of +/-4% on the thickness dimension, corresponding to +/-0.1 mm. The compression test was performed on material specimens prepared in accordance with ASTM D6641 standard [34]. In accordance with this standard, specimens measuring 155 x 25 x 3.33 mm were prepared, with a tolerance of +/-1% (+/-0.25 mm) for width and +/-2% (+/-0.067 mm) for thickness. Material specimens for shear testing were prepared in accordance with ASTM D3518 standard [35]. The specimen dimensions recommended by the standard for shear testing at a +/-45° angle are 250 x 25 x 3 mm. The tolerances for width and thickness are +/-1 % and +/-4 %, respectively, which translate to linear dimensions of +/-0.25 mm (for width) and +/-0.12 mm (for thickness). The length and width of material specimens for shear testing are identical to those for tensile testing, with the exception that 8, 12, or 16 layers are recommended for fabrics. In the present study, 12-layer specimens were prepared for shear testing, corresponding to a thickness of 3 mm. Seven specimens of each type were prepared for two different composite materials. Each specimen was fitted with tabs at the ends to allow for mounting in a testing machine. Fig. 1 shows the detailed dimensions of the material specimens.
Glass fiber reinforced plastic (GFRP) specimens impregnated with epoxy resin were fabricated from prepregs in the form of HexPly 916G/7781/50±2.5% fabrics. In turn, material specimens of a carbon fiber reinforced plastic (CFRP) composite impregnated with epoxy resin were made from prepregs in the form of HexPly 6376/40%/285-H5/T300-3K/1200 fabric. Both prepregs are manufactured by Hexcel. The prepreg designation includes a description of the fibers and resin in its composition.
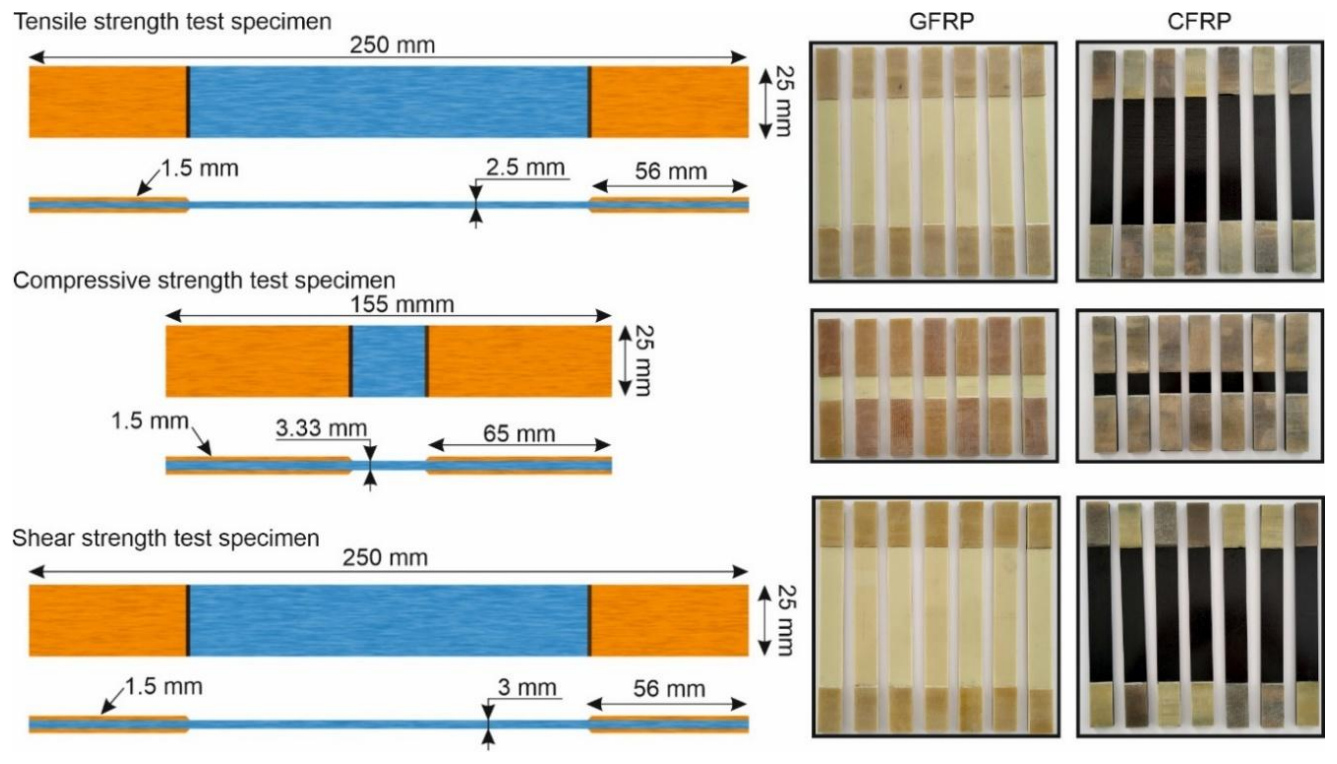
Fig. 1. Dimension scheme for material specimens used to determine mechanical and strength properties
In the name of the HexPly 916G/7781/50+/-2.5% prepreg, 916G specifies the type of thermosetting epoxy resin, which has a density of 1.30 g/cm3. In the name 7781, it specifies the type of fabric arranged in an 8H satin weave made of glass fibers (type E) with a weight of 299 g/m2. The final part of the description of a single layer of prepreg with a thickness of 0.25 mm specifies the resin weight content (50% ±2.5%). The designation HexPly 6376/40%/285-H5/T300-3K/1200 includes the type of thermosetting polymeric epoxy resin 6376 with a density of 1.31 g/cm3. Furthermore, the name includes the weight percentage of resin in the prepreg, which is 40%, and the average fabric weight of 285 g/m2 with a 5H satin weave (285-H5). The last part of the name describes the type of carbon fiber fabric (T300-3K), with a T300 class and a fiber count of 3,000 (3K). The number 1200 specifies the roll width in mm on which the prepreg is wound, with a thickness of 0.25 mm.
The composite specimens were manufactured using an autoclave process, with critical parameters including temperature, pressure, and curing time. The temperature and pressure responsible for polymerization were 175°C and 0.4 MPa, and the curing time was 2.5 hours.
Investigations of mechanical and strength properties
After the material specimens were prepared, they were tested to determine their mechanical and strength properties. Before testing, the specimens were measured and painted white and black to ensure the tested objects were visible to the cameras. The tests were conducted on an MTS 250 testing machine using the ARAMIS SRX system, which employs Digital Image Correlation (DIC) technology. The ARAMIS SRX is equipped with 12 MPx cameras, 8 GB of internal memory, and a 10G network interface. The use of Digital Image Correlation (DIC) technology enabled the measurement of displacement and strain fields, as well as the behavior of composite specimens during tensile, compressive, and shear testing. Prior to conducting the tests, the measurement system was calibrated according to the observed field of view, which was 155 x 130 x 50 mm. Calibration involved setting the distances and angles between the cameras and the test specimens. A scheme of the test setup for determining the mechanical and strength properties of polymer composites is shown in Figure 2.
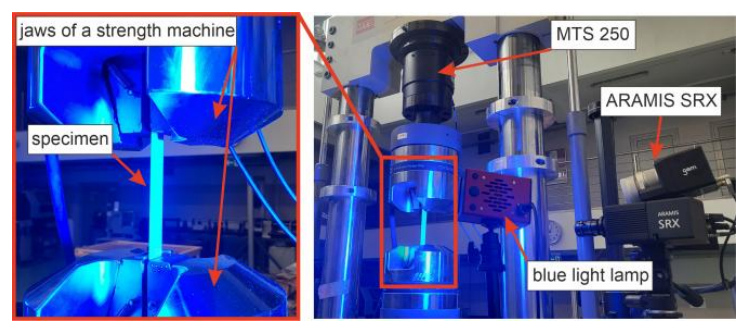
The research station was equipped with test heads in which the material specimens were mounted. For the compression tests in accordance with ASTM D6641, a special THS705-4G-W40-BP fixture was used, which applies a frontal load, enabling precise determination of the material’s compressive strength. The compression testing device is mounted between the jaws of the testing machine. The tests were conducted at a temperature of 24°C. Conducting the tests also involves using appropriate crosshead speeds for the testing machine’s jaws. For tensile, compressive, and shear tests in accordance with ASTM standards, crosshead speeds of 2 mm/min, 1.3 mm/min, and 2 mm/min were used, respectively. Thanks to the tests conducted, it was possible to determine mechanical properties such as Young’s modulus, Poisson’s ratio, shear modulus, and tensile, compressive, and shear strengths.
In the first stage of the research, tensile tests were conducted on specimens made of polymer composites with glass and carbon fibers, in accordance with ASTM D3039, to determine the Young’s modulus E12, Poisson’s ratio ν12, the tensile force Ft, and the tensile strength σt. Young’s modulus E12, which is identical in both directions for the fabrics, was determined based on equation (1):

where
σʹ – tensile stress at longitudinal strain εlʹ,
σʺ – tensile stress at longitudinal strain εlʺ,
εlʹ – longitudinal strain equal to 0.05%,
εlʺ – longitudinal strain equal to 0.25%.
In equation (1), the tensile stresses σʹ and σʺ are calculated using equation (2):

where
Ft – tensile force for longitudinal strain at εlʹ = 0.05% and εlʺ = 0.25%,
At – cross-sectional area of the specimen measured prior to tensile testing [mm2].
The Poisson's ratio is the ratio of transverse strain to longitudinal strain, calculated using the following equation (3):

where
εtʹ – value of transverse strain corresponding to longitudinal strain 0.05%,
εtʺ – value of transverse strain corresponding to longitudinal strain 0.25%.
The tensile strength σt is calculated using the following formula (4):

where: Ftmax – maximum tensile force before specimen failure [N].
Compression tests were then conducted in accordance with ASTM D6641, during which the compressive strength σc was determined using Equation (5):

where
Fcmax – maximum compressive force before specimen failure [N],
Ac – cross-sectional area of the specimen measured prior to the compression test [mm2].
The final stage of the testing involved shear tests, conducted in accordance with ASTM D3518, during which the shear modulus G12 and the shear strength τs were determined. Similar to Young’s modulus, the shear modulus is identical for both fiber orientations and is calculated using Equation (6):

where
τ12ʹ – shear stress value at shear strain γ12ʹ,
τ12ʺ – shear stress value at shear strain γ12ʺ,
γ12ʹ – shear strain equal to 0.1%,
γ12ʺ – shear strain equal to 0.5%.
In equation (6), the shear stress τ12ʹ and τ12ʺ are calculated using equation (7):

where
Fs – shear force for a shear strain γ12ʹ = 0.1% and γ12ʺ = 0.5%,
As – cross-sectional area of the specimen measured prior to the shear test [mm2].
The final parameter determined during the shear tests was the shear strength τs, calculated using equation (8):

where: Fsmax – maximum shear force before specimen failure [N].
The tests were conducted until the material specimens were destroyed, in accordance with ASTM D3039, ASTM D6641, and ASTM D3518.
RESULTS, ANALYSIS AND DISCUSSION
Tensile, compressive, and shear tests conducted on polymer composites made it possible to determine the force-time curves, obtained directly from the testing machine. Based on the force-time curves, it is possible to determine the maximum force for each specimen type and material at which the specimen was destroyed. The obtained force values and the strain values determined using the ARAMIS SRX system enabled the determination of the mechanical and strength parameters of each tested composite material. Force-time curves for the tensile testing of glass fiber reinforced plastics (GFRP T1, GFRP T2, GFRP T3, GFRP T4, GFRP T5, GFRP T6, GFRP T7) and carbon fiber reinforced plastics (CFRP T1, CFRP T2, CFRP T3, CFRP T4, CFRP T5, CFRP T6, CFRP T7) are shown in Fig. 3.
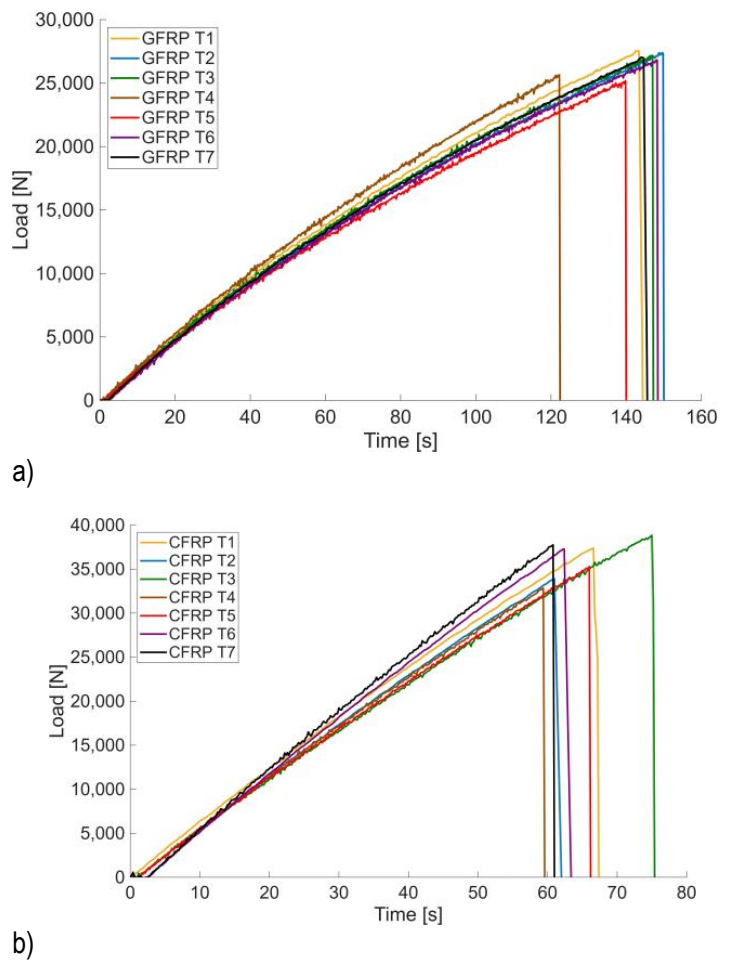
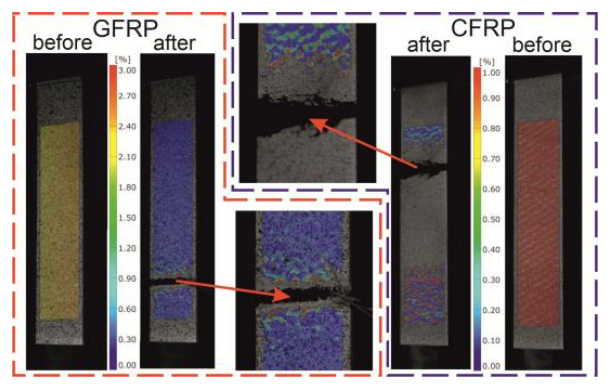
Based on the force-time curves, it is possible to determine the average maximum tensile force during the tensile test. The average maximum tensile breaking force for GFRP was 26,568.75 N, and for CFRP, this value was 36,109.25 N. Taking into account the average cross-sectional area of the specimens, which was 62.58 mm² (GFRP) and 62.55 mm² (CFRP), the tensile strength is 425.1 MPa for GFRP and 577.4 MPa for CFRP. The use of Digital Image Correlation (DIC) enabled visualization of the effect immediately before and after the specimen fracture, as shown in Fig. 4. A local accumulation of strain is evident, and the percentage strain relative to the original length is indicated by the scale.
The next stage of the research involved conducting compression tests on polymer composites in accordance with ASTM D6641. The specimens, mounted in the THS705-4G-W40-BP fixture within the testing machine's jaws, enabled stable compression testing of the composite specimens. Figure 5 shows the force-time curves for compressed specimens made of glass fiber reinforced plastics (GFRP C1, GFRP C2, GFRP C3, GFRP C4, GFRP C5, GFRP C6, GFRP C7) and carbon fiber reinforced plastics (CFRP C1, CFRP C2, CFRP C3, CFRP C4, CFRP C5, CFRP C6, CFRP C7).
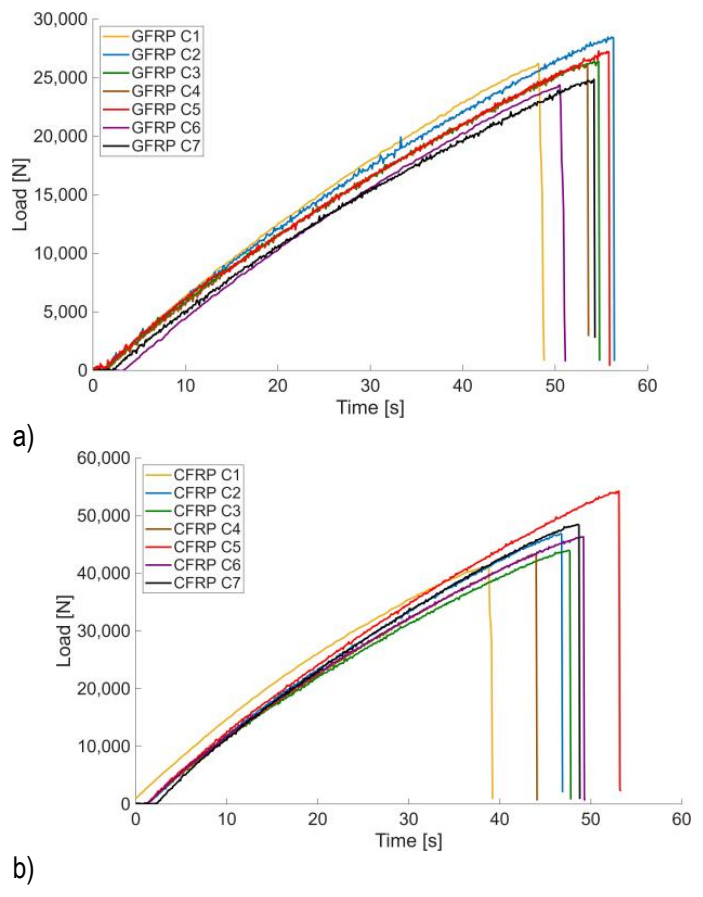
The plots presented allow for the determination of the average maximum compressive force occurring prior to specimen failure. The average maximum compressive force for GFRP was 26,769.61 N, and for CFRP it was 47,141.43 N. The cross-sectional areas of the compressed specimens were 82.54 mm² (GFRP) and 81.15 mm² (CFRP), corresponding to compressive strengths of 324.3 MPa for GFRP and 580.9 MPa for CFRP.
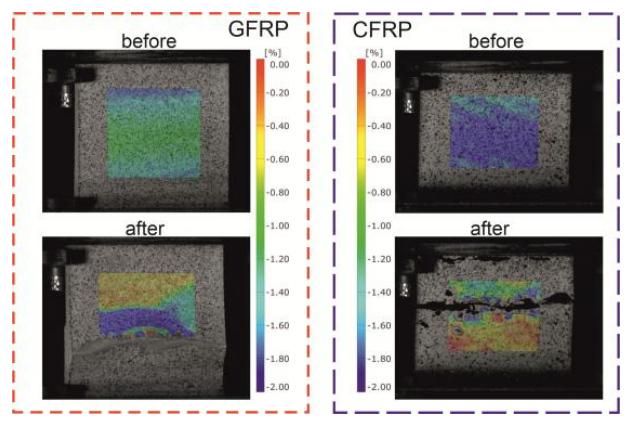
The fracture area of the specimen during the compression test of GFRP and CFRP is shown in Fig. 6. The color scale indicates the percentage of displacement in each of the tested composites.
The final test involved conducting a shear test on composite specimens in accordance with ASTM D3518. The specimens were designated as GFRP S1, GFRP S2, GFRP S3, GFRP S4, GFRP S5, GFRP S6, and GFRP S7 for the glass fiber reinforced plastics, and as CFRP S1, CFRP S2, CFRP S3, CFRP S4, CFRP S5, CFRP S6, and CFRP S7 for the carbon fiber reinforced plastics. As in previous tests, seven specimens were prepared for the shear test. The force-time curves obtained during the shear tests for GFRP and CFRP specimens are presented in Fig. 7.
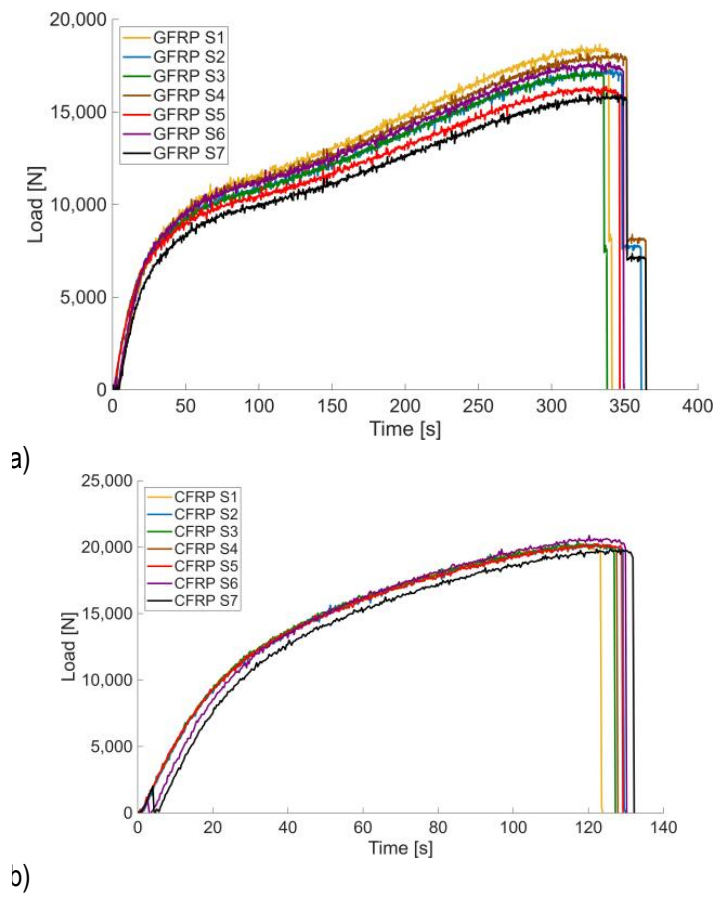
Based on the tests and plots, the average maximum shear force was 16,381.55 N for GFRP and 19,891.94 N for CFRP. The cross-sectional area of the specimen subjected to the shear test was 77.80 mm² (GFRP) and 77.02 mm² (CFRP). Based on Equation (8), the shear strength of GFRP is 105.3 MPa, and for CFRP it is 129.3 MPa.
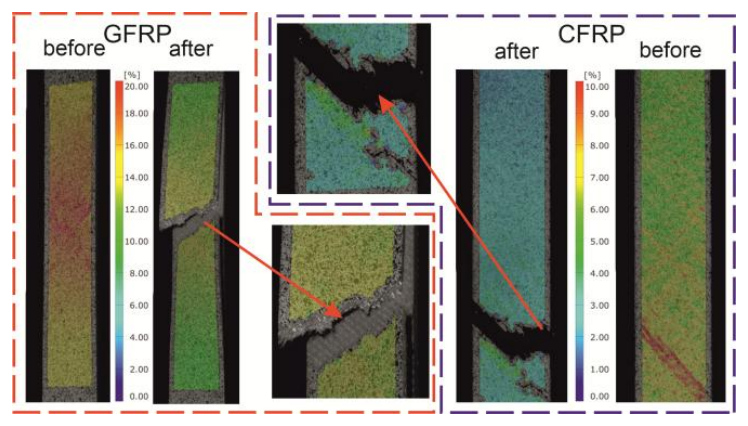
The use of DIC in shear testing enabled capturing images of the material specimen before and after cracking. Fig. 8 shows the specimens before and after failure for both composite types.
After conducting tensile, compression, and shear tests on a testing machine, the results were analyzed using Zeiss Inspect Correlate 2025 software, which utilized the Tensile Test Preparation and Tensile Test Evaluation scripts. The software, which incorporated relevant standards, was used to enter the cross-sectional dimensions of the specimens measured prior to the strength tests. As a result of the calculations performed in the software, it was possible to determine Young’s modulus and Poisson’s ratio in the tensile test, as well as shear modulus in the shear test for fabric-based composites. The structure of the fabric, composed of alternately arranged perpendicular fibers, indicates that the obtained values are identical in both loading directions. Tables 1–6 present all test values for polymer composites with glass and carbon fibers, along with the average values adopted for further analysis and the corresponding standard deviations.
Tab. 1. Values obtained from tensile tests on GFRP
Tab. 2. Values obtained from compression tests on GFRP
| Testing | Load Fc [N] | Strength σc [MPa] |
|---|---|---|
| Compressive | 27596.88 | 332.17 |
| 28462.08 | 348.65 | |
| 27374.58 | 322.5 | |
| 27166.63 | 321.5 | |
| 27278.38 | 336.54 | |
| 24610.36 | 302.6 | |
| 24898.38 | 306.15 | |
| Average value | 26769.61 | 324.30 |
| Standard deviation | 1443.10 | 16.41 |
Tab. 3. Values obtained from shear tests on GFRP
Tab. 4. Values obtained from tensile tests on CFRP
Tab. 5. Values obtained from compression tests on CFRP
Tab. 6. Values obtained from shear tests on CFRP
Table 7 presents a comprehensive summary of the average test results for the mechanical and strength properties of polymer composites based on glass and carbon fibers impregnated with epoxy resin, manufactured from prepregs in bidirectional fabric form.
Tab. 7. Material parameters of the polymer composites
The mechanical and strength properties presented in Table 7 were compared with published data available for fabric GFRP and CFRP epoxy laminates. Direct quantitative comparison between different studies should be made with caution because the reported properties strongly depend on the fiber architecture, fiber volume fraction, resin system, curing cycle, laminate thickness, and testing methodology.
Nevertheless, the experimentally determined Young's modulus, tensile strength, compressive strength, and shear properties obtained in the present study fall within the ranges reported for comparable fabric epoxy laminates manufactured using prepreg technology. Similar observations have been reported for autoclave-manufactured CFRP laminates by [36] and [37], as well as for fabric carbon/epoxy laminates tested according to ASTM tensile and compression procedures [14]. In particular, the fabric CFRP laminates investigated in [36] exhibited a Young's modulus of approximately 34.45 GPa and a shear modulus of 2.87 GPa. Although these values are lower than those obtained in the present study, the differences can be attributed to variations in the fiber architecture, fiber volume fraction, resin system, and manufacturing conditions.
For GFRP laminates, comparable mechanical behavior has also been reported for fabric glass fiber/epoxy composites, although differences in fiber architecture, fiber volume fraction, and manufacturing technology influence the final mechanical properties. It should also be noted that the majority of published studies report the mechanical properties of unidirectional composite laminates rather than woven fabric laminates. For example, Young's modulus and Poisson's ratio reported for unidirectional GFRP are 50.40 GPa and 0.296, respectively, while corresponding values for unidirectional CFRP are 123.53 GPa and 0.351 [38]. These values are considerably higher than those obtained in the present work, which is expected because unidirectional laminates exhibit superior stiffness and load-carrying capability in the fiber direction compared with bidirectional fabric laminates. Consequently, the differences observed between the present results and the literature are consistent with the influence of reinforcement architecture on the mechanical response of polymer composite laminates.
The mechanical and strength parameters obtained for the composite materials will be used in numerical simulations (FEM). The results will enable accurate modeling of the behavior of polymer composites during machining.
CONCLUSIONS
This paper presents experimental studies aimed at determining the mechanical and strength properties of polymer composites made with glass fiber reinforced plastics (GFRP) and carbon fiber reinforced plastics (CFRP). The materials were fabricated from prepregs in the form of bidirectional epoxy-impregnated fabrics. For tensile testing, material specimens were prepared in accordance with ASTM D3039. Compression testing was performed on material specimens prepared in accordance with ASTM D6641, and shear testing was performed on specimens specified in ASTM D3518. The tests described in this paper allowed for the determination of mean values and their standard deviations. Based on the experimental results, the average Young's modulus of GFRP (20,875.20 MPa) was determined, which is approximately three times lower than Young’s modulus for CFRP, which was 60,322.2 MPa. In the tensile test, the maximum tensile forces for GFRP (26,568.75 N) and CFRP (36,109.25 N) were also measured, allowing the tensile strengths of both materials to be determined: 425.1 MPa for GFRP and 577.4 MPa for CFRP. The compression test was used to determine the maximum compressive force and compressive strength for GFRP (26,769.61 N and 324.3 MPa) and CFRP (47,141.43 N and 580.9 MPa). In the final stage of the research, namely the shear tests of composite specimens, the maximum shear force (16,381.55 N for GFRP, 19,891.94 N for CFRP) and shear strength (105.3 MPa for GFRP, 129.3 MPa for CFRP) were determined. As part of this study, the shear modulus was also determined at 5,464.4 MPa for GFRP and 7,800.1 MPa for CFRP.
The obtained experimental database provides reliable input data for future numerical modeling of GFRP and CFRP structures. The use of identical manufacturing conditions, standardized ASTM testing procedures, and full-field DIC measurements enabled a consistent comparison between both composite systems and supports future validation of finite element models.
Further scientific work related to the machining of polymer composites will involve conducting numerical simulations based on the determined parameters. The simulations will also be validated through experimental research. The generated material dataset may also facilitate future research on machining, structural design, and failure analysis of polymer composite components.