
INTRODUCTION
Contact fatigue can cause parts of rolling/sliding machines, like cam followers, bearings, and gears, to fail. The fatigue failure process of these components begins with the formation of micro-cracks between the contacting rolling elements due to the stress field below the surface, which eventually causes material removal, called RCF [1]. So far, the most common transmission problem is contact fatigue failure, which causes high friction and thus high energy consumption[2]. In some sensitive applications, gears are used to transmit high power/torque, which means more energy is spent to overcome friction and wear. Literature shows that 5.1% of fuel energy is used for friction and wear, of which only gears consume 55% of fuel energy [3]. Besides, further research is currently underway to improve transmission performance to reduce maintenance costs significantly. Due to the service life and performance of power transmission gearboxes, RCF testing is very important for the development of new materials that can operate at high rolling speeds [4, 5].
In this case, the gearbox gear with non-conformal rolling/sliding contact due to the contact pressure between the tooth surfaces on the gear tooth flanks can easily reach a pressure of up to 1 GPa Hertz. Therefore, near these surfaces, there are three main failure mechanisms caused by these conditions. These are excessive wear, scuffing, and rolling contact fatigue. Rolling contact fatigue is divided into subsurface RCF and surface RCF [6]. As shown in multiple literature studies, various methods and analyses have been developed to study the RCF of rolling/sliding components [7-11]. These studies were established to define different testing methods. Three types of tests have been identified as benchmarks [12], including accelerated testing [13], long-term tests [11], and full-scale rig tests [10]. As a result, this study is a long-term experiment. Verifying the material qualities of new alloy steel gear material using gear samples necessitates several costly and time-consuming test processes and tracking records. To replicate the contact between the teeth of the two gears' flanks, the contact state of the gears is switched to two test rollers (discs) [14].
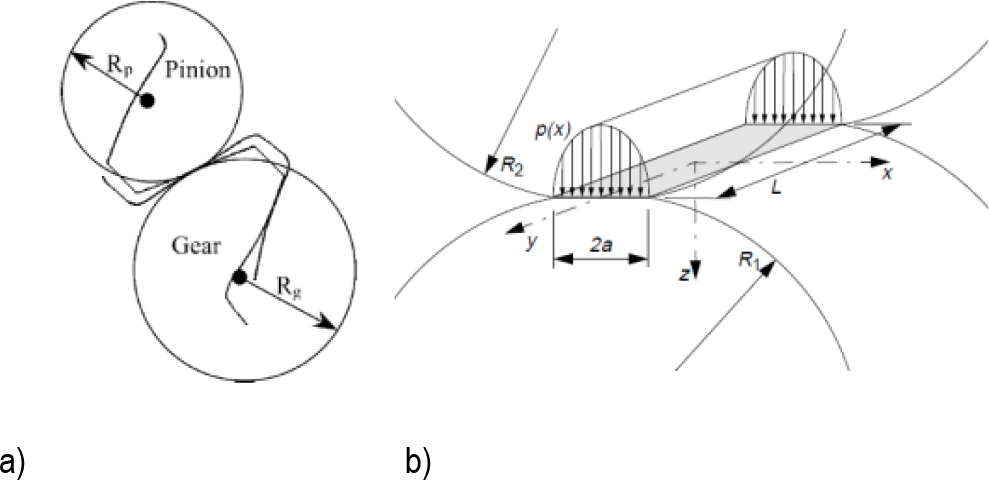
During the RCF test, the slide-to-roll ratio (SRR) simulates a specific point on teeth with an equivalent SRR during actual gear meshing. Pure rolling simulates the point of contact with a pitch line. The teeth of gears usually have pits at the root or tip. Two rollers can be used to simulate the RCF of mating transmission gears. It is easy to observe experiments with continuous motion, slip, and sliding, and oil thickness.[15]. Accordingly, Fig. 1 schematically illustrates how the Hertzian contact pressure between the two test roller specimens simulates the two gear teeth in the RCF test.
Fig. 1.
Cylinders simulate two gear teeth in an RCF test (a), and Hertzian contact between two rollers(b) [15]
The RCF twin-disc test bench uses a disc-shaped sampling roller with a built-in temperature-controlled lubrication system, contact load, and a predefined period of fixed speed rotation. The machine uses two disc-shaped rollers, powered by a separate AC motor. The test result of such an experimental test is the same as the actual application of the transmission gear mechanism [16].
Damage of RCF transmission gear is a very complex issue because many parameters are considered when commencing to simulate using by twin discs test rig. Material type, surface profile, load, lubrication, and SRR are a few of the factors taken into account in RCF test working conditions [17]. The RCF damage is mainly caused by micro-cracks, and small cracks protruding from the surface can damage the transmission gear. And, visible gray or frost on the surface is exhibited and usually named as frost gray/micro-pitting [18, 19]. Repeated stress and plastic deformation are affected by many factors, such as load, speed, temperature, surface quality, heat treatment, and lubrication properties. Research studies have shown that micro-pitting can cause considerable surface damage and even catastrophic damage [20].
The tooth contact fatigue test, also known as the gear contact fatigue test, is a type of gear performance test that is primarily used to assess lifetime, pitting, and spalling. When transmission gears are made of alloyed steels with sufficient hardness to obtain micro-structures consisting mainly of tempered martensite, the gears have optimal resistance to micro-pitting. As the residual stress in the case-hardened gear reduces the toughness, strength, and residual compressive stress by more than 30%, the micropitting resistance is reduced [21].
In the RCF test, in addition to design factors, surface topography also stimulates friction and wear between the rolling/sliding surfaces of gear teeth [22]. There are various gear manufacturing and finishing approaches. In terms of efficiency, ultra-super finish gears are more powerful than ground gears. As the surface moves in, the conformity between the mating bodies is improved. During the running-in phase, the more aggressive roughness will plastically deform, and the surface will become smoother. This situation has changed drastically due to multiple conditions [23]. It is commonly recognized that proper running-in can increase the lifespan of parts like gears [24]. Real surfaces initially make contact at the points of asperities when they come into touch [25]. Despite applying the normal load, extremely high pressure is created around micro-contacts, and the plastic deformation of asperities in the contacting bodies' surface results in the production of a very small area known as the true effective contact area [26].
MATERIALS, GEOMETRY, METHODOLOGY AND CONDITIONS
. Materials
The high-speed and low-speed samples were made from commercially available Cr-Mo alloy steel and a newly developed Ni-doped Cr-Mo alloy steel. The chemical composition of alloy steel, both newly created and commercially accessible, is depicted in Tab. 1. Commercially available and newly developed samples were manufactured using the same process, which included melting in an argon atmosphere vacuum, hot forging, applying Ni content (for the newly developed material), rolling the forged material to the desired shape, normalizing, heat treatment (tempering, quenching, and nitriding), and surface finishing.
. Geometry
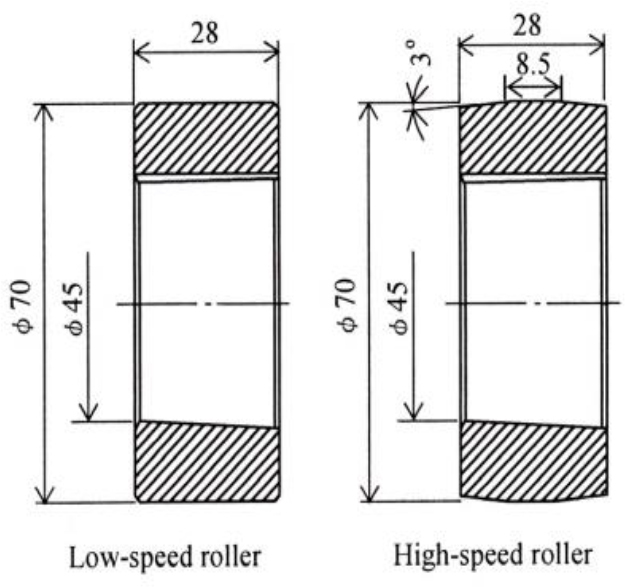
To achieve the least effective contact area, the high-speed specimens in this investigation were crowned-shaped discs, while the low-speed specimens were cylindrical-shaped discs. Cylindrical and crowned disk samples with the same surface polish and hardness were employed in the sample preparation procedure. A tribologically compatible disc-on-disc test is used in gear RCF testing to minimize the time and expense involved in producing complex gear geometries. Consequently, disc specimens with outer and inner diameters of 70 and 45 mm, respectively, and a thickness of 28 mm were produced. The high-speed disc geometry is altered in this experiment so that the 8.5 mm effective contact surface is crowned on both sides by 3 degrees (30). The test discs' measurements in Fig. 2 were modified for greater clarity from [27].
. Methodology
Analytical models struggle to accurately predict micropitting due to its asperity level impact on the specimen's metallurgy, surface roughness, lubrication properties, applied stresses, and tooth shape [20]. Research suggests using rolling pairs of discs in loaded contact to replicate transmission gears, reducing costs and time-consuming preparation of spacemen's equipment, and assessing contact fatigue capabilities of different gear materials [28-31]. The fact that disc specimens are more durable than gears is acknowledged by researchers, who employ disc specimen studies to assess the surface fatigue performance of various materials. Therefore, an experimental test with disc samples is the most effective method for determining the micropitting area ratio of a transmission gear [32].
The modified RCF twin-disc test equipment was used in Ethiopia for experimental testing, positioning specimens on separate shafts powered by AC motors. The design and development were optimized according to the test sample's standard specification, resulting in a contact pressure of [27]. According to the literature, lubricating the disc-to-disc contact region required applying one drop of water or transmission oil every three seconds [33]. Additionally, lubricant temperature is a crucial test parameter that affects its viscosity. An induction system is used to maintain the required temperature, ensuring the oil temperature doesn't exceed 150°C. [34].
Therefore, as shown in Tab.2, the severely saturated SAE 90 grade was used in this study's modified twin-disc test setup, and the controlled lubricant temperature ranged from 80 to 90 °C.
. Contact Load Conditions and Parameters
A step load stage procedure was used for the experimental tests, which involved progressively raising the normal load applied up to 8.2 KN and reaching a maximum Hertzian contact pressure of 1.5 GPa. Tab. 3 provides a summary of the experimental tests. Four distinct load levels (K3, K6, K8, and K9) are seen in the usual load on the rollers (disks). The reference makes it apparent that these loads are broken down into sub-levels [6]. Almost ten million (107) load cycles are required for high-speed discs to finish the test, with each load phase taking several minutes to hours. Furthermore, low-speed discs required about 5 million load cycles to operate. At every load stage change, the sole lubricating oil was changed. Nevertheless, there was no change in the lubricating oil between load sub-stages. Following each disruption, the test bench's discs were removed, cleaned, weighed, and measured before being replaced with a fresh test specimen. The SRR, which is displayed in Tab. 4, is the crucial parameter throughout the run-in and RCF testing. SRR is the ratio of sliding and rolling velocity in a twin-disc device, with rolling velocity corresponding to lubricant entrainment as indicated in equation (1). It affects RCF testing, with higher SRR resulting in greater pitting, as calculated using Equation 1 [35]. The study suggests that surfaces with negative SRR values are more susceptible to micropitting due to their maturity [36].
where: us –sliding speed, ur –Mean rolling speed, u1 –Surface speed of body 1 (m/s), u2 –Surface speed of body 2 (m/s)
Tab. 3.
Parameters during the run-in and RCF Experiment
| Test Stages | Description | High-speed disc(rpm) | Low-speed disc (rpm) | Slip ratio | SRR |
|---|---|---|---|---|---|
| K3, K6, k8 & k9 | Run-in & RCF | 2800 | 1400 | -1 & 0.5 | 0.66 |
Tab.4.
Load stages on RCF Experiment
Slip between the contact surfaces is another factor that influences the rolling contact's lifespan. Keep in mind that the slip of Entity 1 is provided by Eq. 2. The surface's durability depends on the presence and severity of slippage, with positive slip preventing contact fatigue cracks and negative slip increasing surface wear and decreasing initial load cycles.
RESULT AND DISCUSSION
RCF experimental testing on Cr-Mo and Ni-doped Cr-Mo alloy steels was conducted under identical conditions to ensure gear damage robustness. The experiment showed damage in wear mass, surface topography, and surface morphology. Following a successful experimental test, evaluate the cutoff samples' surfaces using an optical microscope and an electron microscope (SEM) to determine their surface characterization. As a result, low-speed samples typically experience rapid RCF failure because of negative SRR. Micropitted area (Ap), Micropitted depth, and the corresponding diameter of the pitted surface were used to explain the RCF failure and disclose RCF damage, as confirmed by research studies.
. Surface characterization
Purposefully, the material's tribological properties can be obtained by the methodical assessment of damaged surfaces. Both the high-speed and low-speed disc samples were measured and examined in this work following the completion of the RCF test. Using SEM and OM micrographs, examine the damaged samples by viewing and post-processing the micrographs of the discs' damaged surfaces. Additionally, MountainsMap® software for SEM and OM imaging was used to calculate the textural characteristics in the micrographs. After analysis, the textural parameters were presented as the mean of several scales and magnification data. Using leveling filter techniques, the SEM image's cylindrical characteristic is eliminated. Consequently, the cylinder feature was eliminated from the SEM and OM micrographs using a third-order polynomial function.
Fig. 3 (a) and (b) revealed the reconnoitered damaged surface texture of the Cr-Mo alloy steel disc samples. Surface roughness was used to measure the surface maps of the Cr-Mo alloy steels' high-speed and low-speed discs. At both high and low speeds, the surface map of the Cr-Mo alloy steel's Root Mean Square (RMS) surface roughness (Sq) is acceptab‥ The two surface maps show that the low-speed disc's surface roughness is marginally higher than the high-speed discs.
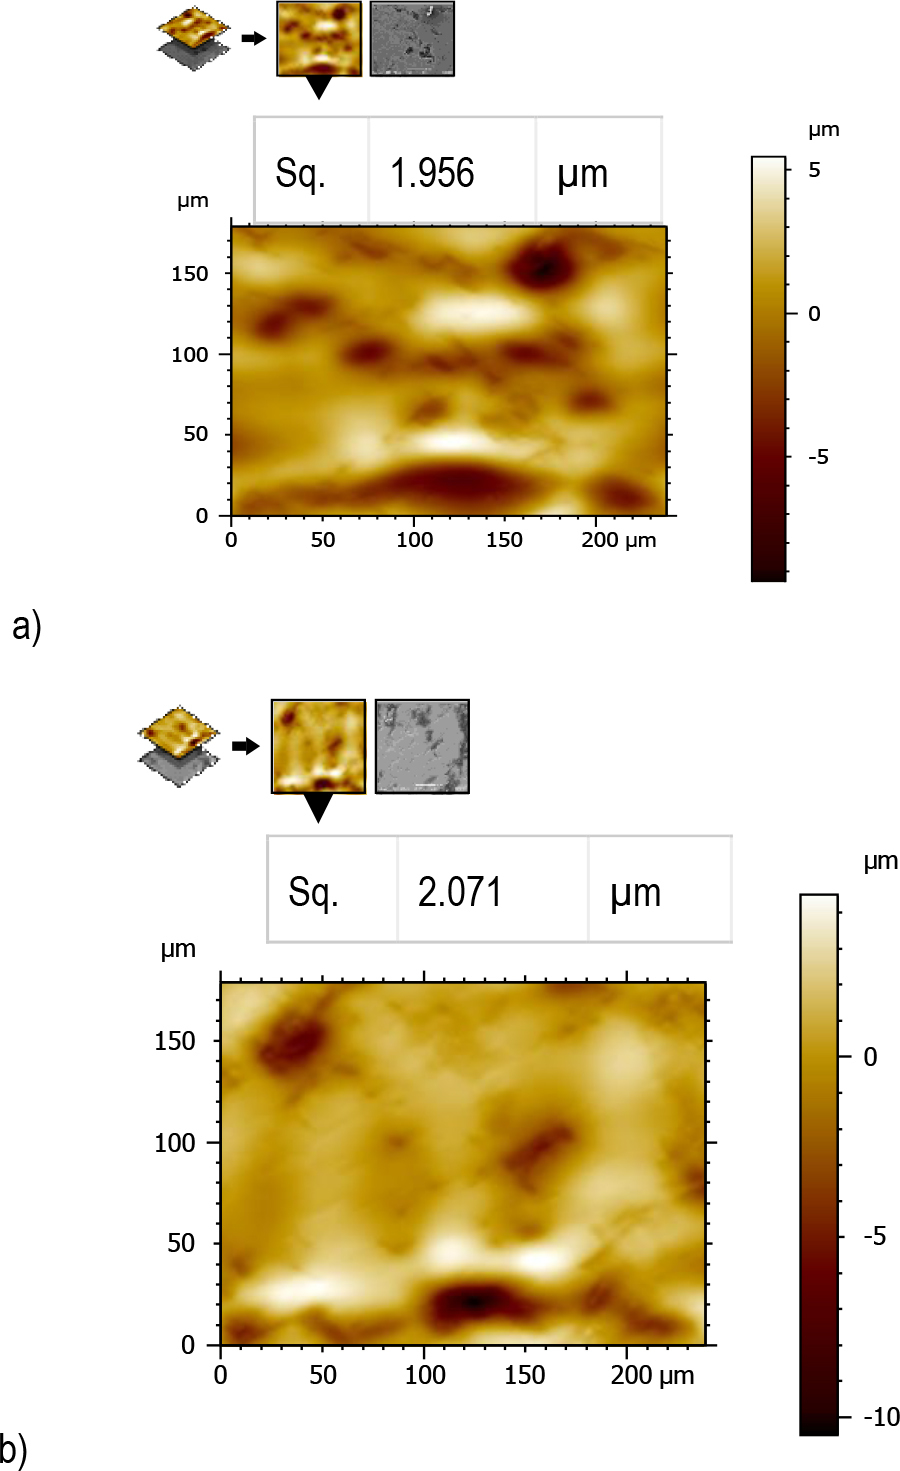
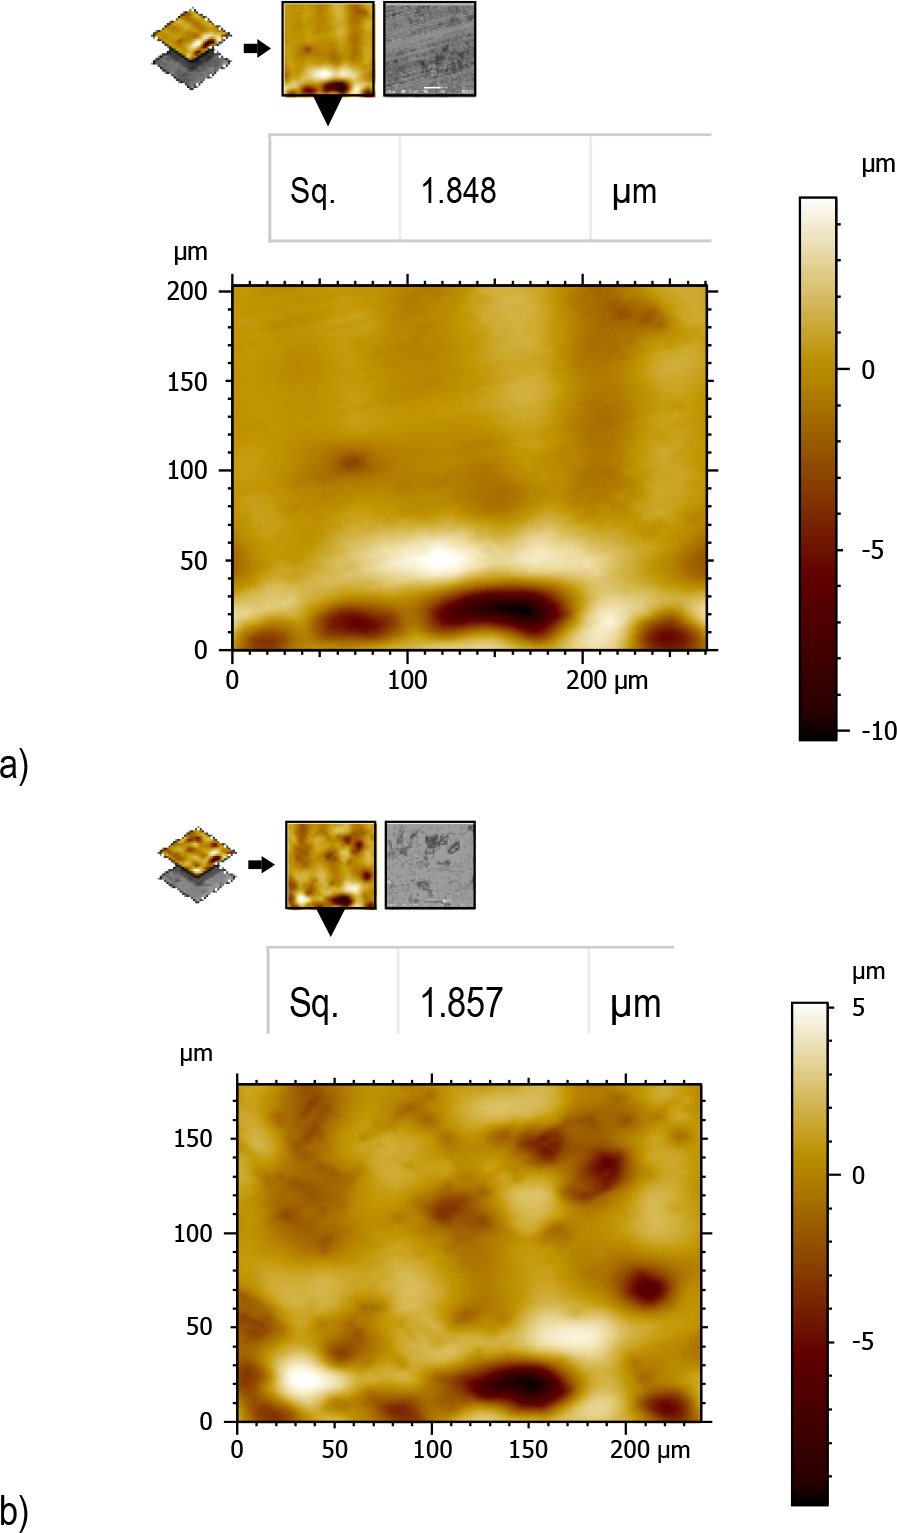
Fig. 4 (a) and (b) examine surface maps of RMS surface roughness (Sq) for high-speed and low-speed discs of Ni-doped Cr-Mo alloy steel materials. Results show that Ni-doped Cr-Mo alloy steel has lower surface roughness than Cr-Mo alloy steel, indicating a positive correlation between surface damage and root mean surface roughness texture. The area with more damage increases with surface RMS roughness.
Surface Morphology
Following the RCF testing, a small sample of the tested disc specimens was extracted from the twin-disc test bench, cleaned with an ultrasonic cleaner, and dried with hot air. The extracted sample discs were then analyzed by SEM at various magnifications and scales (200 μm, 100 μm, 50 μm, 20 μm, and 10 μm). Additionally, a small piece of the examined disc is extracted for optical microscope (OM) purposes in this investigation.
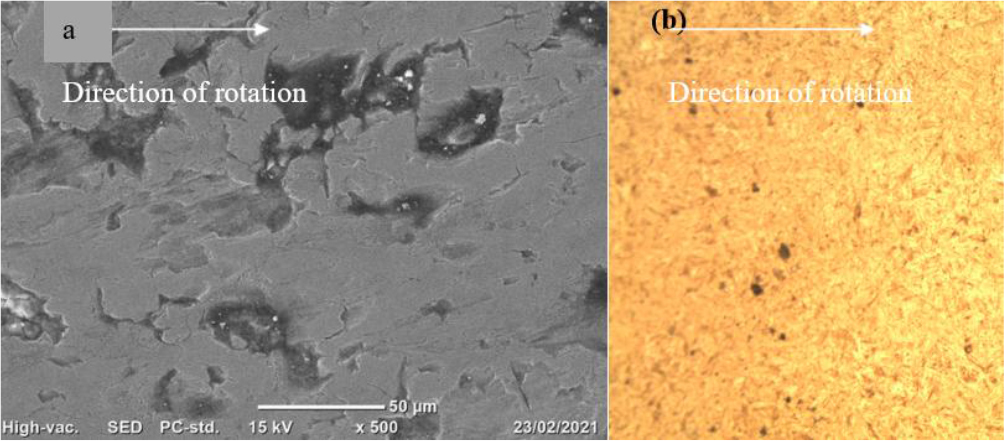
OM and SEM micrographs of the high-speed and low-speed disks of Cr-Mo and Ni-doped Cr-Mo alloy steels were displayed in Fig. 5 to 8. Among the several SEM micrographs of high-speed and low-speed discs of Cr-Mo alloy steel materials, Fig. 5 (a) & (b) and Fig. 6 (a) & (b) show SEM micrographs of 50 μm scale and 500 magnifications. It is evident from both micrographs that pits are already present. Following a run-in, mated bodies that are subjected to rolling or sliding motion experience significant plastic deformation [35, 37]. After 10 million stress cycles, the damaged area of the Cr-Mo alloy steel is visible in Fig. 5, high-speed disk micrographs. Consequently, some surface micropits are visible. The Cr-Mo alloy steel of low-speed disk SEM micrographs at about 5 million stress cycles is similarly shown in Fig. 6. When the disk is viewed under high magnification, minute pits are apparent.
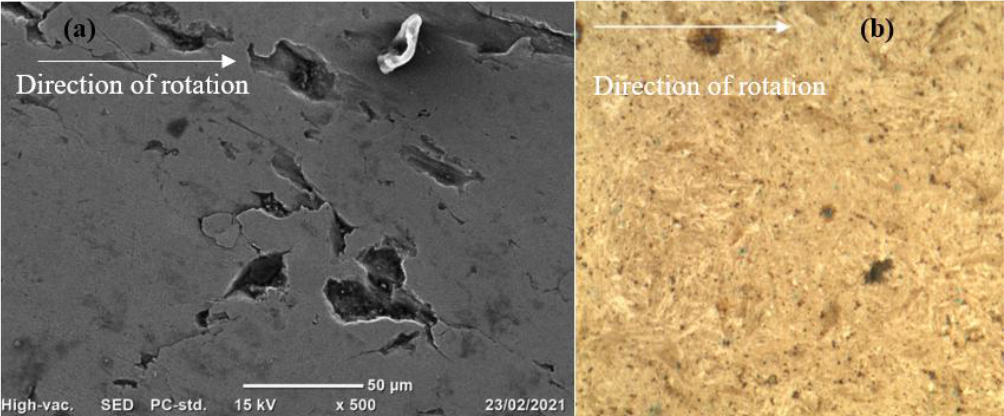
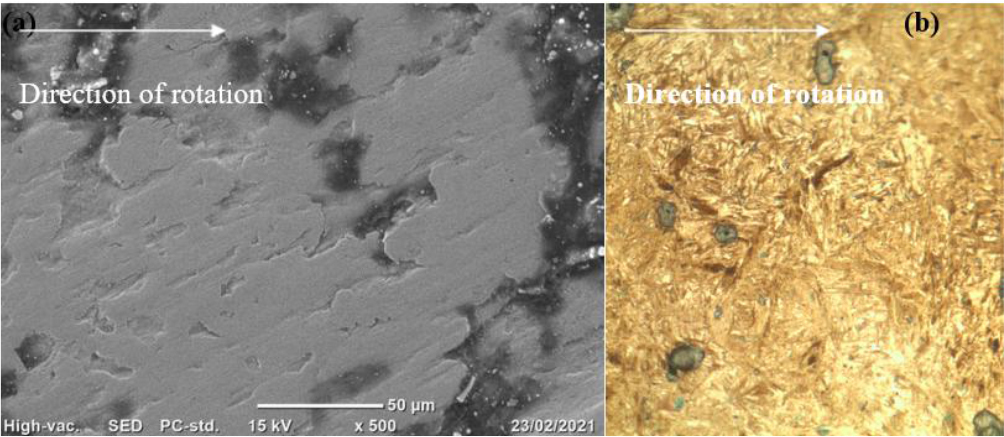
Fig. 7.
High-speed Ni-doped Cr-Mo alloy steel after RCF test (a) SEM Micrograph, and (b) OM Micrograph

SEM micrographs of 50 μm scale and 500 magnifications were also shown in Fig. 7 and 8, which were SEM micrographs of high-speed and low-speed discs of Ni-doped Cr-Mo alloy steel. After 10 million stress cycles for the high-speed disc and 5 million stress cycles for the low-speed disc, the pitted section of the Ni-doped Cr-Mo alloy steel of the high-speed disc micrographs is shown in Fig. 7 (a) and (b). Micropits are therefore visible on both surfaces. Similarly, low-speed disk SEM micrographs of the Ni-doped Cr-Mo alloy steel at almost 5 million stress cycles are shown in Fig. 8. When viewing the disk at high magnification, it is understandable that micro pits are visible.
This study uses MountanMap® software to compute micropitting variables like pitted depth, equivalent diameter, and roundness from SEM micrographs. The factors are determined by shifting the micrograph to topography, converting it to a 3D image, and determining pit factors. A micro pit is defined as a surface imperfection with a depth more than 1 μm and a diameter between 10-50 μm below the surface's mean plane [38, 39]. In this study, damaged surfaces with a pitted depth greater than or equal to 1 μm, an equivalent diameter between 10–40 μm are regarded as micropitting. Else if the values are beyond the stated values, it is considered small pitting.
Fig. 9, 10, 11, and 12 show histograms of micropitting metrics such as pitted depth, pitted equivalent diameter, and pitted roundness for the two candidate materials at high and low speeds. Fig. demonstrate micron-level depths ranging from -1.0 μm to -10 μm, with equivalent pit diameters ranging from 10-40 μm, indicating pitting at both the micro and macro levels. As the fatigue cycle progresses, the macro-scale depth and equivalent diameter rise. However, at both high and low speeds of Cr-Mo alloy steel material, pits of considerable depth (up to 12 μm) and equivalent diameter (up to 50 μm) are seen, as shown in Fig. 11 (a) and (b) and 12 (a) and (b). Fig. 9 (a) and (b), Fig. 10 (a) and (b), Fig. 11, and Fig. 12 show that surface damage is more severe in Fig. 12 (a) and (b). Since certain pits in Fig. 12 (a) and (b) appear deeper than pits in another identical image.
Fig. 9.
Ni-doped Cr-Mo alloy steel of low-speed micropits (a) equivalent diameter, (b) depth, (c) shape, (d) correlation b/n micropits depth and micropits equivalent diameter
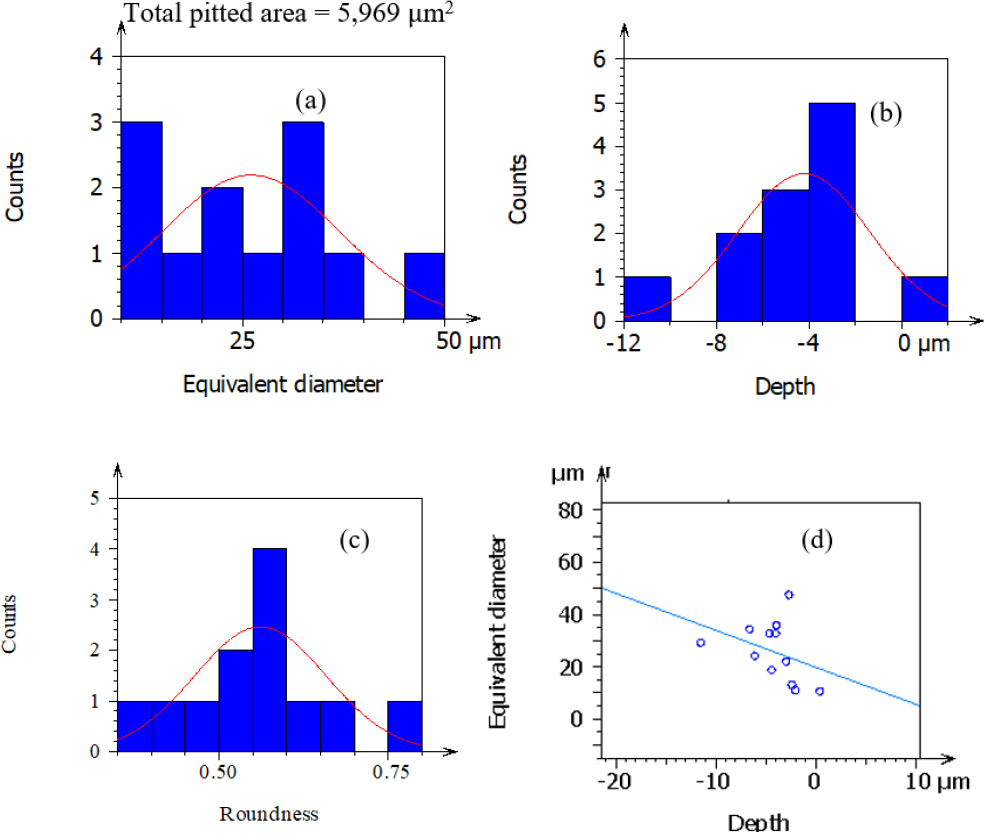
Fig. 10.
Ni-doped Cr-Mo alloy steel of high-speed micropits (a) equivalent diameter, (b) depth, (c) shape, (d) correlation b/n micropits depth and micropits equivalent diameter
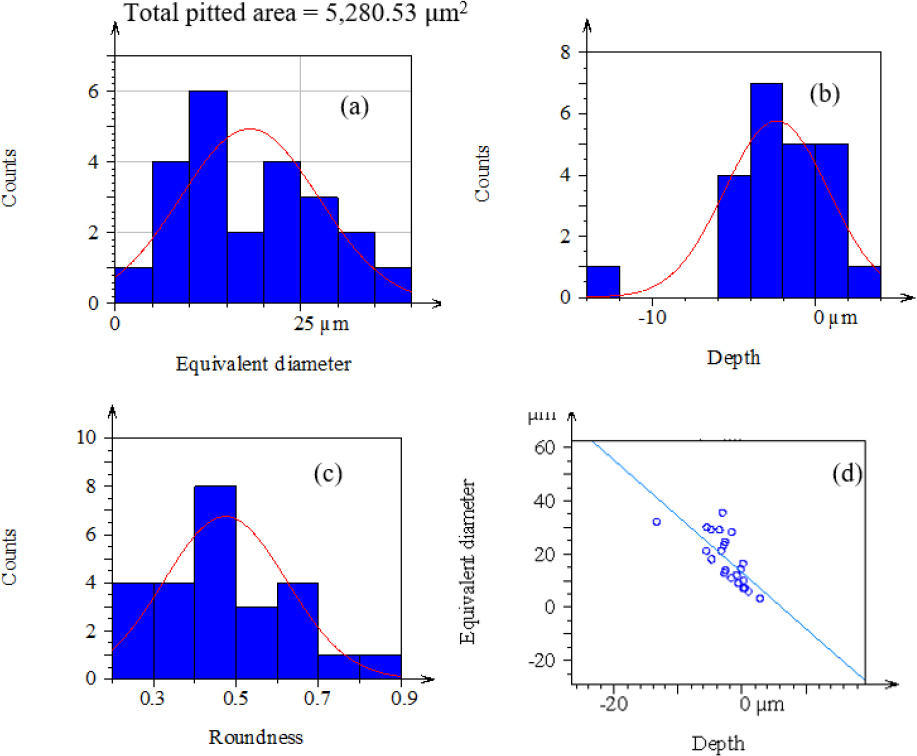
Fig. 11.
Cr-Mo alloy steel of low-speed micropits (a) equivalent diameter, (b) depth, (c) shape, (d) correlation b/n micropit depth and micropit equivalent diameter
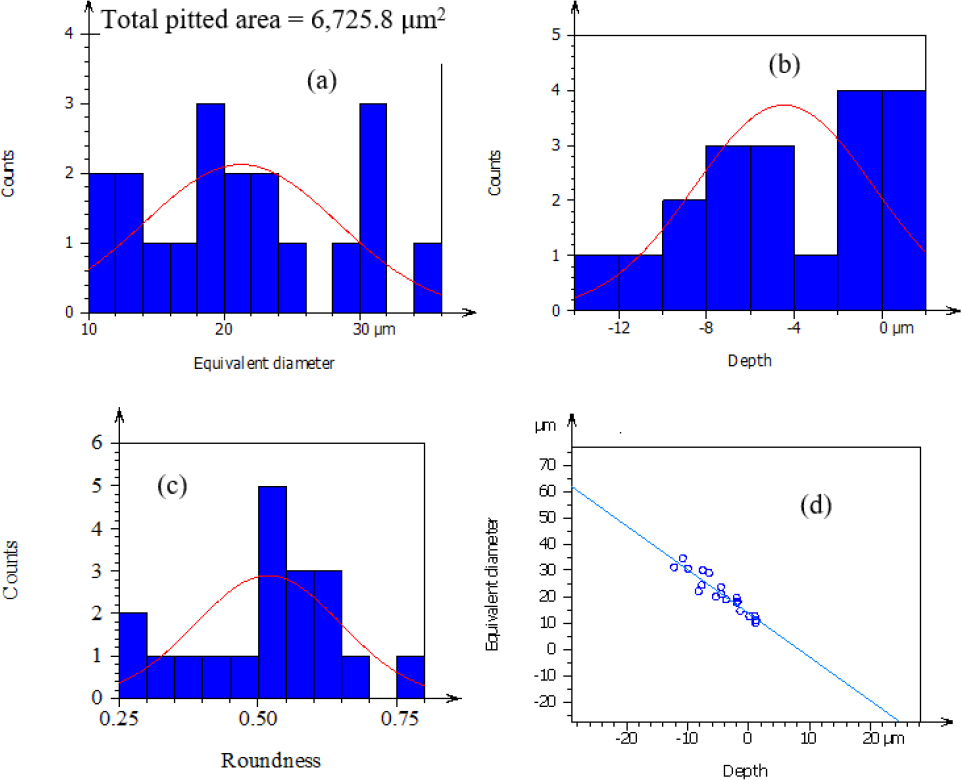
Fig. 12.
Cr-Mo alloy steel of high-speed micropits of (a) equivalent diameter, (b) depth, (c) shape, (d) correlation b/n micropit depth and micropit equivalent diameter
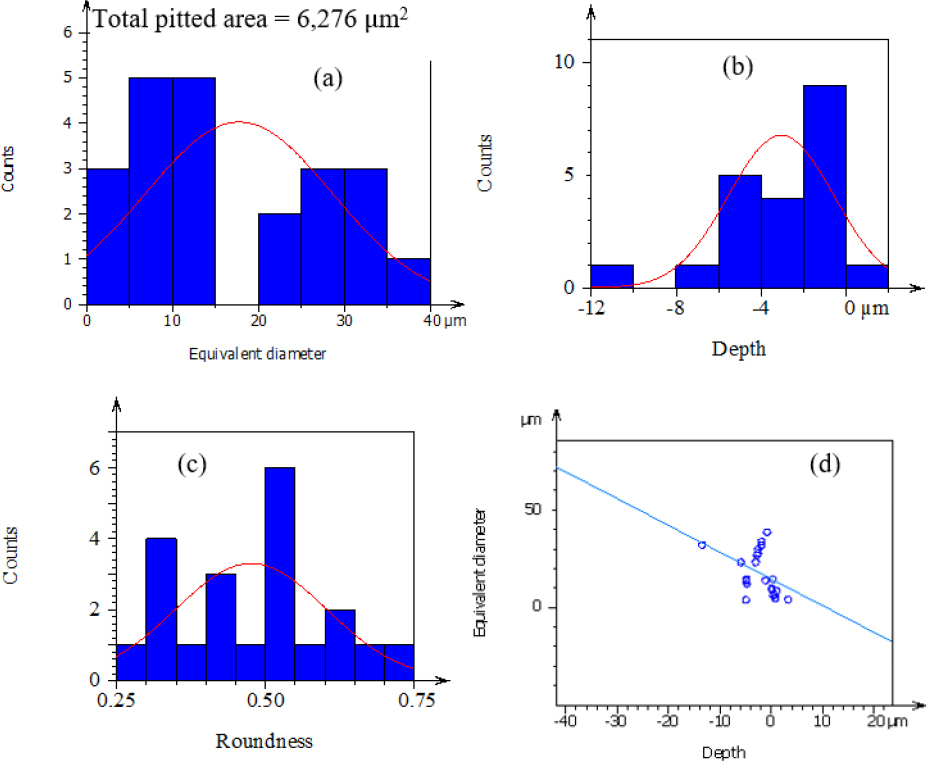
Similarly, Fig. 9 (c), 10 (c), 11 (c), and 12 (c) depict the morphology of the micro pits in the candidate materials. If the micro pits are circular, the value becomes one. As seen in the Figures, the closer the pits are to one, the more circular the shape; the further apart from one, the less circular the shape. Another factor used to distinguish between micropitted and macropitted areas is the establishment of a link between micropitting depth and equivalent diameter. Fig. 9 (d), 10 (d), 11, and 12 (d) show a link between pit depth and equivalent diameter. In this study, a pit is said to be a macro pit if the diameter of the pit exceeds 50. In Fig. 12 (d), the pitted depth of the Cr-Mo alloy low-speed disc pit is limited to 10 μm. Although the maximum pit depth of a low-speed disc with 12 μm (see Fig. 12 (b), it is much deeper than that of a high-speed disc.
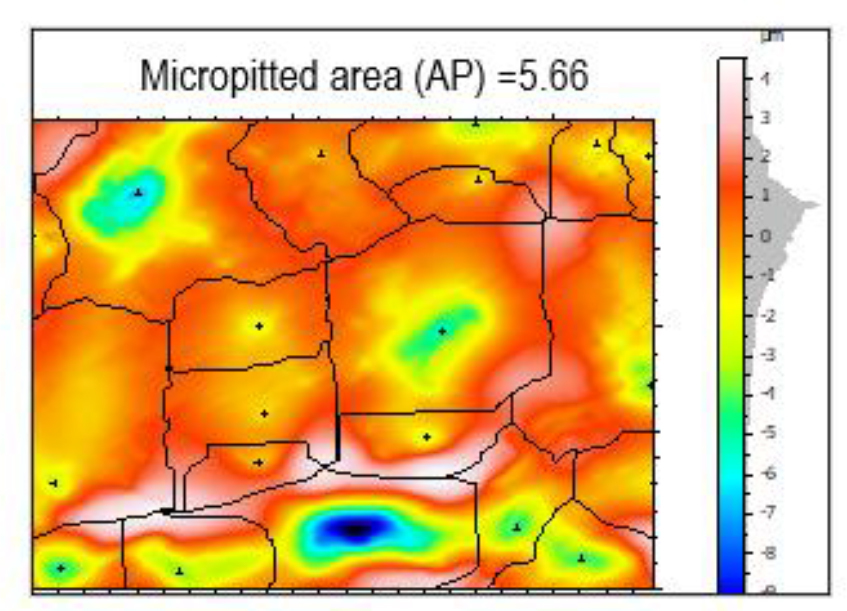
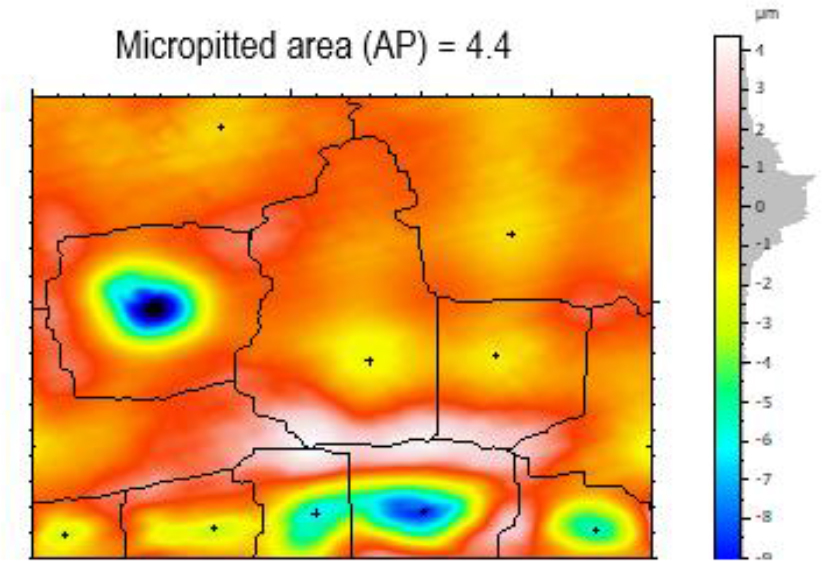
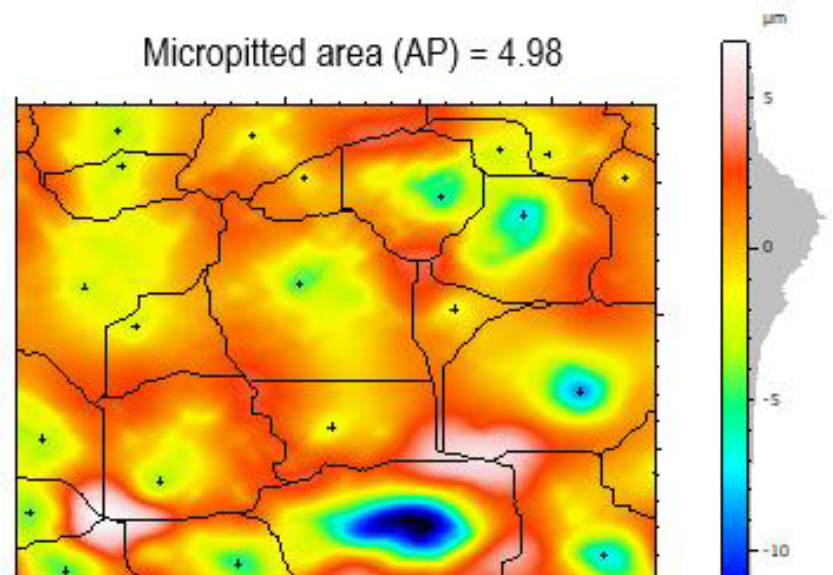
Fig. 13 to 16 show rainbow topography scale photographs, with the blue (watershed segmentation) area representing the pitted area and the reddish area representing the undamaged area. The damage component is given as a percentage of the micro pitting area ratio (AP), which is likewise shown on the upper side of Fig. 13 to 16. The percentage of the Micropitted area can be calculated by dividing the total pitted area by the whole surface scanned by the SEM. The overall picture area for all potential materials is 120,000 μm2. Fig. 14 displays a bigger micropitting area ratio of 5.66%, whereas Fig. 16 shows a lower ratio of 5.23%.

To create novel alloy steel for power transmission gears, this study generally investigates the effects of adding Ni content in varying amounts to the current Cr-Mo alloy steel. The findings then continue to show that a Ni-content of 1.55% has good resistance to fatigue failure. Studies with a higher Ni-content (2% Ni) alteration than the candidates in this investigation provided further support for these findings.
CONCLUSIONS
The assessment of Cr-Mo and Ni-doped Cr-Mo alloy steels in high-speed and low-speed disc specimens has been experimentally investigated in this work. Every alloy steel candidate sample came from the same batch that was manufactured, heat-treated, and had the same surface polish. A twin-disc test rig was used to examine the rolling contact fatigue of the candidate materials. Following that, SEM was used to evaluate the damaged area of the tested disc samples at different places using varying scales and magnifications. It was easy to examine the damage that occurred on both of the candidate materials with pitted characteristics using the micrographs that were acquired from OM and SEM, and the following conclusions were reached:
– Damage resistance has a Positive correlation with root mean surface roughness (Sq) and surface damage. As a result, Ni-doped Cr-Mo alloy steels have less Sq compared with Cr-Mo alloy steel.
– In comparison to Cr-Mo alloy steels, Ni-doped Cr-Mo alloy steel has a higher resistance to micropitting in terms of pitted diameter, pitted depth, and micropitted area ratio.
– The Ni-doped Cr-Mo alloy steel is the preferred material for transmission gears and withstands rolling fatigue failure.