
. INTRODUCTION
The global demand for energy continues to rise due to rapid population growth and industrial expansion. Over time, the significant increase in residential and commercial buildings has widened the gap between energy production and consumption, particularly in developing nations. As reported by the International Energy Agency (IEA), the real estate and construction sector accounted for approximately 35% of the world’s total energy consumption in 2024, with residential buildings representing the largest share at 22% of total energy usage. Egypt relies heavily on imported fossil fuels for energy production. However, the continuous rise in global fossil fuel prices has rendered it increasingly challenging for the country to meet the energy demands of its residential sector. To enhance energy efficiency in buildings, Egypt introduced building codes in 2013, incorporating various strategies. However, most of these strategies primarily focus on traditional thermal insulation methods for building envelopes. Despite their widespread use, traditional insulation materials come with significant limitations. Organic insulation materials are highly flammable and produce toxic fumes, while inorganic insulation materials are costly and dense, which reduces their suitability for conserving energy in buildings [1]. Moreover, increasing the thickness of insulation is often suggested as a method to enhance energy savings. However, this approach is not always practical due to space limitations, particularly in lightweight buildings [2]. As a result, achieving a balance between reducing cooling and heating loads while maintaining indoor thermal comfort becomes challenging when relying solely on traditional thermal insulation materials.
In this context, Phase Change Materials (PCMs) offer a solution for enhancing the energy efficiency of buildings. These materials have the ability to store a significant amount of latent heat, which helps regulate indoor temperatures. During the phase change process, phase change materials (PCMs) store and discharge thermal energy by absorbing heat during melting and releasing it upon solidification while maintaining a nearly constant temperature. This characteristic provides high energy density and contributes to stabilizing indoor thermal conditions, thereby lowering dependence on traditional heating and cooling systems [3]. As a result, PCMs can significantly contribute to building energy efficiency by shifting thermal demand during peak periods, thus decreasing the energy usage of heating and cooling system while improving indoor thermal comfort for the building's occupants [4]. These materials can be integrated into building envelopes using various techniques, categorized into active and passive methods [5, 6]. Active methods rely on external energy sources, such as mechanical or electrical systems, to control energy storage utilizing PCMs units installed within buildings [7]. In passive strategies, PCMs are integrated within the building's structure by embedding them within construction materials for instance, concrete, gypsum board, plaster, wall panels and underfloor layers [8]. These methods are widely preferred since they do not require external energy sources and require minimal upkeep. Habib et al. [9] investigated the use of PCMs for thermal energy storage (TES) in buildings, analyzing various integration strategies. Their study explored the incorporation of PCMs into walls, floors, ceilings, and ventilation systems, as well as the potential of smart PCM technologies for future advancements in energy-efficient building design. Han et al. [10] examined the effectiveness of bio-based PCMs in reducing energy consumption when integrated into walls, ceilings, and floors. Their study focused on how these materials absorb and release heat, contributing to indoor temperature stabilization. Similarly, Kazanci et al. [11] developed fire-resistant PCMs by incorporating halogen-free flame retardants, such as pentaerythritol and ortho-phosphoric acid, into the microencapsulation process to enhance their safety and durability. Additionally, the impact of PCMs on the thermal behavior of building exterior was examined through experimental testing assessed through a series of thermal cycle experiments [12]. These experiments provided valuable insights into how PCMs influence heat transfer and contribute to improving energy efficiency in buildings. Research findings revealed that placing the PCM layer nearer to the internal environment yields the most effective thermal regulation. Li et al. [13] carried out an experimental investigation Where PCM was integrated into a glazed roof, demonstrating approximately 47.5% energy savings with Achieving cost recovery within 3.3 years. Additionally, an experimental study utilizing a weather simulation system was conducted to test PCM layers in walls showed a significant impact on indoor thermal stability, with a 10°C reduction in reduction in daily variations of indoor air temperature and a 40% reduction in the peak heating demand [14]. Castell et al. [15] evaluated the performance of PCMs in five experimental room’s constructed using standard building techniques. The study was conducted under the specific environmental conditions of a Mediterranean climate, which is characterized by hot, dry summers and mild, wet winters. Their findings revealed a 15% decrease in electrical energy usage due to better thermal regulation and reduced reliance on mechanical cooling. Additionally, the improved energy performance contributed to a decrease in carbon dioxide emissions, estimated between 1 and 1.5 kilograms annually per cubicle, highlighting the environmental benefits of PCM integration in building design. Moreover, Pipes containing encapsulated PCMs in two different diameters at various depths were integrated within building walls to experimentally evaluate their capability in minimizing heat transfer through the building envelope [16]. A reduction in heat flux of 22.5% was observed when the phase change material was positioned near the interior wall surface, while relocating the PCM to the wall’s midpoint resulted in a greater reduction of 36.5%. Furthermore, Experimental and computational studies were conducted to assess the influence of phase change materials (PCMs) on the thermal behavior of building walls and roofs [17].
Conducting experimental studies to integrate PCMs into real building exteriors under real-world climatic conditions presents significant cost and time challenges. As a result, many experimental studies either focus on unrealistic building envelope designs or are limited to specific locations. To overcome these limitations, building simulation platforms such as Energy Plus provide an efficient and accurate way to perform complex and realistic building energy analyses. Energy Plus is a highly recognized and commonly used dynamic simulation tool for building energy analysis, it is known for its ability to model the energy and environmental performance of buildings in detail, offering advanced capabilities for modeling PCMs within building envelopes [18]. Sovetova et al. [19] analyzed how the integration of PCMs influenced the heating and cooling demands in these buildings, and conducted a study to evaluate the impact of PCMs on the energy consumption of residential buildings in eight cities around the world, Using Energy Plus for detailed simulations. Their study analyzed thirteen different PCMs, with the optimal selection leading to reductions in energy consumption ranging from 17% to 34%. Similarly, Alam et al. [20] explored the impacts of five different PCMs on the energy performance of residential buildings in six cities across Australia through numerical simulations conducted in Energy Plus. Their findings demonstrated annual energy savings of 17% to 23% in heating and cooling consumption, highlighting the effectiveness of PCMs in improving building energy efficiency. Lei et al. [21] analyzed the impact of PCMs on cooling load by simulating their integration into building envelopes in the tropical climate of Singapore using Energy Plus. Their findings revealed that incorporating PCMs could achieve a cooling load reduction of 21% to 32%. Similarly, a numerical study conducted in Nanjing, China, Explored the optimal placement of PCMs layers within building walls [22]. The results indicated that positioning the PCM layer near the exterior surface of the wall was the most effective strategy for enhancing thermal performance.
Various optimization methods have been employed by researchers to refine the characteristics of PCMs, including their thickness, placement, and cost, through building simulations. Baniassadi et al. [23] applied an evolutionary optimization technique to determine the optimal phase change material type and its corresponding thickness. when applied to a two-story building simulated in Energy Plus. Additionally, a multi-functional optimization approach was implemented to determine the optimal melting temperatures of PCMs, with the objective of reducing heating and cooling loads in five Iranian cities. The study, which examined five distinct types of bio-based PCMs, highlighted the critical role of melting temperature in PCM performance. The findings demonstrated that a PCM with a melting point of 25°C was most effective in reducing cooling loads, whereas a PCM with a melting point of 21°C was better suited for enhancing heating efficiency. These results underscore examined the potential of integrating PCMs in buildings to substantially lower energy consumption and improve indoor thermal comfort [24].
Numerous factors influence the effectiveness of PCM in achieving energy savings in buildings, with climate conditions being one of the most critical. Thiele et al. [25] conducted an assessment of the potential energy and financial benefits resulting from the integration of phase change materials (PCMs) into single-family residential buildings located in San Francisco and Los Angeles over the course of a year. Auzeby et al. [26] examined the application of PCM to reduce overheating issues in residential buildings in the UK. In France, Omari et al. [27] examined the seasonal performance of PCM boards when incorporated into building walls. Similarly, research in China has gained momentum over the past few years. Cui et al. [28] explored how the positioning of PCMs within a simulated room in Changsha impacts performance, whereas Jin et al. [29] focused on identifying the most effective integration points for PCM layers within wall assemblies in buildings located in Nanjing. Insights drawn from the aforementioned works indicate that is evident that most research focuses on the impact of PCM on energy savings across different climate zones and the influence of its location within building structures. However, fewer studies have explored the detailed effects of PCM parameters and the underlying energy-saving mechanisms, leaving a gap for further investigation.
Although significant research has explored the use of PCMs in building envelopes, key gaps remain. Most studies focus on single locations, limiting understanding of PCM behavior across diverse climatic zones within the same country. Additionally, previous work often investigates multiple or theoretical PCMs rather than assessing the consistent performance of a single commercial PCM across different climates. The optimal placement of PCMs within walls and roofs is also insufficiently evaluated, and only few studies quantify the physical mechanisms that drive energy savings. To address these gaps, the present study evaluates three commercial PCMs across five contrasting Egyptian climates using a unified building model, examines the effects of PCM placement in both walls and roofs, and provides a comparative framework that isolates the influence of climate, PCM type, and layer configuration.
. METHODOLOGY
A detailed 3D model of the base case house is constructed, with specific attention given to the construction details and internal loads, such as lighting, appliances, and HVAC systems. This model is then simulated using Energy Plus, which takes into account the local climate's weather data, ensuring accurate performance evaluation under real conditions. PCM is incorporated into the model, and its impact on energy savings is analyzed by comparing it to the base case. A parametric analysis is conducted to assess various PCM types, including their thickness and placement within the building structure. This analysis helps identify the most effective PCM solutions for different climatic zones. Afterward, dynamic energy simulations for multi zone residential buildings are carried out to assess how PCM integration influences energy consumption and overall efficiency. The results of these simulations provide insights into the potential for reducing energy use while maintaining indoor thermal comfort. A detailed breakdown of the methodology modules, such as building geometry, climate data selection, PCM integration strategies, and energy simulation procedures, is provided in the following sections. This comprehensive approach ensures that all relevant factors are accounted for in determining the best PCM applications for energy efficient building designs.
No experimental runs were performed due to the high cost and complexity of setting up multi-climate testing facilities. Instead, validated simulation tools (Design Builder/Energy Plus) were used, which implement an experimentally verified enthalpy based PCM model. This approach enables accurate assessment of PCM performance across five climatic regions.
. Modeling and construction details
Energy Plus uses three main methods to simulate heat transfer in opaque building elements: the Conduction Transfer Function (CTF), and the advanced heat and moisture transfer algorithm (HAMT). It is aimed to investigate the effect of using PCM on the thermal comfort of a house located in five different cities in Egypt with different weather conditions. To evaluate this impact, the simulated building is a single-story house with a total floor area of 399.7 m². It includes a façade-type structural design, wall height of 3.5 meters, and features a window-to-wall ratio of 40%, allowing for balanced daylight and. A standard door measuring 0.8 × 2 meters is also part of the building envelope. Energy Plus was utilized to assess how integrating phase change materials (PCM) into building components impacts thermal performance and energy efficiency.
This study simulates the energy performance of a typical Egyptian house, focusing on the impact of construction materials and phase change materials (PCMs) to optimize energy use and comfort. Tab. 1 illustrates the thermal properties of the simulated building's envelope elements. The construction layers are presented from the exterior to the interior to reflect the actual exposure conditions. Thermal transmittance (U-value) for each element was determined and compared to the reference limits specified by BCP-2011 where applicable, which forms the basis for the design of the base case house in this study. The thermal and physical properties of all these materials are presented in Tab. 2 and are defined within Open Studio, an open-source software platform designed to work with Energy Plus simulations. This allows for accurate modeling of the building's energy performance.
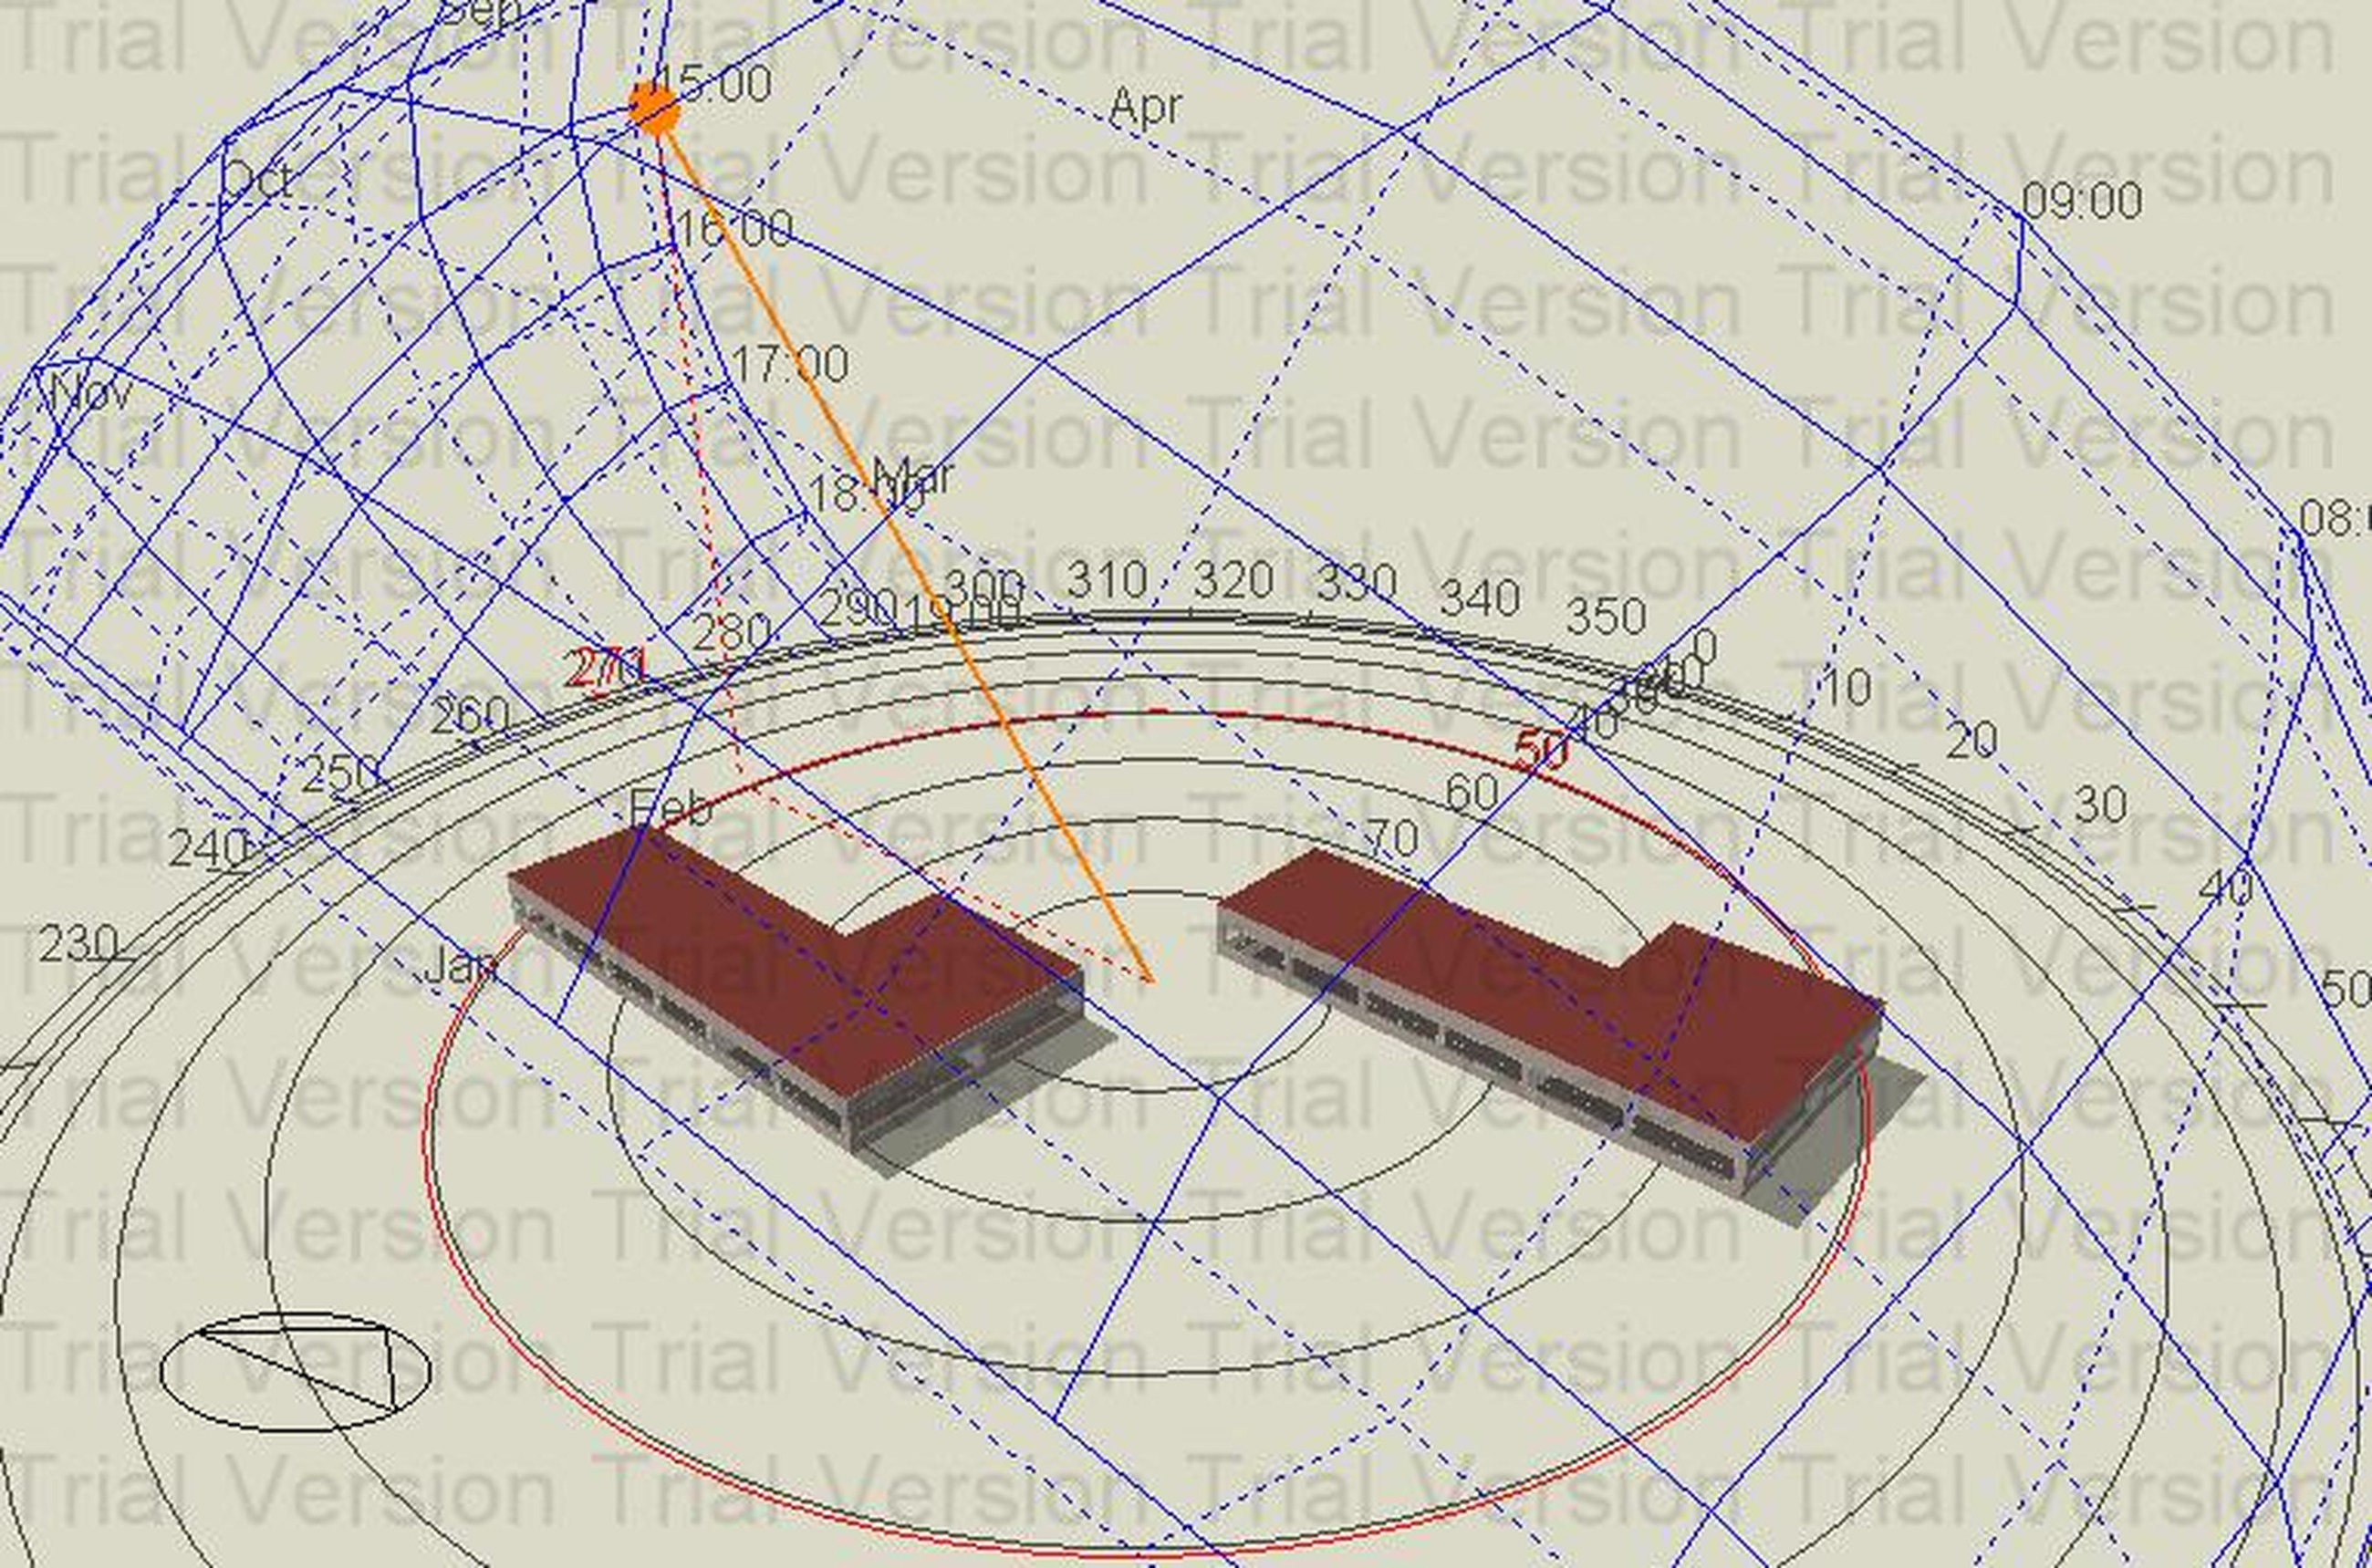
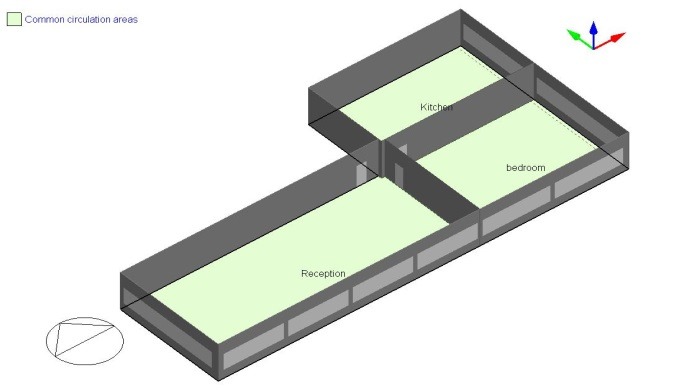
The house is modeled as a one-story, multi-zone structure, providing a clear representation of typical residential construction. The 3D model of the house, designed using Google Sketch Up, as shown in Fig. 1. The floor plan of the house, which includes one bedroom, an attached kitchen, and a reception area, is illustrated in Fig. 2. This layout reflects the typical living space configuration for a residential unit.
Tab. 1.
Construction layers
In terms of construction details, the walls, roof, and floor of the house follow the same specifications as the base case house, as outlined in Tab. 1. These materials and design choices ensure that the simulation results are based on a realistic and representative model of residential housing in Egypt, allowing for accurate analysis of energy performance and the impact of phase change materials (PCMs) on energy efficiency.
Tab. 2.
Physical and thermal properties of construction materials used in the simulation
The material properties presented in this table were adapted and generalized based on the data reported by Khan et al [30], to align with the simulation scenarios of the current study.
. Simulation Configuration and Parameters
The simulation sets PCM properties and uses an ideal HVAC system to regulate indoor temperature. Occupancy, internal loads, and local climate data are also considered to model energy usage. The base case house is modeled with exterior walls and a roof directly exposed to outdoor environmental conditions, while the floor is in contact with the ground. Occupant presence and internal heat gains were incorporated using standard occupancy schedules and ASHRAE-based internal load data, and an air infiltration rate of 0.598 air changes per hour (ACH) is applied, as detailed in Tab. 3. This approach allows the model to reflect typical daily human activities and their contribution to indoor thermal conditions. Although dynamic variations in actual occupant behavior were not explicitly modeled, the applied occupancy profiles provide a reasonable representation of internal heat gains, ensuring realistic simulation of the building’s thermal performance and energy consumption. Future studies could investigate the effects of varying occupant behavior on PCM effectiveness and overall energy savings.
The thermostat set points and operational schedules applied in the simulation, during the occupied periods (7:00 AM to 10:00 PM), the heating system maintains an indoor temperature of 18°C, while the cooling system is set to 25°C to ensure thermal comfort. For unoccupied periods (10:00 PM to 7:00 AM), setback temperatures of 12°C for heating and 28°C for cooling are applied to reduce energy consumption by allowing indoor temperatures to drift within acceptable limits. These control strategies aim to simulate realistic occupant behavior and optimize the building's energy performance under different operational scenarios.
A zone based control schedule is implemented: heating is enabled during winter, cooling during summer, and both systems operate during transitional seasons such as spring and autumn.
Tab. 3.
Internal Heat Gains Parameters and Schedules
For the one story, multi zone configuration, specific schedules for occupants, lighting, and equipment usage across various rooms. Similar to the base case, the HVAC system in this setup also automatically modulates airflow to achieve the required thermal balance and maintain target indoor conditions throughout the building.
. Climates in the studied five cities of Egypt
This study focuses exclusively on Egyptian climatic zones because the objective is to evaluate PCM performance under the country’s diverse climates using a single, unified building model. Egypt’s five distinct climates provide sufficient temperature and humidity variation to assess the behavior of M91/Q23 PCM without altering building configuration or occupancy patterns. Expanding the model outside Egypt would introduce unnecessary variables and reduce the ability to isolate climate effects. Future studies may extend this analysis to international climates.
Egypt is situated between latitudes 22° and 32° north of the equator and longitudes 24° and 37° east of the Greenwich Meridian. The Köppen-Geiger climate classification system, which divides climates into five primary groups based on temperature and rainfall patterns, is used in this study to categorize the climates of the selected cities.
2.3.1 Temperate climate
Ismailia is located in northeastern Egypt, near the midpoint of the Suez Canal, and on the northwestern shore of Lake Timsah. The Ismailia region extends between latitude 30 degrees north and longitude 32 degrees east. It has a cold winter climate that tends to be warm for long periods and is transitional and variable with light rain. The summer is moderate and tends to be humid.
Humid subtropical climate
Alexandria is up on the north Mediterranean coastline, with more pleasant temperatures and High rainfall, although slightly wetter than inland Egypt. Sea breezes make it more comfortable than the south.
Warm semi-arid climate
Assiut occupies the southwestern region of Egypt. It is situated between latitudes 22°00' and 32°03' north, and longitudes 25°00' and 32°03' east. The climate is characterized by high temperatures during summer to their maximum limits and much lower in winter. North winds prevail in most parts. It is characterized by relative dryness, and the rainfall rate ranges between 0.01 and 16.2 mm/y.
Hot semi-arid climate
Aswan has a hot desert climate, being the hottest in Egypt in summer. Humidity rises no higher than 42% in winter. Winter is short and warm. Rainfall is less than 1 mm in an entire year, and some years with no rainfall.
Cold semi-arid climate
Saint Catherine (south Sinai) is located in the heart of South Sinai on a plateau 1600 meters above sea level in a mountainous area. The weather is always cold due to its height above sea level, as temperatures drop at night to about 10.5 0C, and drops below zero with snow fall in winter.
. Common insulation materials
This study aims to assess the energy-saving potential of phase change materials (PCMs) by comparing their effectiveness with that of four commonly used conventional insulation types, as recommended by building codes for modern residential buildings. The thermal properties of the selected insulation materials, including thermal conductivity, density, specific heat capacity, and melting point, are provided in Tab. 4. These properties are critical in determining the insulation’s effectiveness in reducing heat transfer through building envelopes, thus contributing to energy conservation in residential buildings. The analysis considers various factors such as the material’s performance in different climate conditions, its impact on heating and cooling loads, and its ability to optimize building energy consumption throughout the year.
Tab. 4.
Outlines the key properties of the insulation materials
. Phase change materials
From a thermodynamic point of view, phase change materials absorb or release thermal energy or heat due to the change in entropy. This part of the heat corresponds to the material's unit mass and is referred to as its latent heat. The material absorbs latent heat during melting, and releases it during freezing. When the solid material is heated to its melting temperature, the molecules begin to absorb thermal energy. This energy facilitates the disruption of molecular bonds or reduces the attractive forces between atoms, allowing the molecules to move more freely. The temperature remains constant during the melting process until it is complete and turns into a liquid state. When the liquid material is cooled to its freezing temperature, the molecules begin to lose the thermal energy stored in the material to the surrounding environment. As energy is lost, the molecules return to form strong bonds or enhance the attractive forces between atoms while the temperature remains constant until the process is complete and they return to their solid state. Among the factors affecting the transformation process are temperature, environmental pressure, material composition and the presence of impurities. Tab. 5 presents the thermos physical properties of the selected PCMs.
In ideal phase change materials, the melting and freezing points are often equal or very close. This is due to the thermodynamic nature of the material. Among the reasons for this are: (1) the dynamic equilibrium between the two phases, i.e. the transition process between the solid and liquid phases occurs at the same temperature under balanced conditions (such as constant atmospheric pressure), (2) the purity of the material, as the temperature of the phase transition is approximately constant, because all molecules behave in the same way, and (3) the isothermal nature of thermal change, i.e. during melting, energy is absorbed to convert the material from solid to liquid and during freezing, the same amount of energy is released to convert the material back to solid. The advantages of this are to enhance the performance of the material in thermal applications. It ensures efficient energy storage and release, high thermal stability, and long life of the material without deterioration in properties.
Among the properties and thermal advantages of PCM are high thermal energy storage capacity, constant phase transition temperature, variety of temperature range and thermal stability. Among the environmental advantages are reduced energy consumption, reduced carbon emissions, environmental friendliness and long-term economics. To choose the best material for a specific application, there are several properties that must be taken into consideration based on the required use. These are: the freezing and melting temperatures must be near to the temperature required in the application, accelerate heat transfer during charging and discharging, and the ability of the material to maintain its properties after many melting and freezing cycles. It is preferable to use materials with high density and high heat capacity, and to be easy to package to avoid leakage.
Tab. 5.
Thermophysical Properties of Phase Change Materials (PCMs)
. Methodology and plan of study
In this study, Design Builder (user-friendly building energy simulation software) was used to assess the energy consumption of a residential structure consisting of three rooms. The tool enables detailed analysis by combining Energy Plus as its simulation engine with a graphical interface to model and evaluate building performance under various conditions. The plan of work contains: (1) An overview of strategies for optimizing building envelopes with PCMs across the five selected cities, (2) reviewing the different types of PCMs and how to choose the best type with the best thickness based on their physical properties, (3) study the placement of PCMs within building envelopes with and without insulation materials, and (4) comparison of results with published research.
. Mathematical modeling
The rate of temperature change through building materials can be described using Fourier’s law of heat conduction, which states that the heat flux is proportional to the negative gradient of temperature and the material’s thermal conductivity. Mathematically, it is expressed as:
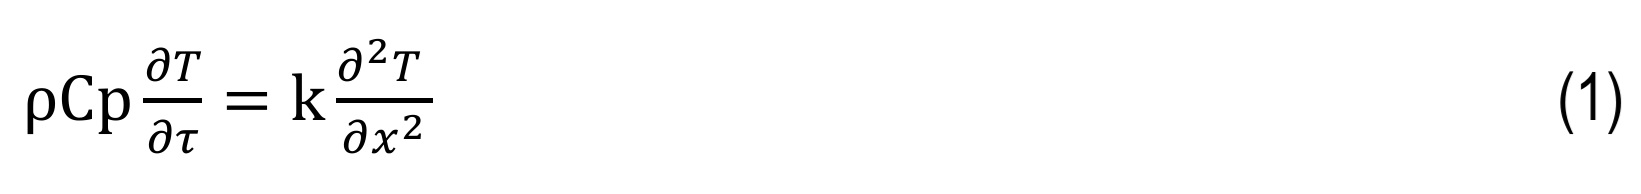
where: (∂T)/(∂τ) is represents the rate of temperature change over time, (∂2T )/(∂x2) is denotes the spatial temperature gradient, and ρ, Cp, k are the material’s density (kg/m³), specific heat capacity (J/kg·K) and thermal conductivity (W/m·K) of the element material, respectively (W )/(m3).
In the Conduction Finite Difference (CondFD) model, building elements are divided into discrete layers or nodes, and heat transfer is simulated by solving the transient conduction equation at each node. This method accounts for the material’s thermal properties, boundary conditions, and any internal heat sources or sinks. It is particularly effective for modeling complex shapes and layered assemblies. A key advantage is its ability to provide detailed temperature profiles, aiding in moisture risk assessment and thermal performance optimization for improved energy efficiency.
The study applies the one-dimensional finite difference conductivity (CondFD) algorithm in Energy Plus to model heat transfer in building components with phase change materials (PCM). It employs the fully implicit scheme, which applies the Adams-Moulton method for stable and accurate time-dependent heat transfer simulations within building component as given by
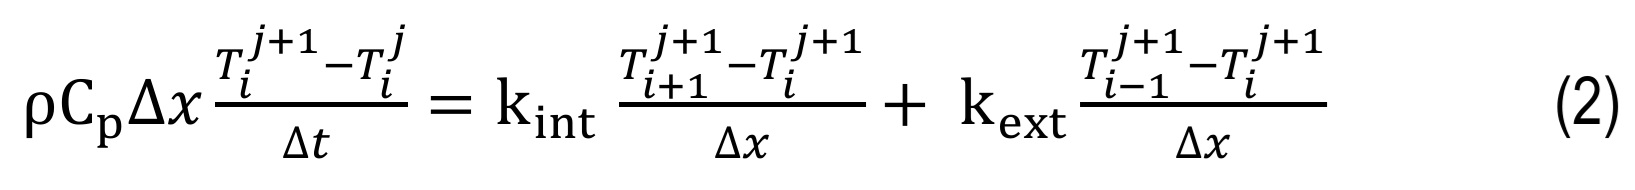
In this model, ρ is the material density, Cp is the specific heat capacity, k is thermal conductivity, T is the node temperature, and ∆t represents the time step. The spatial thickness between finite-difference nodes is denoted by x. The time indices j+1 and j correspond to the current and previous time steps, respectively, while i, i-1, and i+1 represent the current, inner, and outer nodes. This formulation calculates heat transfer across building elements using numerical methods. ((W )/(m2))
In the CondFD algorithm, the heat transfer equation is discretized, which is expressed as a Fourier number function (F_0). This function plays a key role in the numerical solution, helping to calculate the heat transfer and temperature variations within building components over time, including PCM. By utilizing this Fourier number, the algorithm effectively approximates heat conduction, accounting for both spatial and temporal changes in the material's properties.
In the CondFD algorithm, layer thickness (∆x) depends on the Fourier number (F0), thermal diffusivity (α), time step (∆t), and spatial dispersion constant (c).
In Energy Plus, the relationship between the enthalpy (h) and thermal conductivity (k) of Phase Change Materials (PCM) is governed by temperature, where these properties change dynamically with temperature variations during the phase change process.
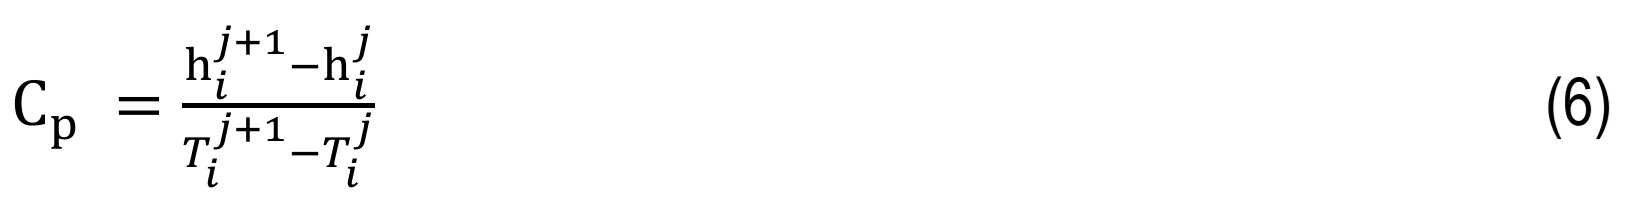
The CondFD algorithm in Energy Plus calculates PCM’s specific heat capacity over time using an enthalpy-temperature function. This function updates each node's enthalpy in iterations, which is crucial for accurately modeling PCM behavior. Properly defining this function ensures precise predictions of building component performance, particularly for optimizing thermal efficiency and energy usage in buildings. ((J )/(kg . K))
. VALIDATION OF THE NUMERICAL METHODOLOGY
To verify the accuracy of the present simulation approach, a comparison was made with the numerical results reported by Ji et al. [1]. In their study, the annual energy use of a simplified, windowless concrete test cabin (3 × 3 × 2.8 m) in Guangzhou, China, was simulated using Energy Plus and IWEC weather data. Internal heat sources such as occupants, lighting, and equipment were intentionally excluded to isolate the thermal behavior of the envelope. Three models were assessed: Model A# (benchmark) featured 150 mm thick concrete walls, roof, and floor; Model B# introduced a solid PCM layer (10 mm) on the external surfaces of walls and roof; and Model C# used an idealized PCM layer in the same locations. The floor temperature was fixed at 18 °C, while the remaining surfaces interacted with outdoor conditions. The current numerical approach replicated these models under identical boundary and environmental conditions to validate its predictive capability.
Fig. 3 presents the outcomes of the dynamic energy simulations conducted in this study. A notable reduction in annual energy consumption was observed in Models B and C following PCM integration, with values dropping from 728.25 MJ/m² to 638.69 MJ/m² and 576.5 MJ/m², respectively, as detailed in Tab. 6. The simulation results closely align with those reported by Ji et al., with a deviation of less than 2%, confirming the reliability of the present model.
Tab. 6.
Comparison between present annual energy consumption and that of Ji et al. [1]
| Annual energy consumption (MJ/m 2 ) | ||
|---|---|---|
| Model number | Ji et al. | Present |
| #A | 713.75 | 728.25 |
| #B | 625.98 | 638.69 |
| #C | 564.17 | 576.5 |
In this study, a mesh size analysis and mesh independence test were conducted to ensure the accuracy simulations. The different grid sizes are presented in Tab. 7. The objective was to determine whether further mesh refinement would significantly affect the results, thereby optimizing computational resources without compromising accuracy.
Tab. 7.
Different grid Sizes
| Mesh Size | Element Width (m) | Element Height (m) | Expected Effect |
|---|---|---|---|
| Coarse Mesh | 1.0 | 1.0 | Faster but less accurate |
| Medium Mesh | 0.5 | 0.5 | More accurate, moderate time |
| Fine Mesh | 0.25 | 0.25 | Very accurate, longer time |
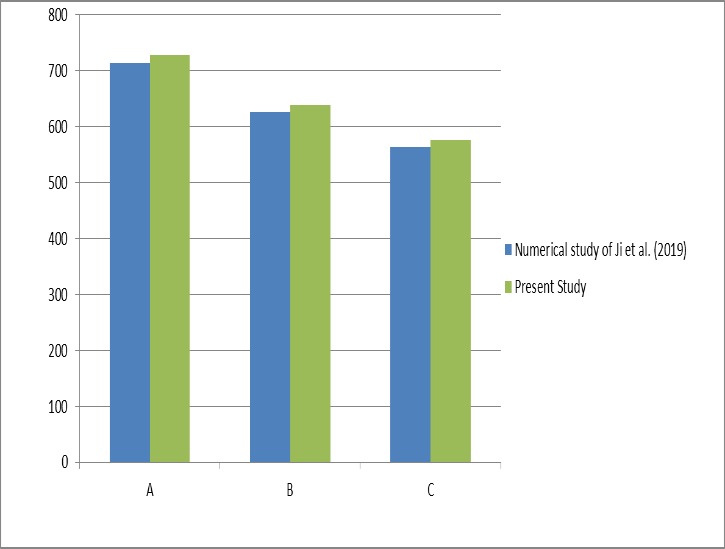
Fig. 3. Comparison of annual energy consumption between the current study and the findings of Ji et al.
The study monitored key parameters, including residuals of mass, X-velocity, and temperature, alongside temperature values at a fixed central location. The simulations were run until convergence was achieved, ensuring stable residual values close to zero. The results indicated that for both mesh sizes, the mass, velocity, and temperature residuals fully converged after 2000 iterations, confirming numerical stability. Additionally, the recorded temperature values at the center of the computational domain were 19.080 °C for the 1 m grid, 19.096 °C for the 0.5 m grid and 19.103 °C for the 0.25 m grid. The final temperature difference between the 0.5 m and 0.25 m grids is negligible (~0.0366%), confirming mesh independence, which suggests that refining the mesh further does not significantly change the results and supports the selection of the 0.5 m grid as the optimal mesh resolution. This relative error is calculated using equation (7) in which ∅_medium is the value from 0.5m grid and ∅_fine is from 0.25m grid.

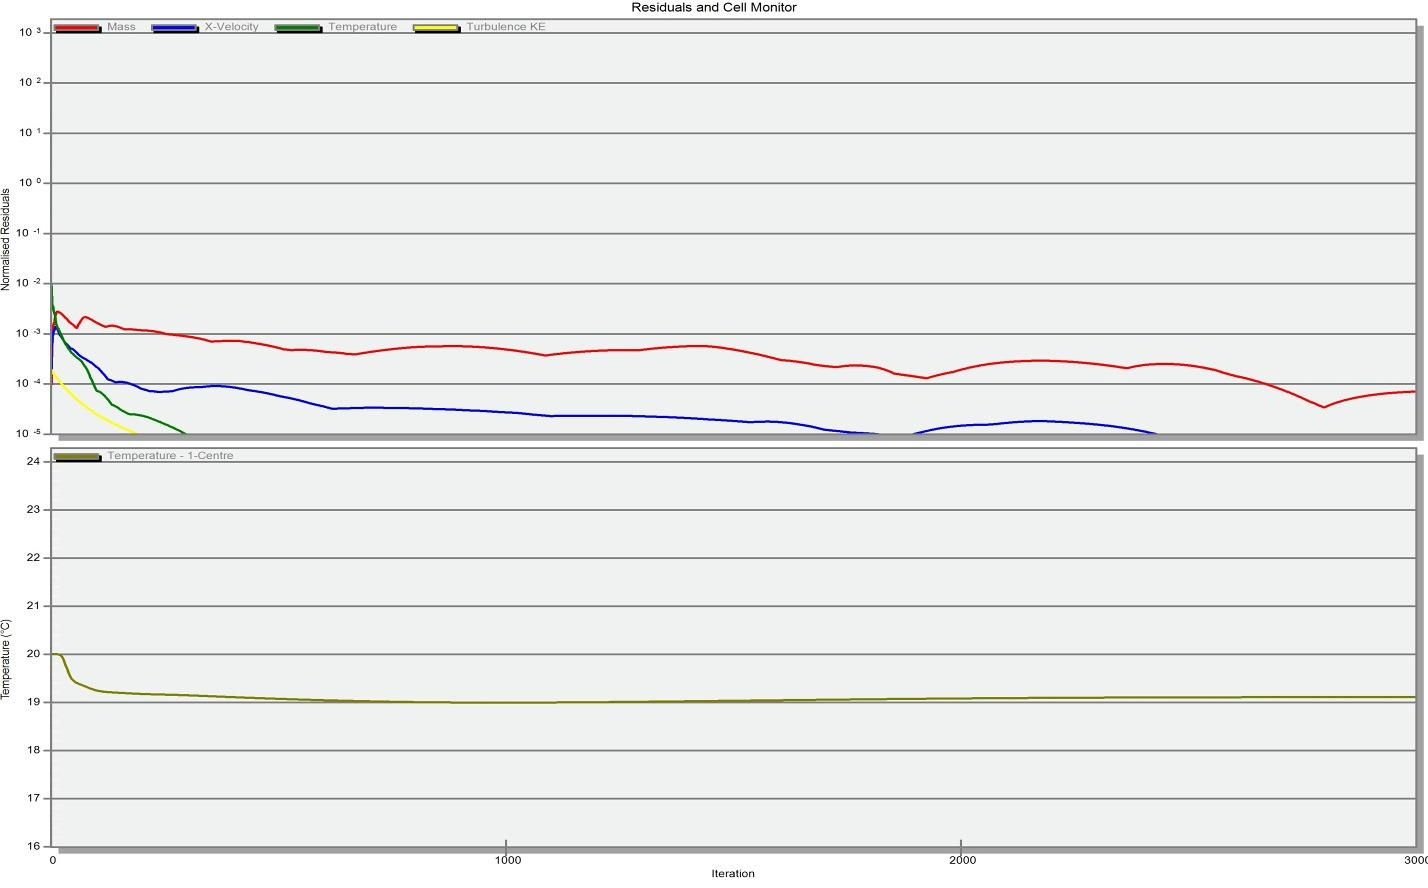
The Residual graphs presented in Fig. 4 illustrate the convergence behavior of residuals and temperature stabilization across different mesh sizes (1.0, 0.5, and 0.25 m). It provides insight into the numerical stability and accuracy of the simulations. The residuals graphs show how different residuals (mass, velocity, and temperature) decrease over iterations, indicating the convergence of the solution. The temperature at center vs. iterations graph tracks the temperature at a specific point in the domain over iterations, showing how the solution stabilizes over time.
For the 1.0 m grid as shown in Fig. 4a, the residuals initially decrease but stabilize at relatively higher values compared to finer meshes, and some fluctuations are present, indicating that the solution has not fully converged, while the mass and velocity residuals do not approach near-zero as efficiently as in finer grids. The temperature fluctuates more before stabilizing, and the final stabilized temperature is different from the finer grids, indicating that the coarse grid lacks accuracy.
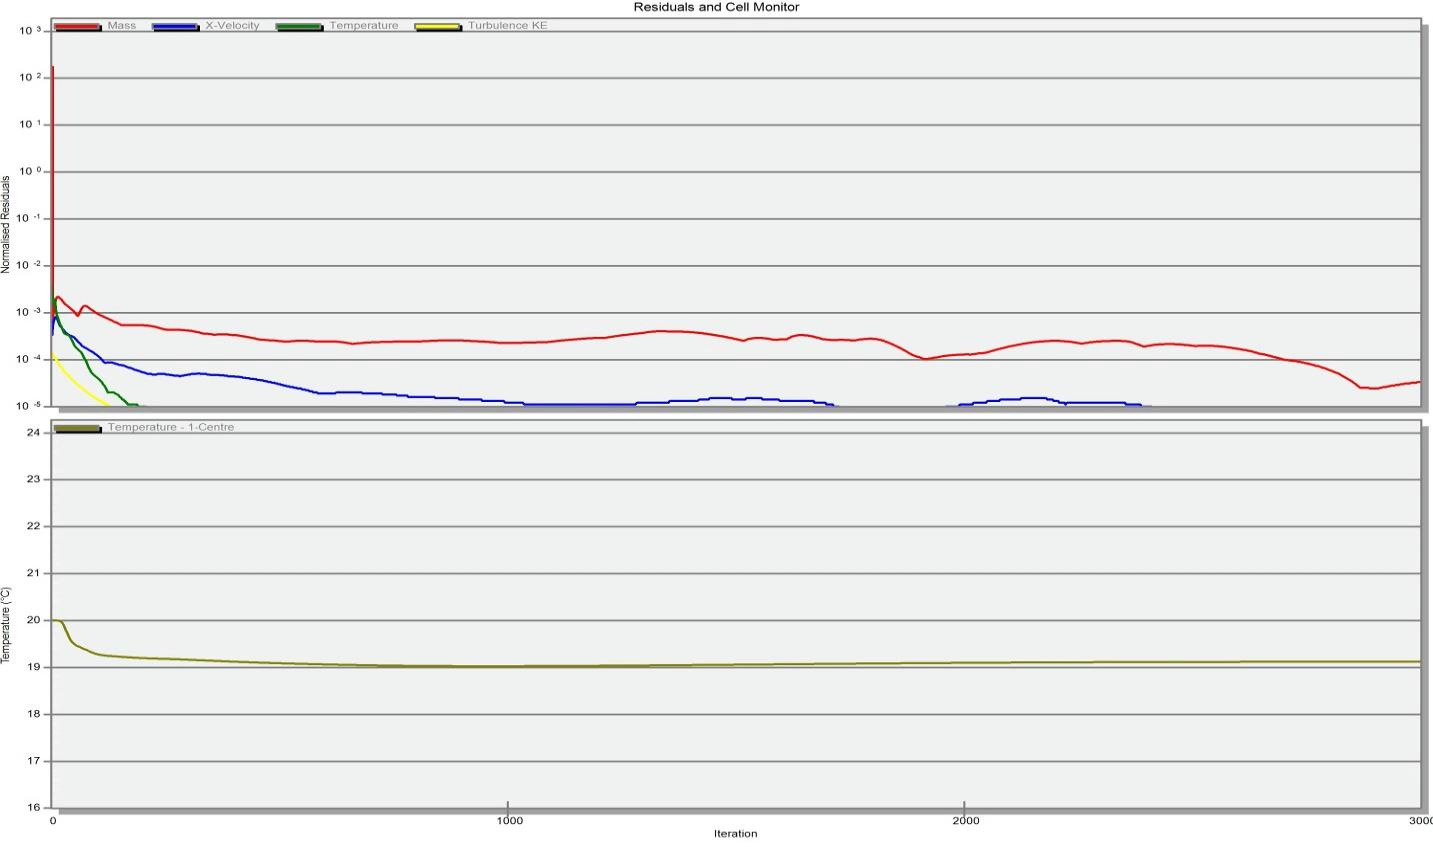
The 0.5 m grid in Fig. 4b demonstrates a faster decrease in residuals and reaches lower values compared to the 1.0 m grid, showing improved convergence stability with reduced oscillations, meaning the results are more reliable. The temperature stabilizes faster and reaches a final value closer to the 0.25 m grid, demonstrating improved accuracy.
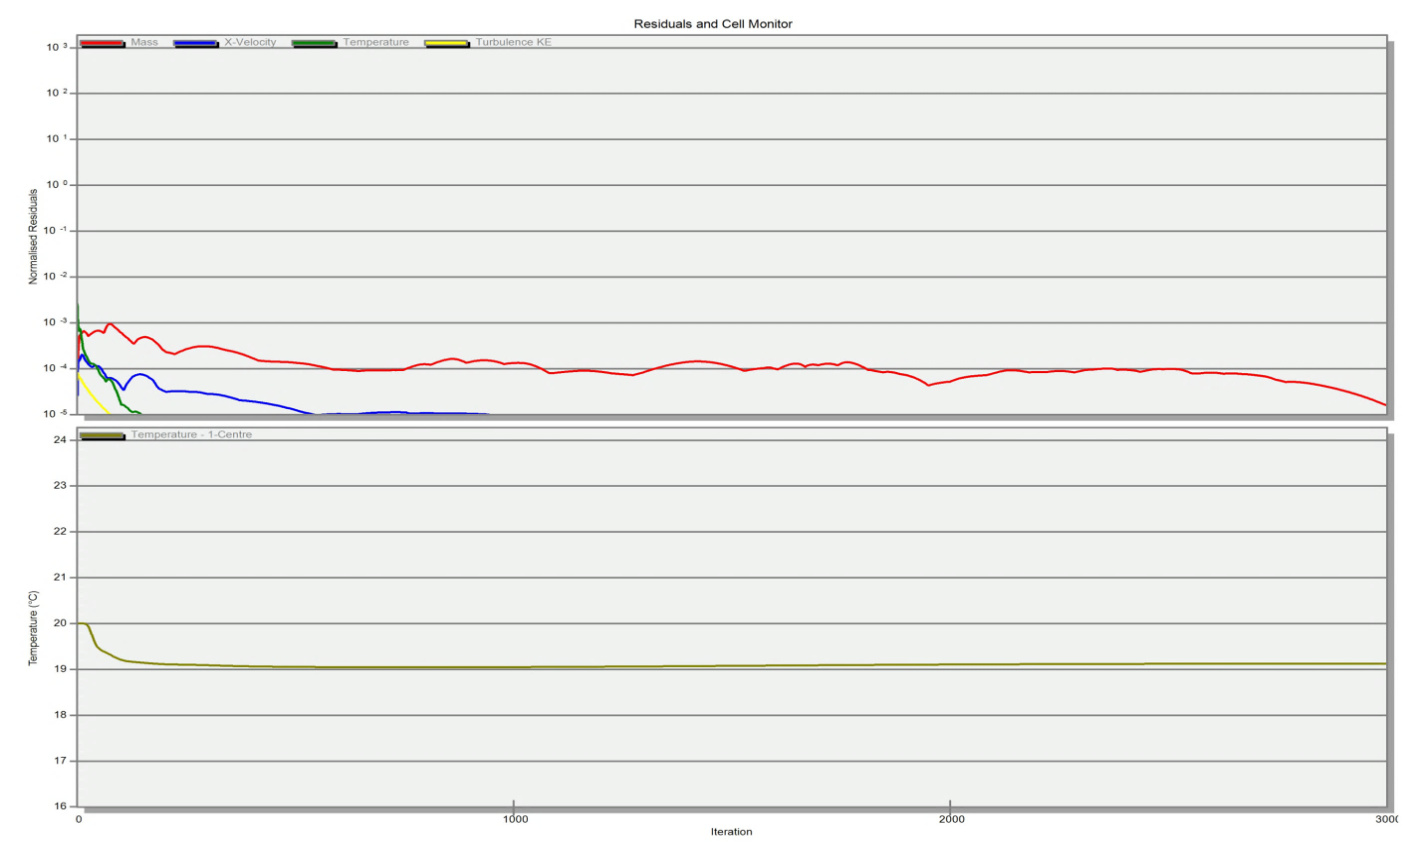
The 0.25 m grid in Fig. 4c follows a similar trend as the 0.5 m grid but with marginal improvements, as the mass, velocity, and temperature residuals reach near-zero values, confirming strong convergence, and since the 0.5 m and 0.25 m grids produce nearly identical convergence behavior, it confirms that the solution has reached mesh independence at 0.5 m.
. RESULTS AND DISCUSSION
. Impact of PCM Incorporation on Energy Performance
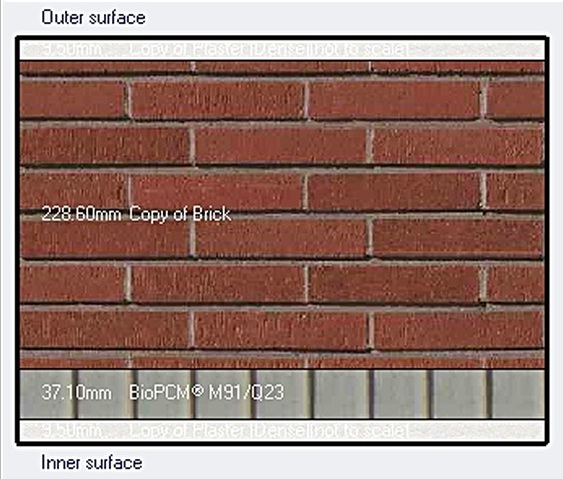
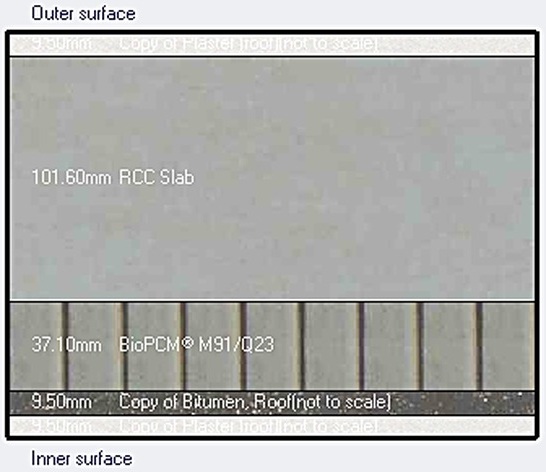
A 37 mm layer of PCM M91/Q23 was applied to the interior sur-faces of the walls and roof in the base case house. In walls, PCM is placed between the brick masonry and internal plaster as shown in Fig. 5. In the roof, PCM is located beneath the reinforced concrete slab and above the internal plaster, with a bitumen layer included for moisture protection as shown in Fig. 6. Intermediate floor ceilings follow the same internal configuration. These descriptions and figures clarify the exact PCM placement in all building elements. Energy Plus simulations, conducted for five cities, revealed a reduction in annual heating and cooling energy consumption in all cases as presented in Tab. 8. Among the cities, Aswan recorded the highest energy use at 230.56 kWh/m² annually, while Alexandria had the lowest at 132.93 kWh/m². Ismailia, Assiut, and Saint Catherine showed energy consumptions of 171.63, 191.53, and 166.20 kWh/m² respectively. Incorporating PCM led to energy savings of 15.68% in Ismailia, 16% in Alexandria, 17.55% in Assiut, 14.8% in Aswan, and 16.28% in Saint Catherine, as calculated using equation (8).

The results indicate that PCM contributed to reducing energy consumption by 14.8% to 17.55%, demonstrating its positive impact on improving building energy efficiency. However, PCM efficiency varies with climate, necessitating the selection of PCM materials with appropriate melting points for each region to achieve optimal performance. The highest energy savings were observed in Assiut (17.55%), this is because it is located in a semi-desert climate, in areas where there are large differences between day time and night time temperatures, phase change materials work more efficiently by storing thermal energy during the day by absorbing heat and releasing it at night. And the lowest energy savings were in Aswan (14.8%), where extremely high temperatures may cause PCM to saturate quickly, reducing its effectiveness. Alexandria and Saint Catherine showed similar savings (~16%), with Alexandria benefiting from moderate temperature fluctuations and high humidity, which makes PCM effective but not as much as desert areas. and St. Catherine has a relatively cool climate, which helps PCM achieve good heating savings.
Tab. 8.
Effect of PCM (M91/Q23) on reducing annual energy consumption (Without insulation)
. Optimal PCM selection
Bio PCMs offer a broad range of melting points that contribute to indoor comfort and energy efficiency. To optimize human comfort, a melting range of 20-25 °C is ideal. They are non-toxic, recyclable, and compatible with other building materials. However, challenges such as low thermal conductivity and flammability remain. Despite these drawbacks, Bio PCMs present a promising solution for sustainable and energy efficient building design.
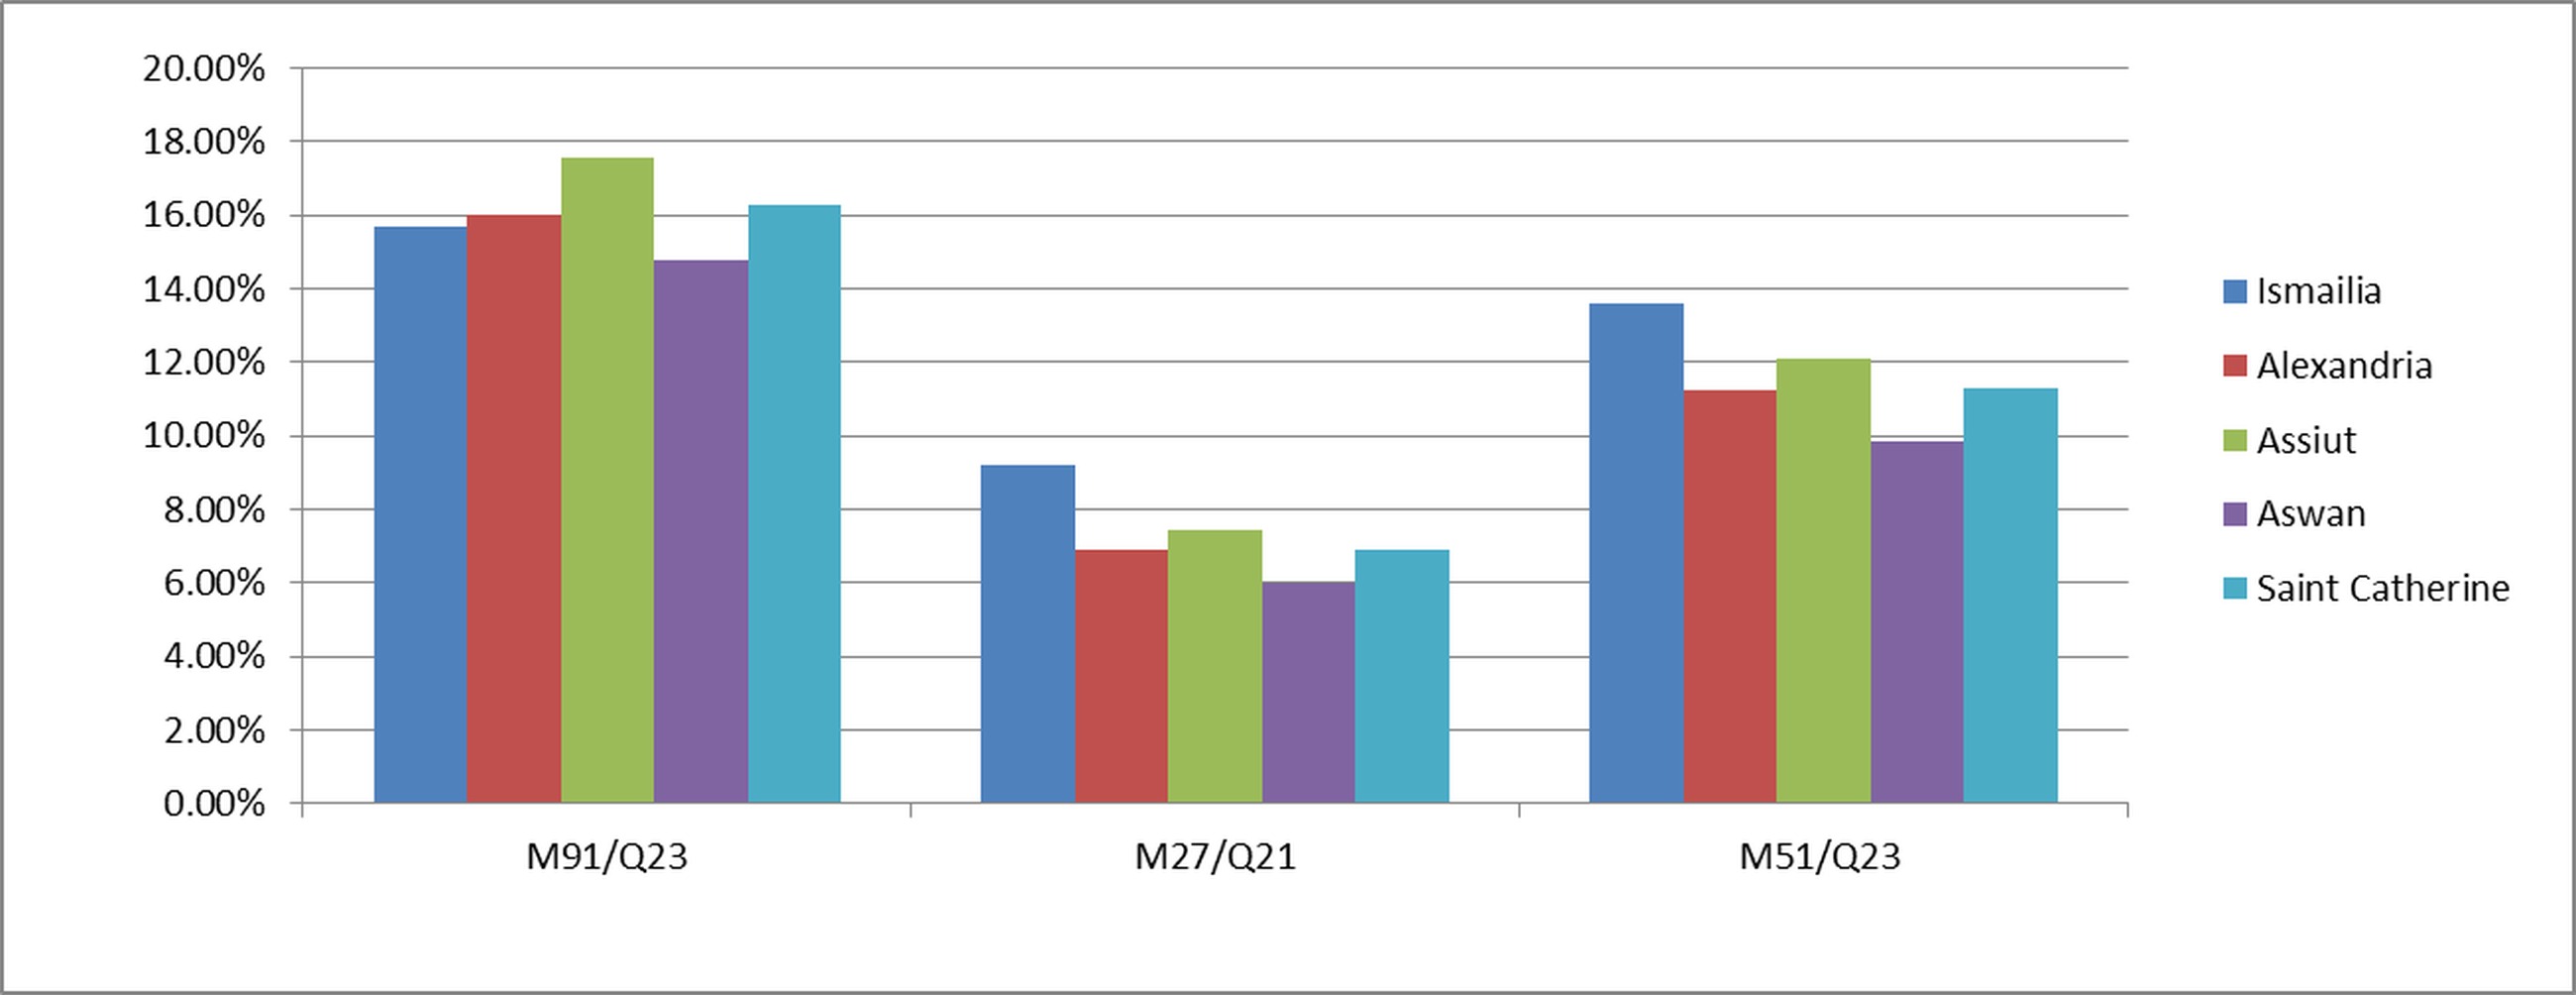
To evaluate the performance of different PCMs, dynamic simulations were conducted by integrating three types of PCM into the internal surfaces of the base case house across five cities. Results in Fig. 7 show that all PCMs achieved annual energy savings ranging from 5% to 19%. M91/Q23 exhibited the highest savings, with reductions of 17.55% in Assiut, 16.28% in Saint Catherine, 16% in Alexandria, 15.68% in Ismailia, and 14.8% in Aswan. In contrast, M27/Q21 resulted in the lowest savings, between 5% and 9% across all climates as presented in the Tab. 9. M51/Q23 showed moderate reductions, from 9.85% to 13.58%, depending on location as presented in the Tab. 10. The data also indicate that PCMs with melting points at or above 24°C are more effective, likely due to better alignment with indoor cooling set temperatures.
Tab. 9.
Effect of PCM (M27/Q21) on reducing annual energy consumption (Without insulation)
Tab. 10.
Effect of PCM (M51/Q23) on reducing annual energy consumption (Without insulation)
Among the tested bio based PCMs, M91/Q23 and M51/Q23 demonstrated the highest reductions in annual energy consumption. However, M91/Q23 showed the most consistent performance across all selected cities as presented in Tab. 8, making it the optimal choice. The PCM type (M91/Q23) was selected due to its melting temperature (~23°C), which aligns with indoor thermal comfort ranges in Egyptian residential buildings. The material provides high latent heat capacity, stable thermal conductivity, and strong cycling performance under hot climatic conditions. Its commercial availability and compatibility with wall and roof construction materials further justified its selection for this study.
. Comparison between PCM and Conventional Insulation
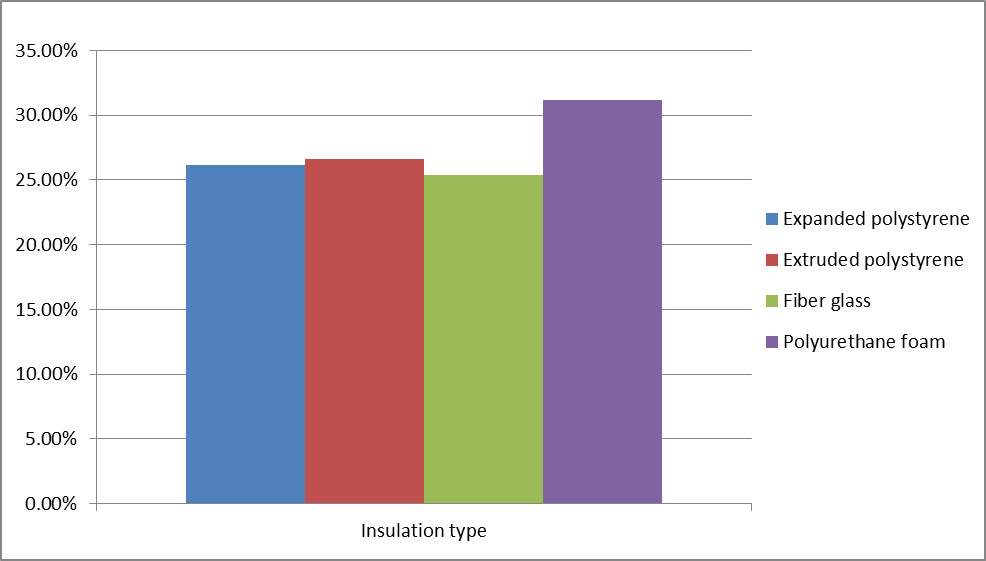
The energy consumption reductions of various insulation types were evaluated through dynamic energy simulations. Among the four options, polyurethane foam demonstrated the highest reduction in annual energy consumption at 31.19% presented in Fig. 8, followed by fiberglass results in a 25.38% reduction as shown in Tab. 11. Polyurethane foam was chosen as the optimal insulation for comparison with the PCM layer. The performance of M91/Q23 PCM was then simulated, using the same thickness as expanded polystyrene insulation for comparison.
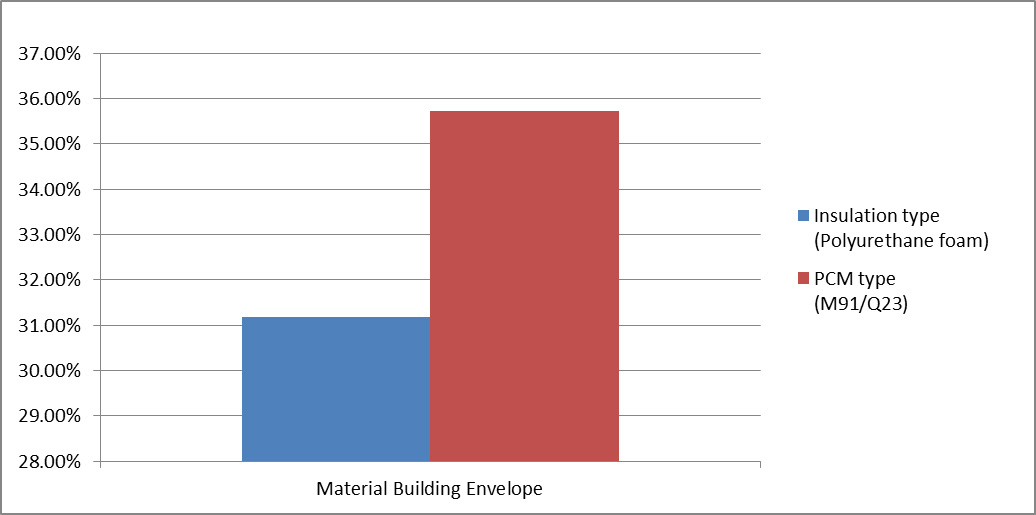
The reduction in yearly heating and cooling energy use was evaluated by comparing the base model to versions incorporating either optimal PCM or insulation. The results indicate a 36% reduction with PCM and a 31% reduction with polyurethane foam as shown in Fig. 9. Although PCM offers a 5% greater saving, it achieves this with less material volume. Additionally, PCM performance can be further optimized through better placement and appropriate thickness selection.
Tab. 11.
Comparison of annual energy consumption of insulation types
. Impact of Climatic Conditions on PCM Integration
To investigate the effect of Phase Change Materials (PCMs) on energy performance, simulations were conducted for residential buildings in five representative Egyptian cities with different climatic conditions. A 37 mm layer of M91/Q23 PCM was applied to the internal surfaces of the walls and roof. The aim is to assess how PCM integration influences both heating and cooling energy consumption across varying climates, and to quantify the potential energy savings. The following sections present the simulation results for each city, highlighting the impact of PCMs on reducing energy demands.
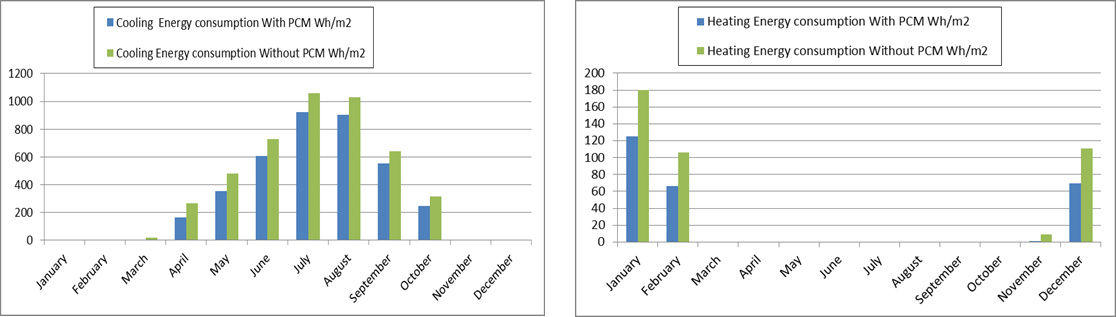
The dynamic simulation results for Ismailia show a clear reduction in energy use after PCM integration. Cooling demand in July decreased from 1058.89 Wh/m² to 923.28 Wh/m², and heating demand in January dropped from 180.15 Wh/m² to 125.55 Wh/m². Overall, the monthly energy use declined from 14.3 to 12kWh/m², corresponding to a total energy saving of 15.68%, as shown in Fig. 10a.
A simulation was conducted for Alexandria to assess the impact of PCM on energy consumption. The results showed in Fig. 10b a notable reduction in total building energy use throughout the year. In February, the highest heating energy consumption was 142.8241 Wh/m², which decreased to 100.0663 Wh/m² with the integration of PCM, resulting in a 30% energy saving, while cooling energy consumption in August was reduced by 12%. Although heating requirements slightly increased in January and February, the overall energy consumption decreased from 11kWh/m² to 9.3kWh/m², resulting in an average energy saving of 16%.
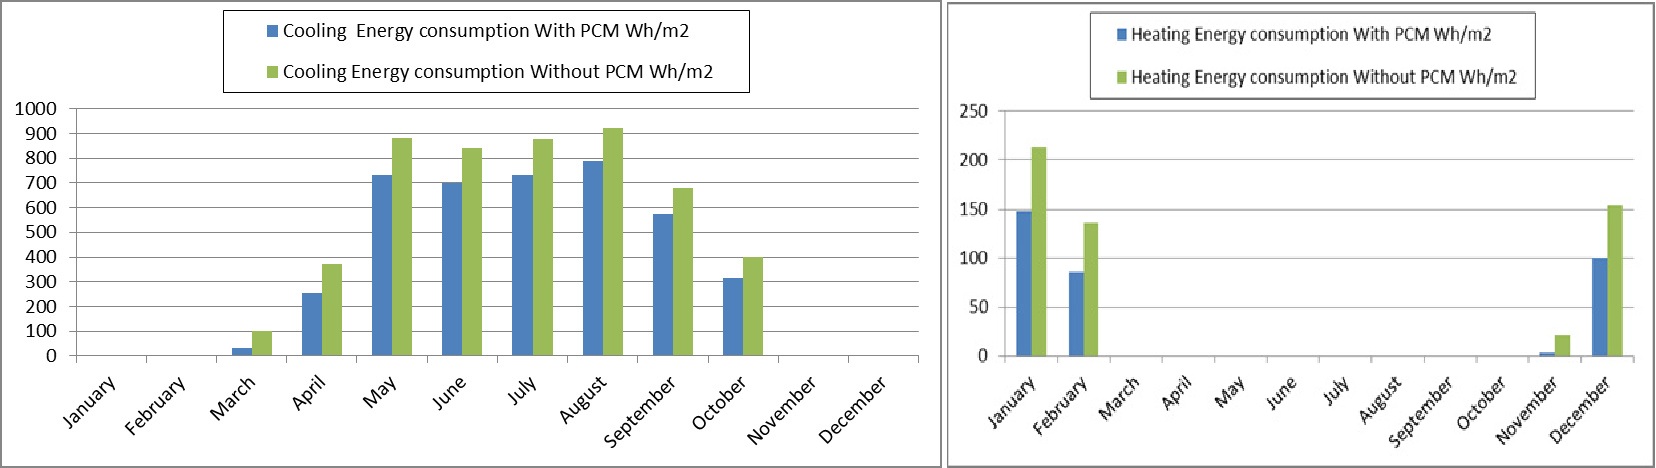
The simulation results for Assiut demonstrate a consistent reduction in heating and cooling energy demands throughout the year with the integration of PCM M91/Q23 as shown in Fig. 10c. Cooling energy notably decreased in peak summer months in August from 924.4266 Wh/m² to 786.9055 Wh/m² when PCM is installed and heating demand also dropped from 213.4894 Wh/m² to 147.9765 Wh/m² despite the city's warm climate. Overall, the average monthly energy consumption declined from 15.9 kWh/m² to 13.15 kWh/m², resulting in a 17.5% energy saving.
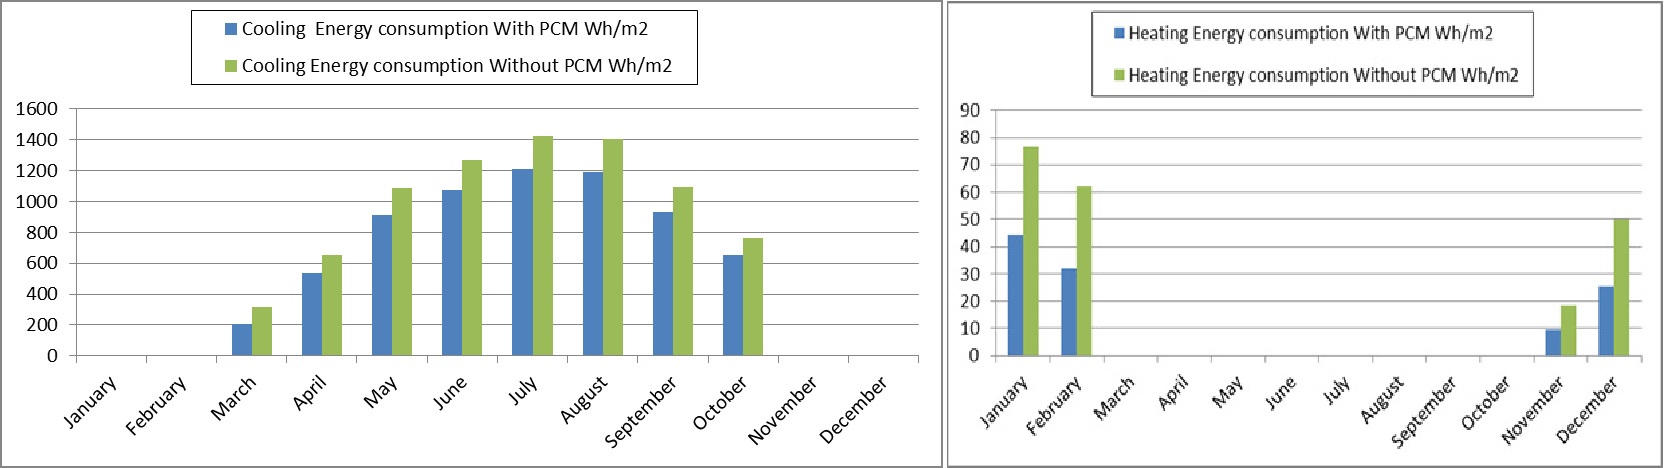
The results in Aswan indicate a reduction in overall energy consumption for both heating and cooling. Cooling energy consumption is reduced by 15% in July as indicated in Fig. 10d, and in Assiut, heating energy consumption decreases by 30% in January with PCM integration. Additionally, in Ismailia, the average monthly energy use drops from 14.5kWh/m² to 12kWh/m², resulting in an annual energy saving of 15.68%.
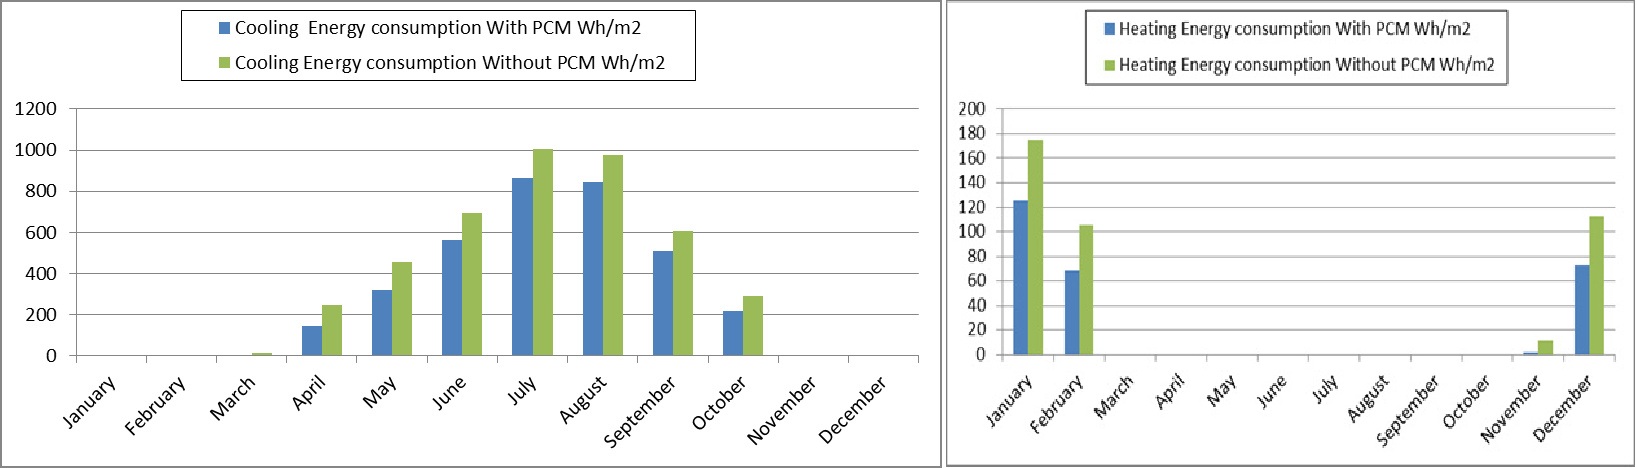
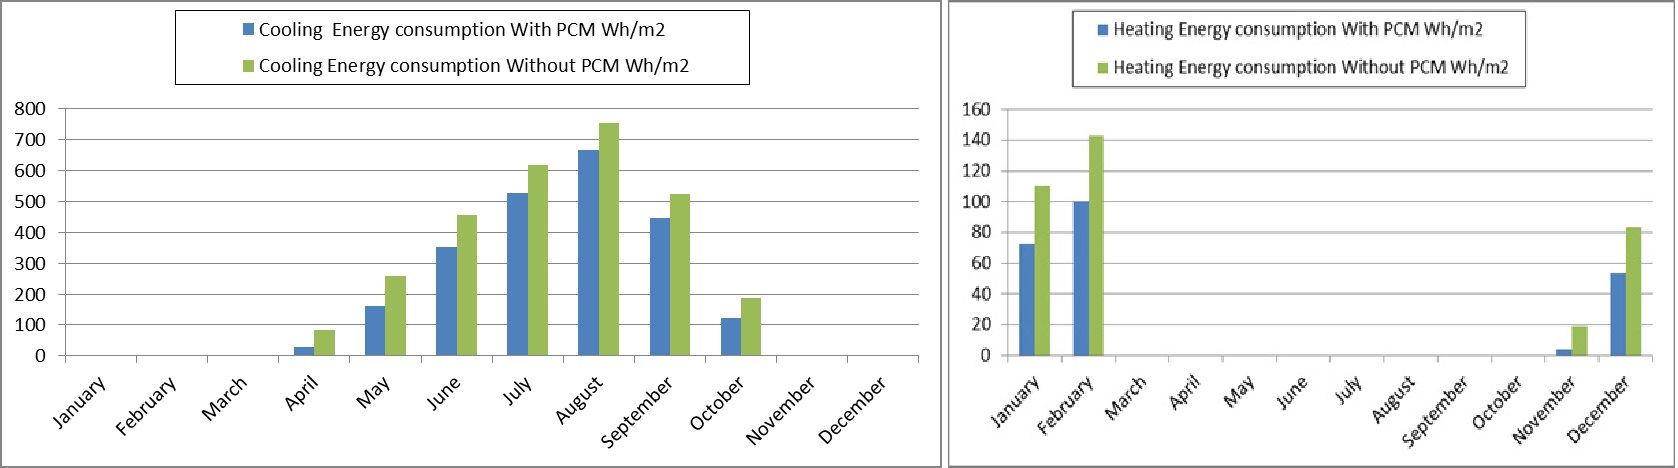
The simulation for South Sinai, which experiences a colder climate among the five selected cities, shows that incorporating PCM leads to notable energy savings. Heating energy demand in December and January is reduced by 39.3 Wh/m² and 49 Wh/m² respectively, while cooling energy consumption in July drops by 141.7 Wh/m² as shown in Fig. 10e. Overall, the average monthly energy use decreases from 13.85kWh/m² to 11.595kWh/m², resulting in a 16.28% reduction in energy consumption.
. Impact of PCM Placement on Energy Performance
To evaluate how the positioning of PCMs within building envelopes affects energy performance, various installation scenarios were tested in the base case house. The PCM layers were strategically placed at different depths within the wall and roof assemblies to determine their impact on annual energy savings and identify the most effective configuration. Four wall setups were simulated: in Wall A, PCM was installed on the innermost layer; in Wall B, it followed the plaster layer; in Wall C, it was positioned after the brick layer; and in Wall D, it was placed on the exterior surface, as illustrated in Fig. 11(a). Each configuration was analyzed using dynamic energy simulations to assess energy reduction potential.
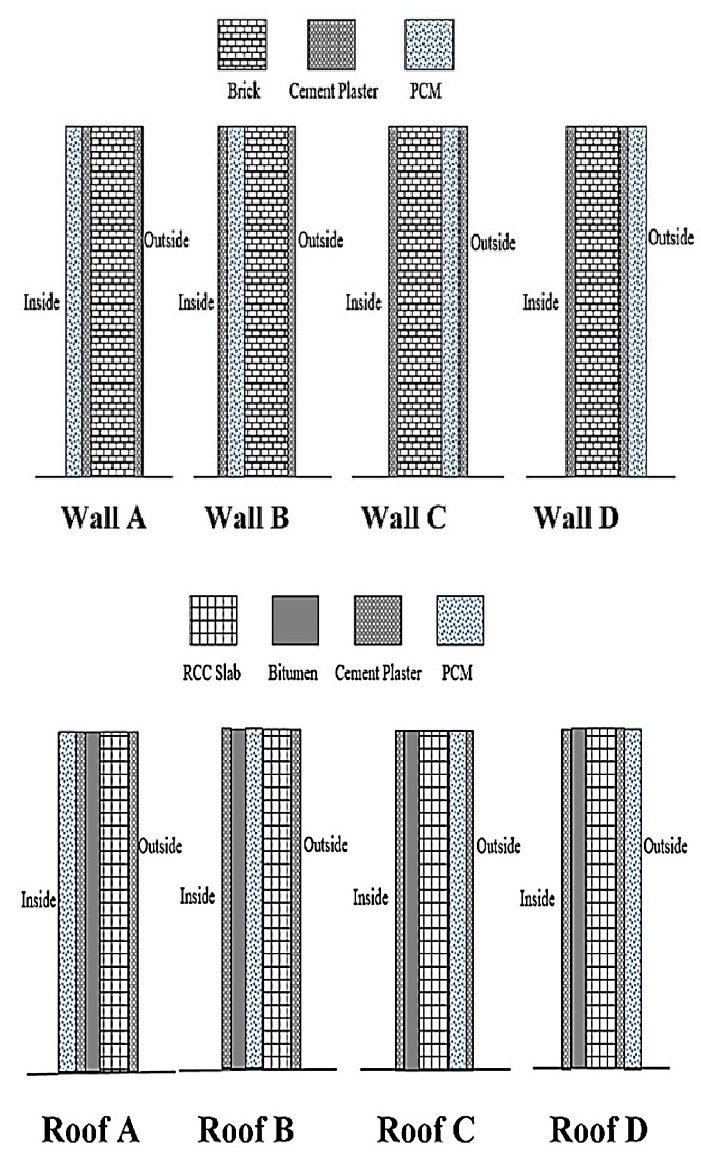
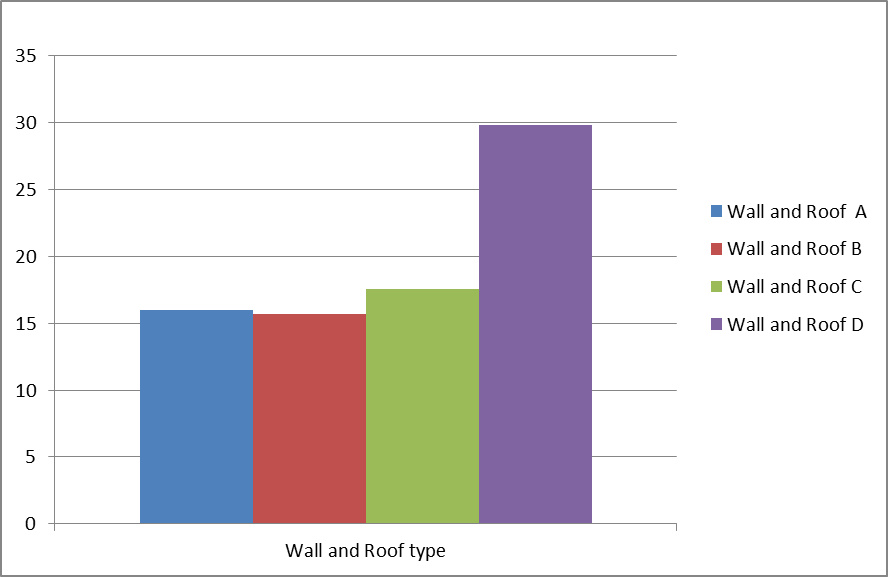
In this study, various configurations for placing the PCM layer within the roof structure were explored to assess their influence on annual energy savings. In the first configuration (Roof A), the PCM was installed at the innermost layer of the roof. In Roof B, it was positioned after the bitumen layer, while in Roof C, the PCM was placed after the RCC slab. Lastly, Roof D featured the PCM on the external surface of the roof, as shown in Fig. 11(b). For all setups, the PCM layer thickness was kept constant at 37 mm. Dynamic energy simulations were conducted to compare the performance of these configurations. According to the results presented in Fig. 12 and Tab. 12, the most significant energy savings (approximately 29.77% annually) occurred when PCM was placed on the exterior side of both the walls and roof (configuration D). In contrast, the least reduction, around 15.6%, was observed when PCM was positioned on the innermost side (configuration A), which is most exposed to indoor conditions. These findings clearly indicate that the external placement of PCM is the most effective for maximizing energy efficiency, and that the location of PCM within the building envelope plays a crucial role in determining its energy saving potential.
Tab. 12.
Comparison of annual energy consumption with different wall and roof configuration
The study, conducted annually, found that adding a PCM layer to a building reduces energy consumption for both heating and cooling. Bio PCM M91/Q23 showed the lowest energy usage, with 262.3 Wh/m² for heating and 3753.8 Wh/m² for cooling. The PCM’s high heat storage capacity reduced peak loads, leading to a significant decrease in overall energy consumption for both heating and cooling. This resulted in lower energy demand, contributing to better energy efficiency in buildings.
The differences in PCM performance across the five Egyptian cities can be clearly explained by the interaction between climate conditions, PCM melting–freezing cycling efficiency, and the thermal behavior of the building envelope. The observed energy savings (14.8–17.55%) align well with previous findings by Sovetova et al. [19], who demonstrated that climates combining high solar intensity with moderate night cooling maximize the effectiveness of PCM charging and discharging. In cities such as Assiut and Alexandria, the PCM melting point of 23°C closely matches typical indoor comfort set points, leading to more frequent full melt freeze cycles and therefore superior thermal stabilization, consistent with the conclusions of Alam et al. [20] regarding the critical importance of melting temperature optimization. Conversely, Aswan exhibited slightly lower savings due to extreme daytime temperatures that saturate the PCM early, reducing the available latent storage window, a trend also reported by Auzeby et al. [26] for overheating-prone climates. Furthermore, the enhanced performance observed when PCM is positioned nearer to exterior envelope layers supports the findings of Lei et al. [21] and Jin et al. [29], who emphasized that PCM exposure to larger diurnal temperature gradients significantly improves charging–discharging efficiency. Overall, the shift of thermal load from daytime to nighttime induced by the PCM in all climates corroborates mechanisms widely described in the literature [19, 20, 22], confirming the consistency and validity of the present simulation outcomes.
. Energy Efficiency Based on PCM Thickness
The amount of thermal energy that phase change materials (PCMs) can store is directly influenced by the volume used. As the volume of PCM increases, its ability to store latent heat also rises. However, this increase is not indefinite; beyond a certain volume, the material reaches its energy absorption capacity, and any further addition yields diminishing returns. Moreover, incorporating large quantities of PCM in building envelopes may significantly raise material and installation costs, reducing economic feasibility.
To identify an efficient configuration, this study explores how varying the PCM layer thickness (from 10 mm to 100 mm) affects annual energy savings. The PCM is applied internally on walls and roofs in separate simulations, Results from dynamic thermal modeling show that energy savings improve with greater PCM thickness, but the benefit plateaus beyond a certain point. For instance, reductions in annual energy usage reached 11.28% with a 20 mm layer, 16.68% with 40 mm, 20.32% with 60 mm, and 23% with 80 mm as displayed in Fig. 13.
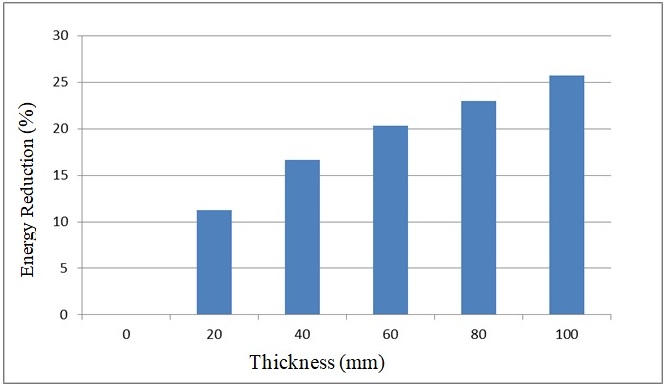
Based on these results, a 37 mm PCM layer is identified as the optimal thickness, offering approximately 16% energy savings without excessive material use. Thicker layers beyond this threshold offer only marginal improvements, making them less practical for widespread use in cost-conscious construction.
. CONCLUSIONS
The research aims to explore how incorporating phase change materials (PCMs) into building envelopes can enhance energy efficiency in residential buildings by improving thermal regulation and reducing energy consumption. This relies on conducting a thermal simulation using the Energy Plus program via Design Builder to analyze the effect of PCM on energy consumption and thermal performance efficiency in five Egyptian cities with different climates including Ismailia, Alexandria, Assiut, Aswan, and South Sinai. A 3D model of a residential building consisting of one floor with three rooms was developed, and structural details and internal energy loads were added. The CondFD algorithm was also used in Energy Plus to calculate the heat transfer inside walls and ceilings. This method relies on dividing structural elements into a network of nodes and solving heat transfer equations for each of them, which allows for higher accuracy in predicting PCM behavior inside building materials.
Three types of PCM were tested to choose the best in terms of reducing energy consumption, taking into account the effect of the layer location in walls and ceilings, whether placed on the interior or exterior side. An analysis was also conducted for the optimal PCM layer thickness to determine the maximum energy savings without unnecessary cost increases. The annual energy consumption without PCM was 171.63 kWh/m² in Ismailia, 132.93 kWh/m² in Alexandria, 191.53 kWh/m² in Assiut, 230.56 kWh/m² in Aswan, and 166.20 kWh/m² in South Sinai, The results showed that after incorporating PCM type M91/Q23 with a melting point of 23°C and a thickness of 37 mm, it achieved the best performance, as it was able to reduce energy consumption by 17.55% in Assiut, which is characterized by a semi-arid climate with a significant temperature differences between day and night, while the savings in other cities ranged between 14.8% and 16.28%, with Alexandria recording 16%, Ismailia 15.68%, South Sinai 16.28%, and the lowest savings were in Aswan at 14.8%. The M27/Q21 with a thickness of 11.2 mm provided the lowest energy reduction, achieving 9.22% in Ismailia, 6.91% in Alexandria, 7.46% in Assiut, 5.99% in Aswan, and 6.88% in South Sinai.
When analyzing the effect of PCM location inside ceilings and walls, it was found that placing PCM in the outer layer provides the best performance, achieving a reduction in energy consumption of 29.77%, while when placing PCM in the inner side, the savings decreased to 15.6%, which is attributed to the fact that placing PCM in the outer layer allows it to capture thermal energy throughout the day and discharge it during the night, which reduces the thermal load on air conditioning systems. When comparing PCM with traditional insulation materials, it was found that using PCM with a thickness of 37 mm resulted in a reduction in energy consumption by 36% compared to the reference building, while the best traditional insulation material (polyurethane) provided only 31%, indicating the superiority of PCM in reducing thermal loads while achieving a more efficient dynamic response. The effect of PCM layer thickness on thermal performance was also analyzed, and the results showed that increasing the thickness of PCM leads to increased energy savings, so 37 mm was determined as the best thickness that achieves a balance between effectiveness and cost. When analyzing the monthly energy consumption, it was observed that PCM reduced heating consumption in Assiut by 30% in January, cooling consumption in Aswan decreased by 15% in July, while in Alexandria PCM led to a decrease in cooling consumption.
This study confirms that phase change materials (PCMs) are highly effective in enhancing energy efficiency, thermal comfort and can be applied anywhere using the weather data of each country. So, Future research should explore how different PCM properties such as phase transition temperature and thermal conductivity impact building energy use. Additionally, investigating effective encapsulation methods is essential to ensure reliable integration of PCMs in building envelopes like walls and roofs.