
Introduction
Durability tests are categorised as experiments aimed at assessing a component's quality, covering its application in specific branches of industry. They can be performed on various test stands that emulate operational conditions such as cyclic loading [1, 2, 3], temperature [1, 4], and mounting manner, which reflect real scenarios [5, 6, 7]. This process requires servo-actuators [1, 2], digital controllers [2, 5], chambers, and sub-elements to secure the tested objects [3, 4].
Tests can be conducted using various signal types, including sinusoidal and triangular functions [1, 5], as well as stochastic ones [6, 7, 8]. The choice of signal type relates to the experimental procedure, which is designed with the characteristics of the tested object and its intended application [6, 7] in mind, along with the requirements [3, 5]. This indicates that components or vehicles not constrained by quality standards or regulations can be evaluated according to the loading programme proposed by their manufacturers' research teams. In such instances, multi-servo-actuator testing platforms are employed for road simulation under operational signals [6, 7]. It is essential to note that this approach requires a substantial area to accommodate the dimensions of the tested objects, as a semitrailer can illustrate [7].
A typical durability problem is also discussed in [9] where a proposition for 3D testing using force three components, i.e. Fx, Fy, Fz applied in a couple zone for more realistic conditions is presented. Nevertheless, this approach requires a more complex testing system than a typical one, i.e. three servo-actuators and a special gripping head. Worth noticing that this method requires a lot of calculations for test preparation [3, 9].
A discussion on mechanical coupling devices and the requirements is presented in [10], giving details for the testing based on regulations and directives, but without laboratory examples and results.
More details for this kind of test at the examined objects (frames and coupling ball with supports), mounting system (using testing platform and stands), as well as force and displacement courses are presented in [11, 12]. This covers the weakest regions for inspection, the response of the tested object determined on the displacement signal and cracks in the dye-penetrant technique.
For a stand test in temperature chambers, the components’ features also play an important role. Therefore, this type of facility is suited to the tested objects that cover the mounting manner, loading methods for components, and capture environmental conditions reflecting their range, as formulated based on operational ones, i.e., 50 °C to 180 °C [4].
Some efforts suggest that the durability of vehicles or components can also be assessed using numerical approaches [13, 14]. For this case, a lot of component sections, such as wheel rims [13], arms, ball joints, springs, and subframe, should be taken into account for correct results [14]. In [13], results from strain gauges were used for determining loading conditions for crack occurrence in a wheel rim. These approaches are compared with the results of durability tests for FEA validation [13] or for calibration of numerical models to different road types [14].
The number of these results indicates their limited value in addressing the problem of the mechanical resistance of component type in durability tests. Consequently, there is ample scope for experimental and numerical effort in this area. Therefore, as well as the author's direct connection with the experimental mechanics of materials and structural components for the Polish automotive industry, for the research-development-implementation approach, the topic of durability testing is the subject of this paper.
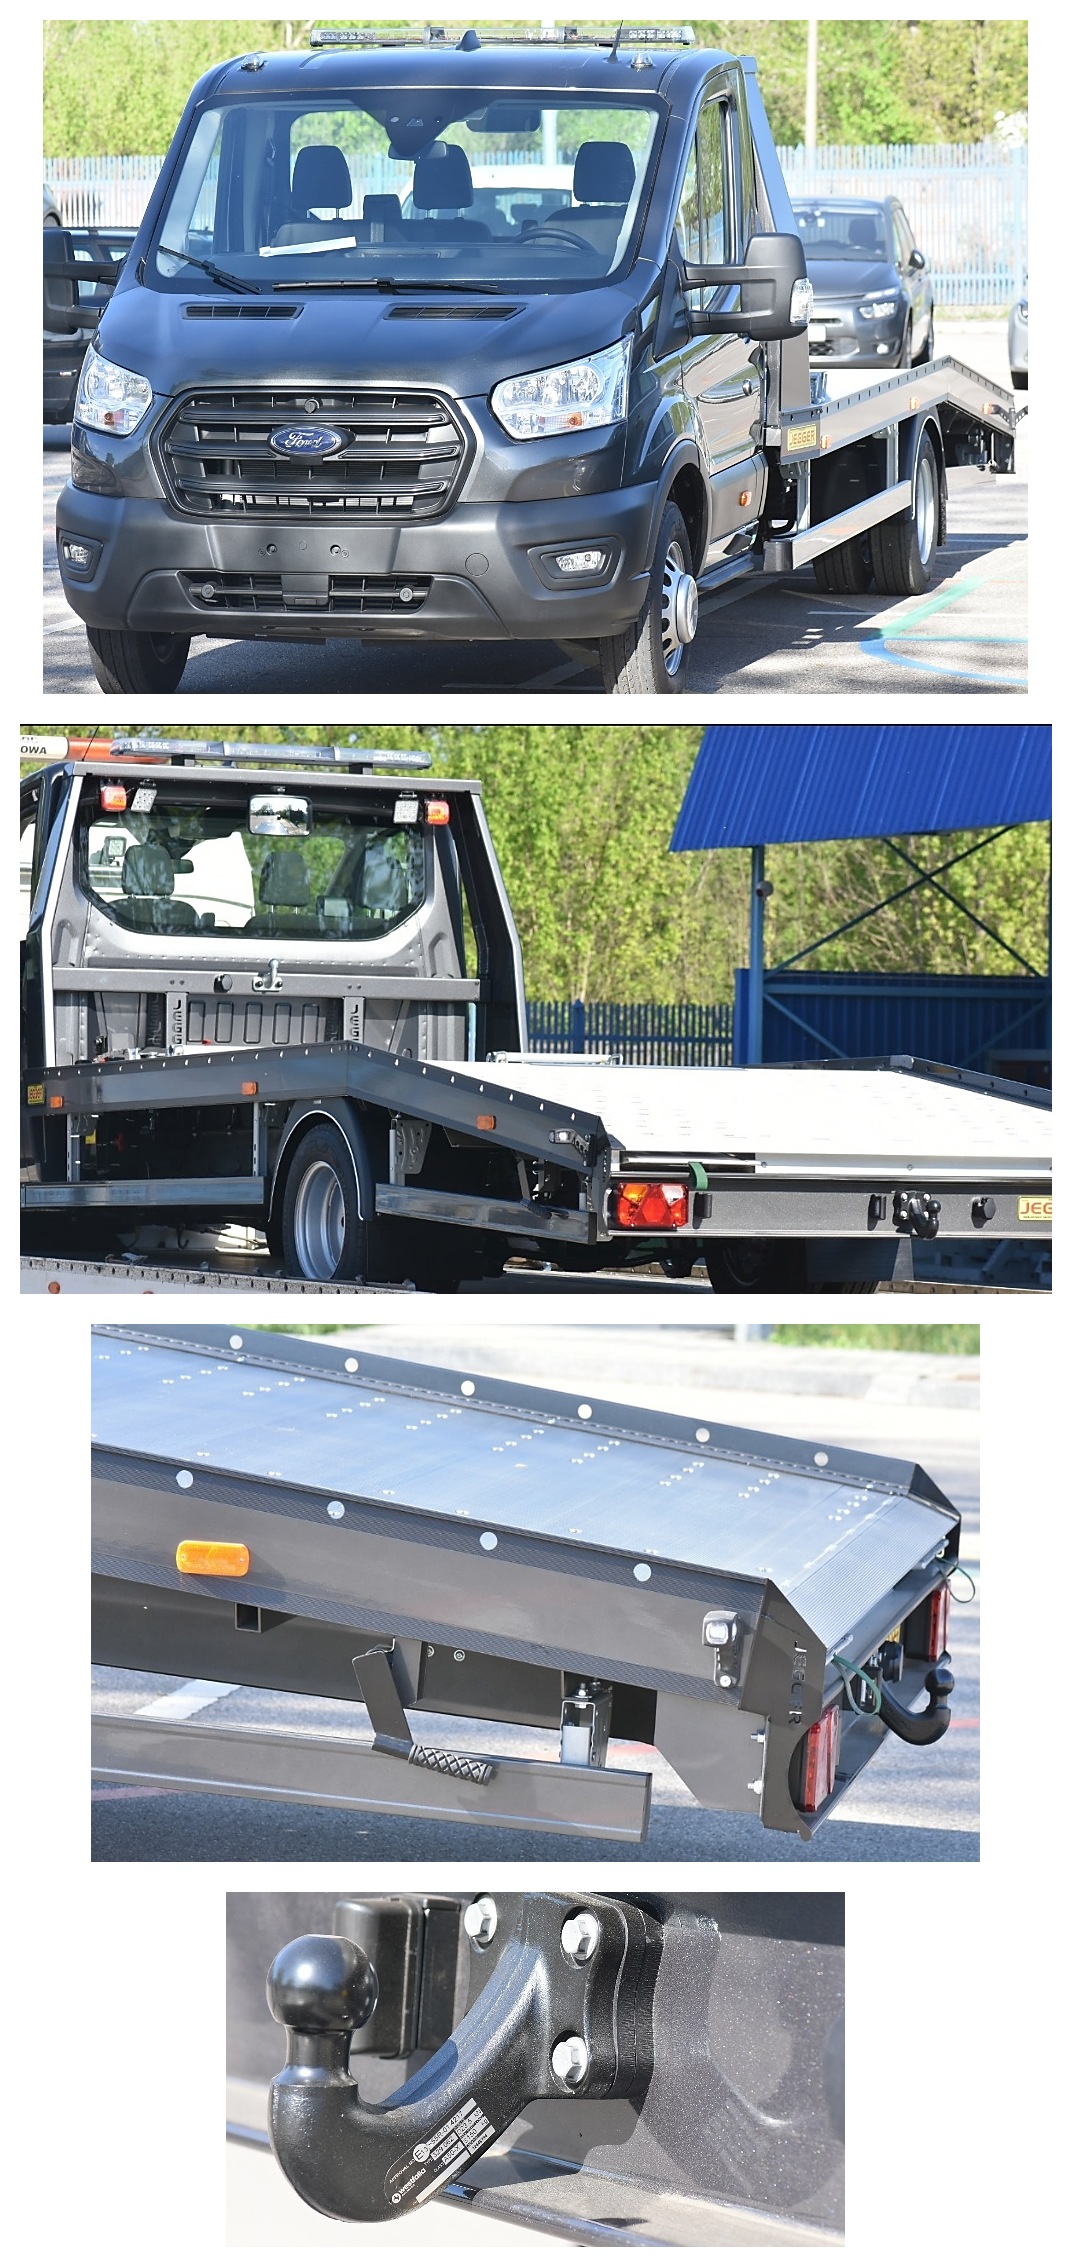
An example of the tested object that establishes the requirements for the laboratory regarding facilities, as well as aligning with the research team's testing efforts, is clearly illustrated in Fig. 1. In this case, the component is represented by the rear body of the vehicle, specifically from the last section of its cabin to the coupling ball. This element must be mounted for the sub-components used in the vehicle for testing and examined for the presence of deformation and cracks, encompassing its entire volume.
Worth noting that differences in component shapes do not enable the use of a universal stand test system. Consequently, each experimental procedure for the type of component is unique and demands specific adjustments concerning its geometrical variations, the arrangement of mounting sub-elements, gripping method variants [15] and the placement of servo-actuators for loading [12].
This type of test is not often conducted on components supported by the driving axle and suspension elements because it requires a large platform (typically 7×2.5 [m]) with T-slots and seismic mass, two (in the case of steel at 2×10⁶ loading cycles) or even five (in the case of aluminium alloy if the number of cycles 5×10⁶ is required) weeks of continuous (day and night) testing, inspection at least every two days, tuning corrections if necessary, replacement of the coupling ball in the coupling zone if a fracture occurs, and technical corrections to the component by the manufacturer for deformation or crack occurrence at the improvement stage for the tested object quality. Moreover, this type of test can be easily considered by notified bodies (Department of Vehicle Type-Approval & Testing of Motor Transport Institute – for example, as the unit indicated by the approval authority in Poland - Transport Technical Supervision) for the type approval procedure, because manufacturers are obligated to conduct testing of the vehicle bodies, while technical universities can support body manufacturers by designing or modelling for their product quality, but before the durability approach or at holding the test for solving the unexpected technical events in the component.
Therefore, the paper aims to detail the durability testing ofa mechanical coupling device in the form of overrun-transport platforms, and technical difficulties, which can appear during examination, such as differences in mounting manners, cracks, fracture regions and the low quality of welded joints used in tested components.
Experimental procedure
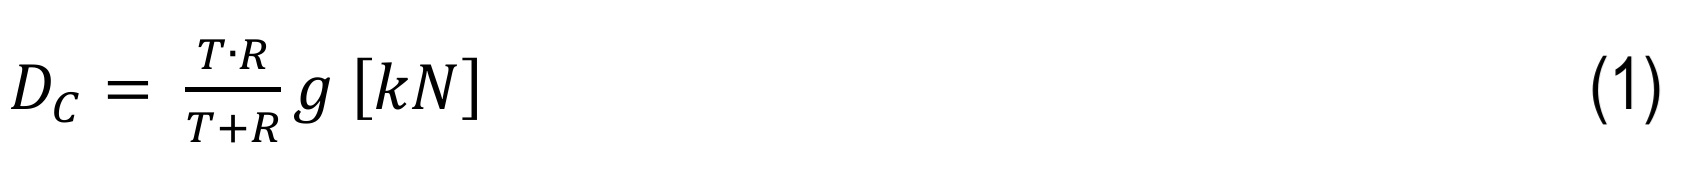
The experimental procedure generally involves several stages. The first stage requires mounting the tested object on the T-slot platform (Fig. 2, Fig. 3). The second stage includes a coupling through a ball and head for loading, while the third stage requires applying a load to the upper section of the component to increase its stiffness. The control signal used in the durability examination is represented by a force course in the form of a sinusoidal function. It sounds like the actuator should follow a digital sampling signal from a digital controller using a tuning process. If this stage is not possible to achieve after mounting the tested object due to the suspension’s susceptibility, the component should be loaded with a mass at which the expected force signal can be achieved. For this case, bags can be used, and they can be distributed on a transport platform to cover its horizontal position. If the component stiffness is too low, even at the additional load, the test cannot be conducted, indicating the component is not correctly designed with respect to vehicle coupling. Worth noticing that in the case of a rigid vehicle suspension, this test step is unnecessary because the force signal from the coupling zone will be distributed to all sections of the tested object.
It should also be emphasised that when assessing the static load capacity of the platform or driving axle, the bags should be placed in the regions where the vehicle wheels are located, following the permissible gross weight of the vehicle being transported, to represent the operating conditions. However, this stage is not required by the scope of homologated tests, and the direct responsibility for the technical quality of this type of product rests with its manufacturer.
The tuning via a closed-loop signal force involves a digital controller. Testing should be carried out at R = -1, using a sinusoidal function with an amplitude of 0.6 Dc, as detailed in UN Regulation No. 55 [3]. The coefficient is directly proposed in this document for application in durability tests without explanation. Dc force represents dynamic force (D) for coupling (c), and it is calculated using the following equation, [3]:
where:
T is the technically permissible maximum mass of the towing vehicle,
R is the technically permissible maximum mass of the trailer witha drawbar free to move in a vertical plane, or of a semitrailer,
g is the acceleration due to gravity (assumed to be 9.81 m/s2 ).
The cyclic sinusoidal force signal is directly connected with a set of vehicles because the towed vehicle hits the towing one and vice versa, causing pushing and pulling. Moreover, this signal type is the most destructive, leading to fracture at a lower value of cycle number than in the R cases levelled by 0.1 and -0.5 [16].
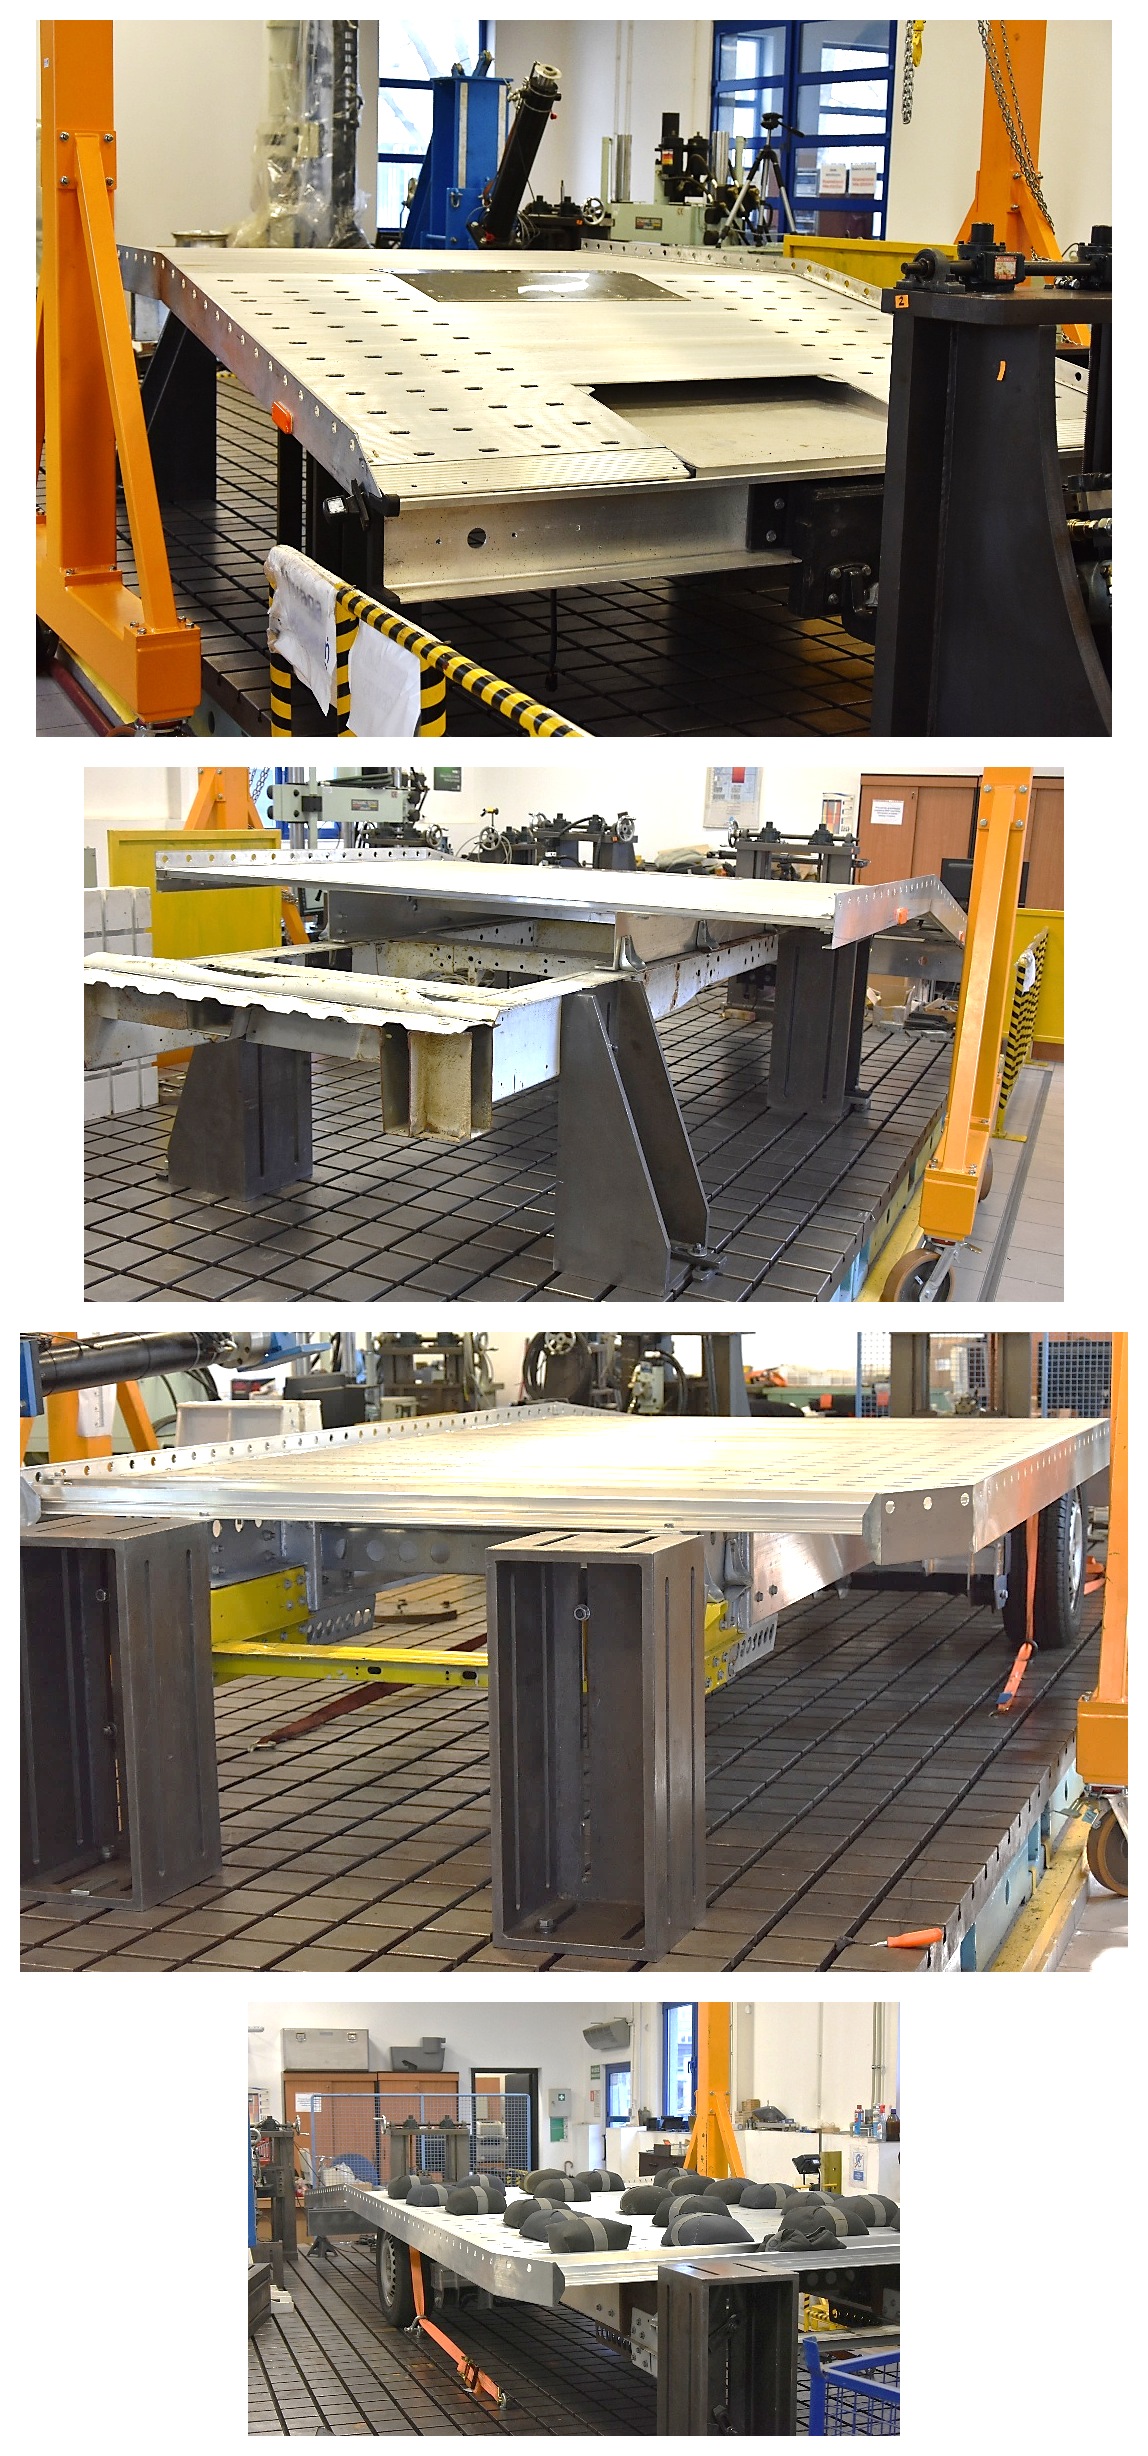
Fig. 2. Mounting manner on the MTS 320 platform by means of: cross-bars (a), supports (b, c), screws (c, d), and the MTS hydraulic actuator (d).
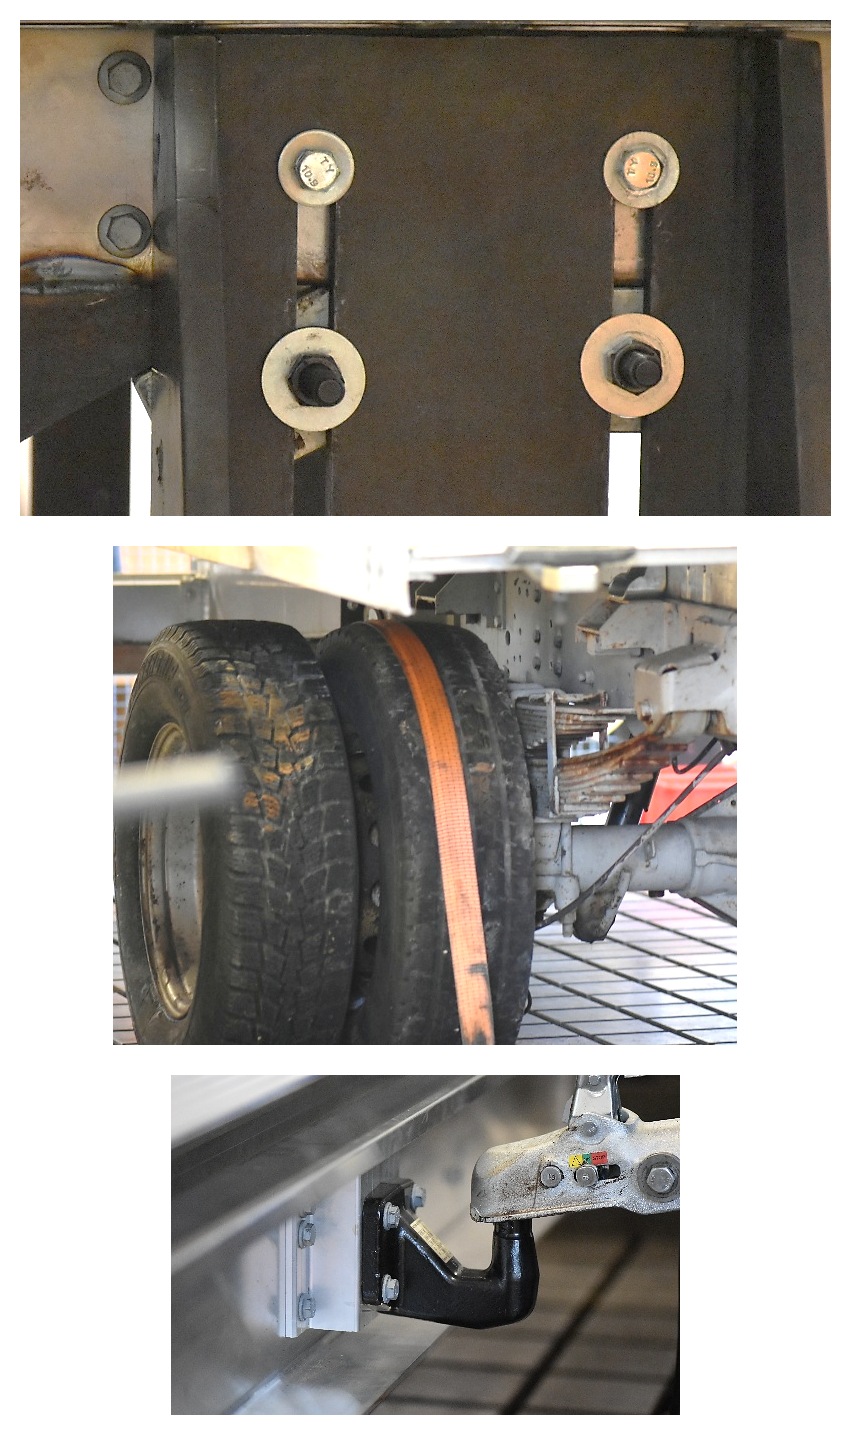
Fig. 3. The 3 variants of loading test using single (a, b) or dual-side (c) actuator (based on [1]).
The limited number of cycles for the durability test depends on the material type; for steel grades, it should reach 2×10⁶ cycles, while for aluminium alloy, 3×10⁶ cycles constitutes the final count. In practice, this determines the testing duration, which should not exceed 12 and 17 days for steel and aluminium alloy components without any interruptions in the examination, respectively. After testing, the component is inspected for cracks using macro-photography and dye-penetrant techniques (Fig. 4). This highlights the weakest zones concerning crack occurrence in the base metal, HAZ, or weld (Fig. 4). To identify these, the mechanical parameters of the selected region should be evaluated through a tensile test (Fig. 9). These results can reveal differences in how the base metal and its weld respond to tensile forces for various reasons.
Results
. Transport platform
This is closely related to the quality of the components, as the weakest areas may be where cracks form, as shown in Fig. 4-Fig.5. This phenomenon can be observed at various cycle values during loading, unloading, or final inspection. It may appear in different regions of a tested component, including the (HAZ) and welds of the supports for the mechanical coupling device (Fig.4a), as well as the HAZ and the section of the holes in the plate used for mounting a coupling ball (Fig.4b). The presence of cracks in these regions can be attributed to poor quality in these areas resulting from incorrect welding parameters or insufficient design and analytical or numerical calculations. Notably, the weakest zones are independent of the structural material used; they can be found in both aluminium alloy and steel.
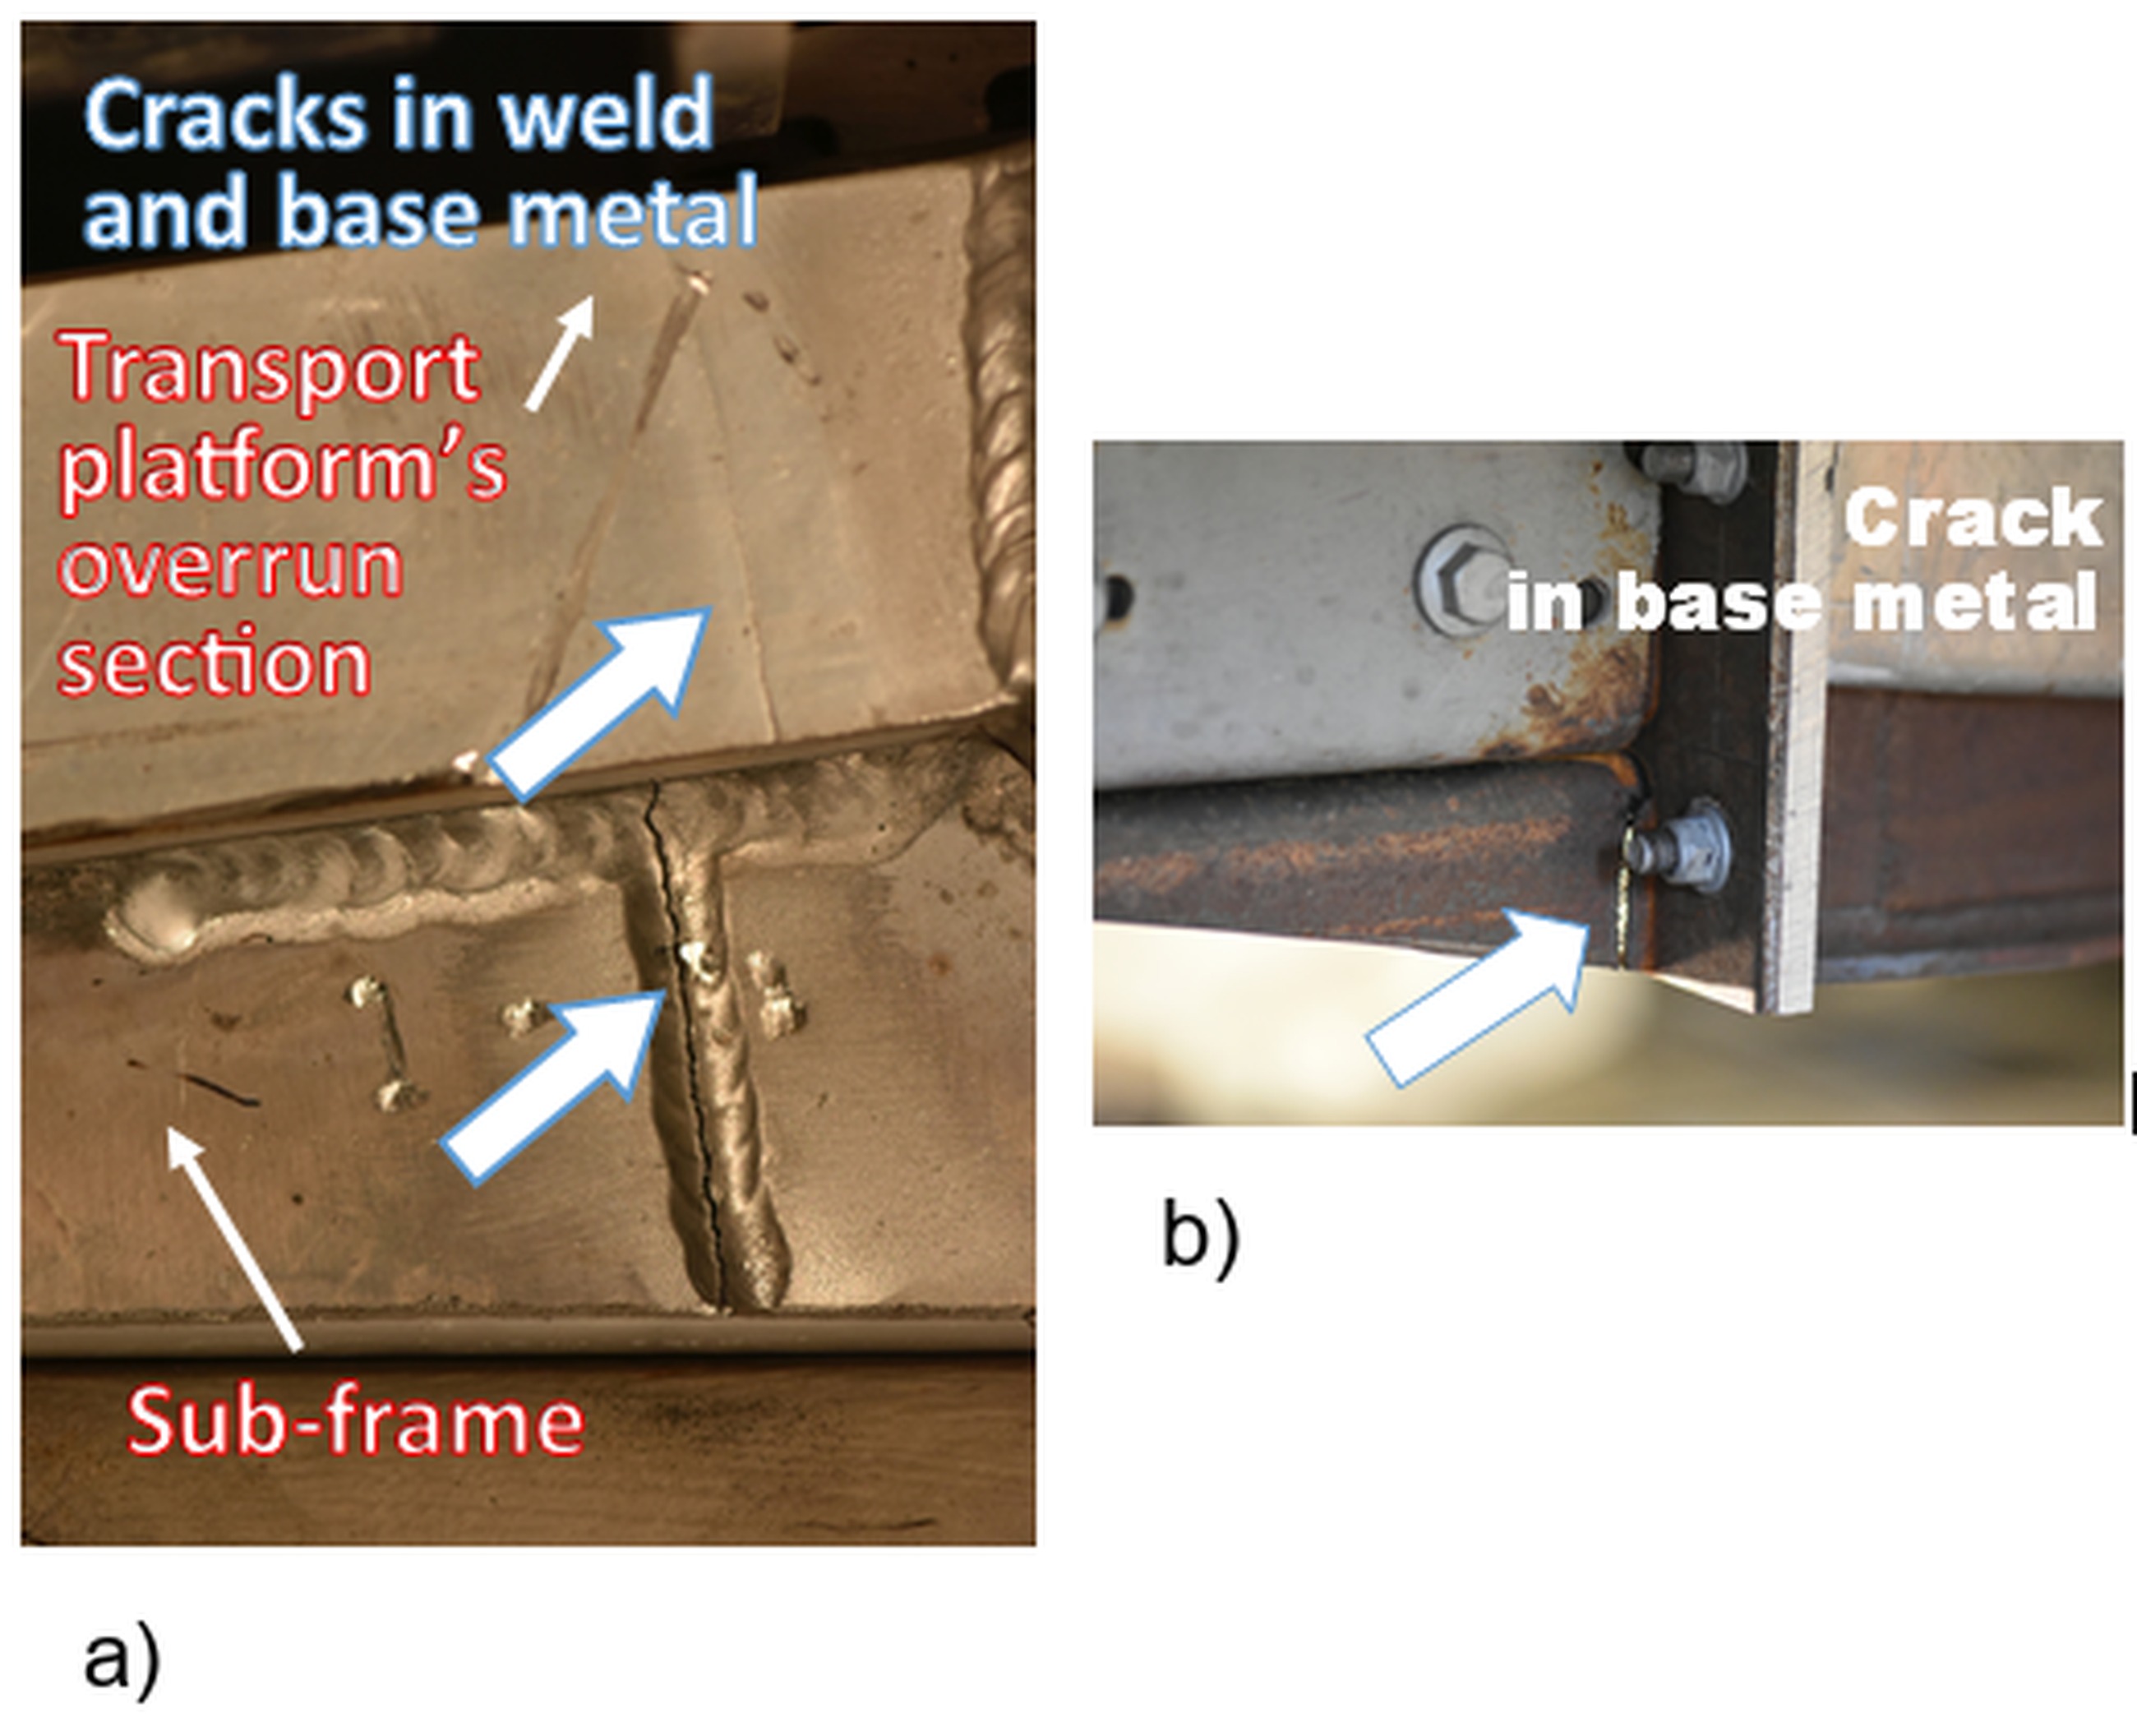
A very similar response to cyclic loading can be observed in the welded sub-frame, following a crack in a joint, Fig. 5a. This indicates the low quality of this region, which may lead to the disconnection of the platform from the vehicle stringers, resulting in an increased stress value in the body element and potentially causing a larger crack in the overrun section. This case shows that the required quality ofthe component can be improved in two ways: (a) by adjusting the parameters of the welding process, and (b) by redesigning the element.
A crack can follow the profile height of the overrun section that supports and connects with a vehicle stringer, as shown in Fig. 5b. Similar to the previous case, this situation is caused by an increase in stress levels in the area where screws are used to connect the platform section to the stringers.
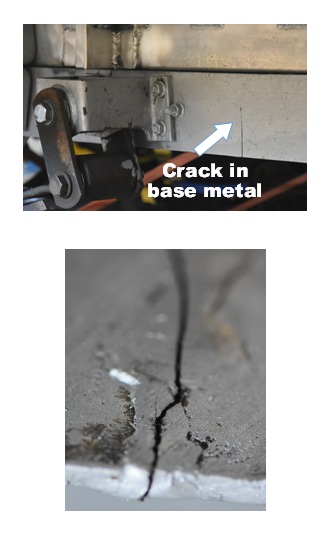
In other cases involving elements that do not belong to the tested components but support them by facilitating their mounting to the tested platform and coupling with a servo-actuator, cracks can also occur (Fig. 6). However, in this instance, the cause is not obvious, as the component type pertains to vehicle stringers. This can be achieved through a macrophotography approach that focuses on the lowest section of the component (Fig.6b). Such an approach can be directly utilised for inspecting operated vehicles, categorised by their types: recovery, cargo, and transport vehicles with a coupling function.
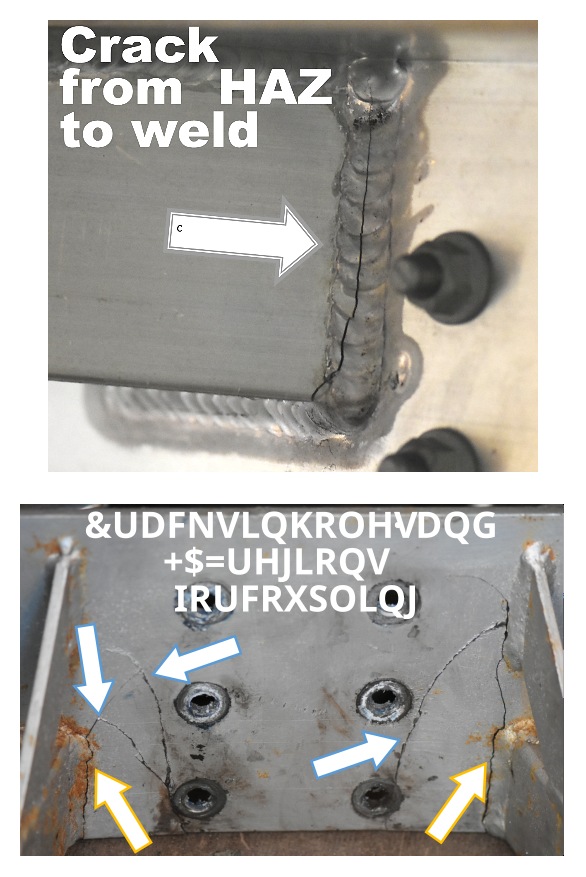
Fig. 4. Cracks in an aluminium alloy (a) and structural steel (b, c) used in a transport platform subjected to durability testing.
. Coupling ball
All sections of the A50-X coupling balls show similar results, including the screws (Fig. 7a), arm (Fig. 7), neck (Fig. 7a, b), and ball (Fig. 7b).
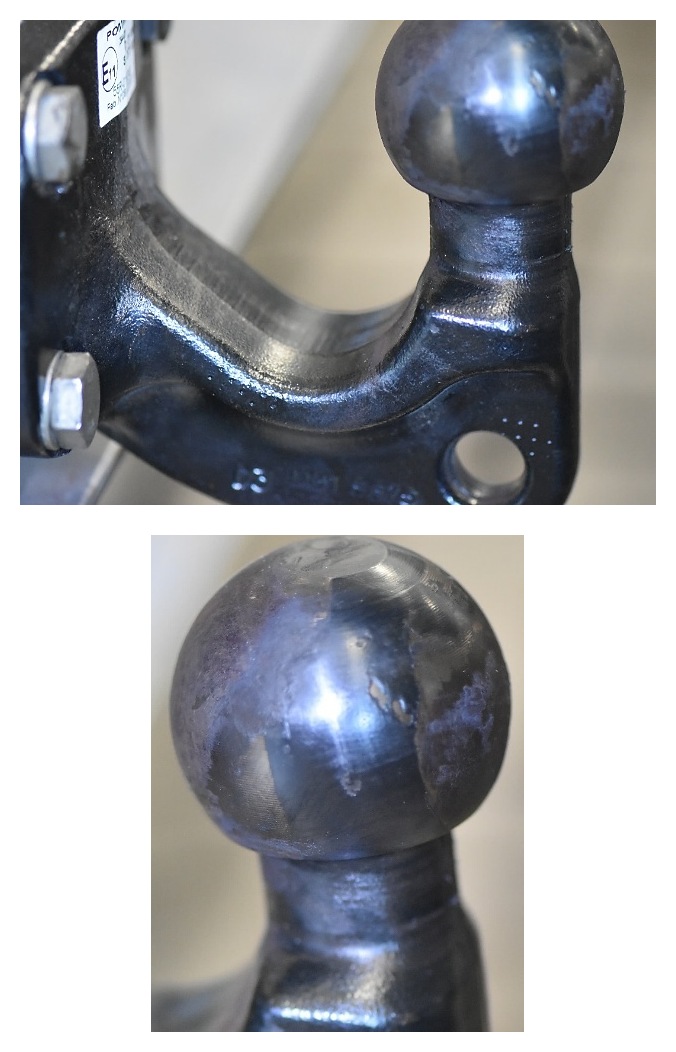
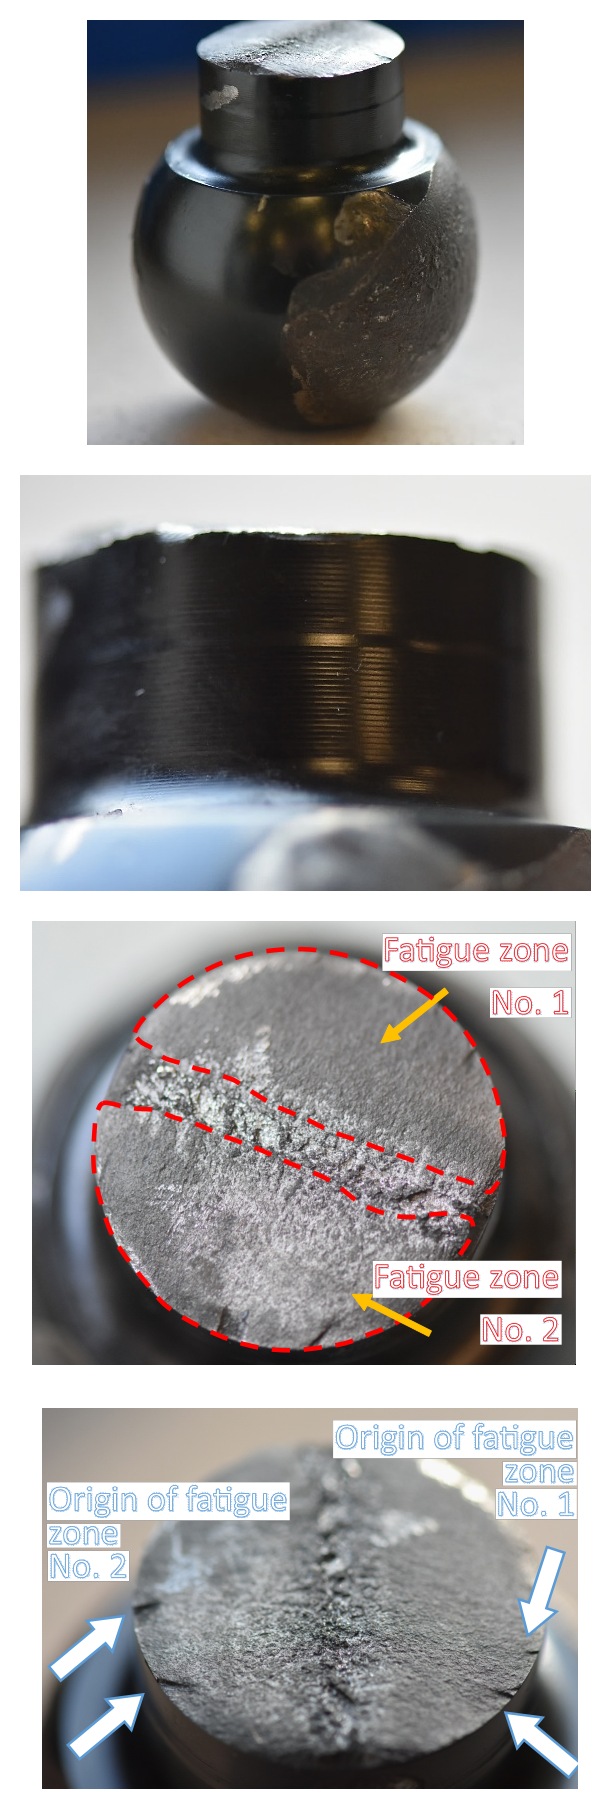
Fig. 8. Fracture zones of A50-X coupling balls from the durability test of a transport platform, n x = 1×10^5.
Additionally, these components meet the approval certificate; however, due to the kinematic features of transport platforms, such as vertical movement under cyclic loading and the vertical force value exceeding the limit level (S value in [kg]) denoted in the component name plate – as a results of a few transport platform durability testing, these sections must be inspected for defects like cracks, loose screws, or permanent deformation. This process requires considerable effort to establish a proper technical pairing between the platform and the coupling ball. From an approval and operational perspective, this indicates that the chosen coupling balls can be used for vehicle coupling at the platform. This is confirmed in Fig. 7 for 3×10⁶ cycles, during which no cracks appeared in the platform or the ball.
In contrast, cracks frequently occur in the neck of a coupling ball, as depicted in Fig. 8. These issues may be linked to previous reasons as well as the technological circumferential notches (Fig. 8b), which create a higher stress value compared to a smooth section. This effect is evident in a fracture area subjected to symmetrical bending cycles, illustrated by the two similar fatigue zones (Fig. 8c) and the nearly identical locations of the fatigue origins (Fig. 8d), attributable to the notches.
. Welds
While in the case of a ball, technology defects should be addressed to the manufacturer, in the case of platforms, quality improvement efforts can be achieved through cooperation between the manufacturer and the homologation research team. For this latter approach, the manufacturer's role involves preparing a plate with a weld, at the same time, specimen distribution and examination are conducted by the testing group, as shown in Fig. 9. These efforts focus on determining tensile characteristics and mechanical parameters (Fig. 9c) to compare with the base metal’s data, which encompasses welding technology qualification and both analytical and FEA results. Upon qualification of the joint for the component and its approval, the fracture zone appeared behind the weld, indicating acceptable results for the joint but insufficient for the tested platform, as the differences in mechanical parameter values resulted in a 50% reduction. Therefore, these results do not allow us to conclude that the component meets the required quality, and it should be redesigned, or the welding technology improved.
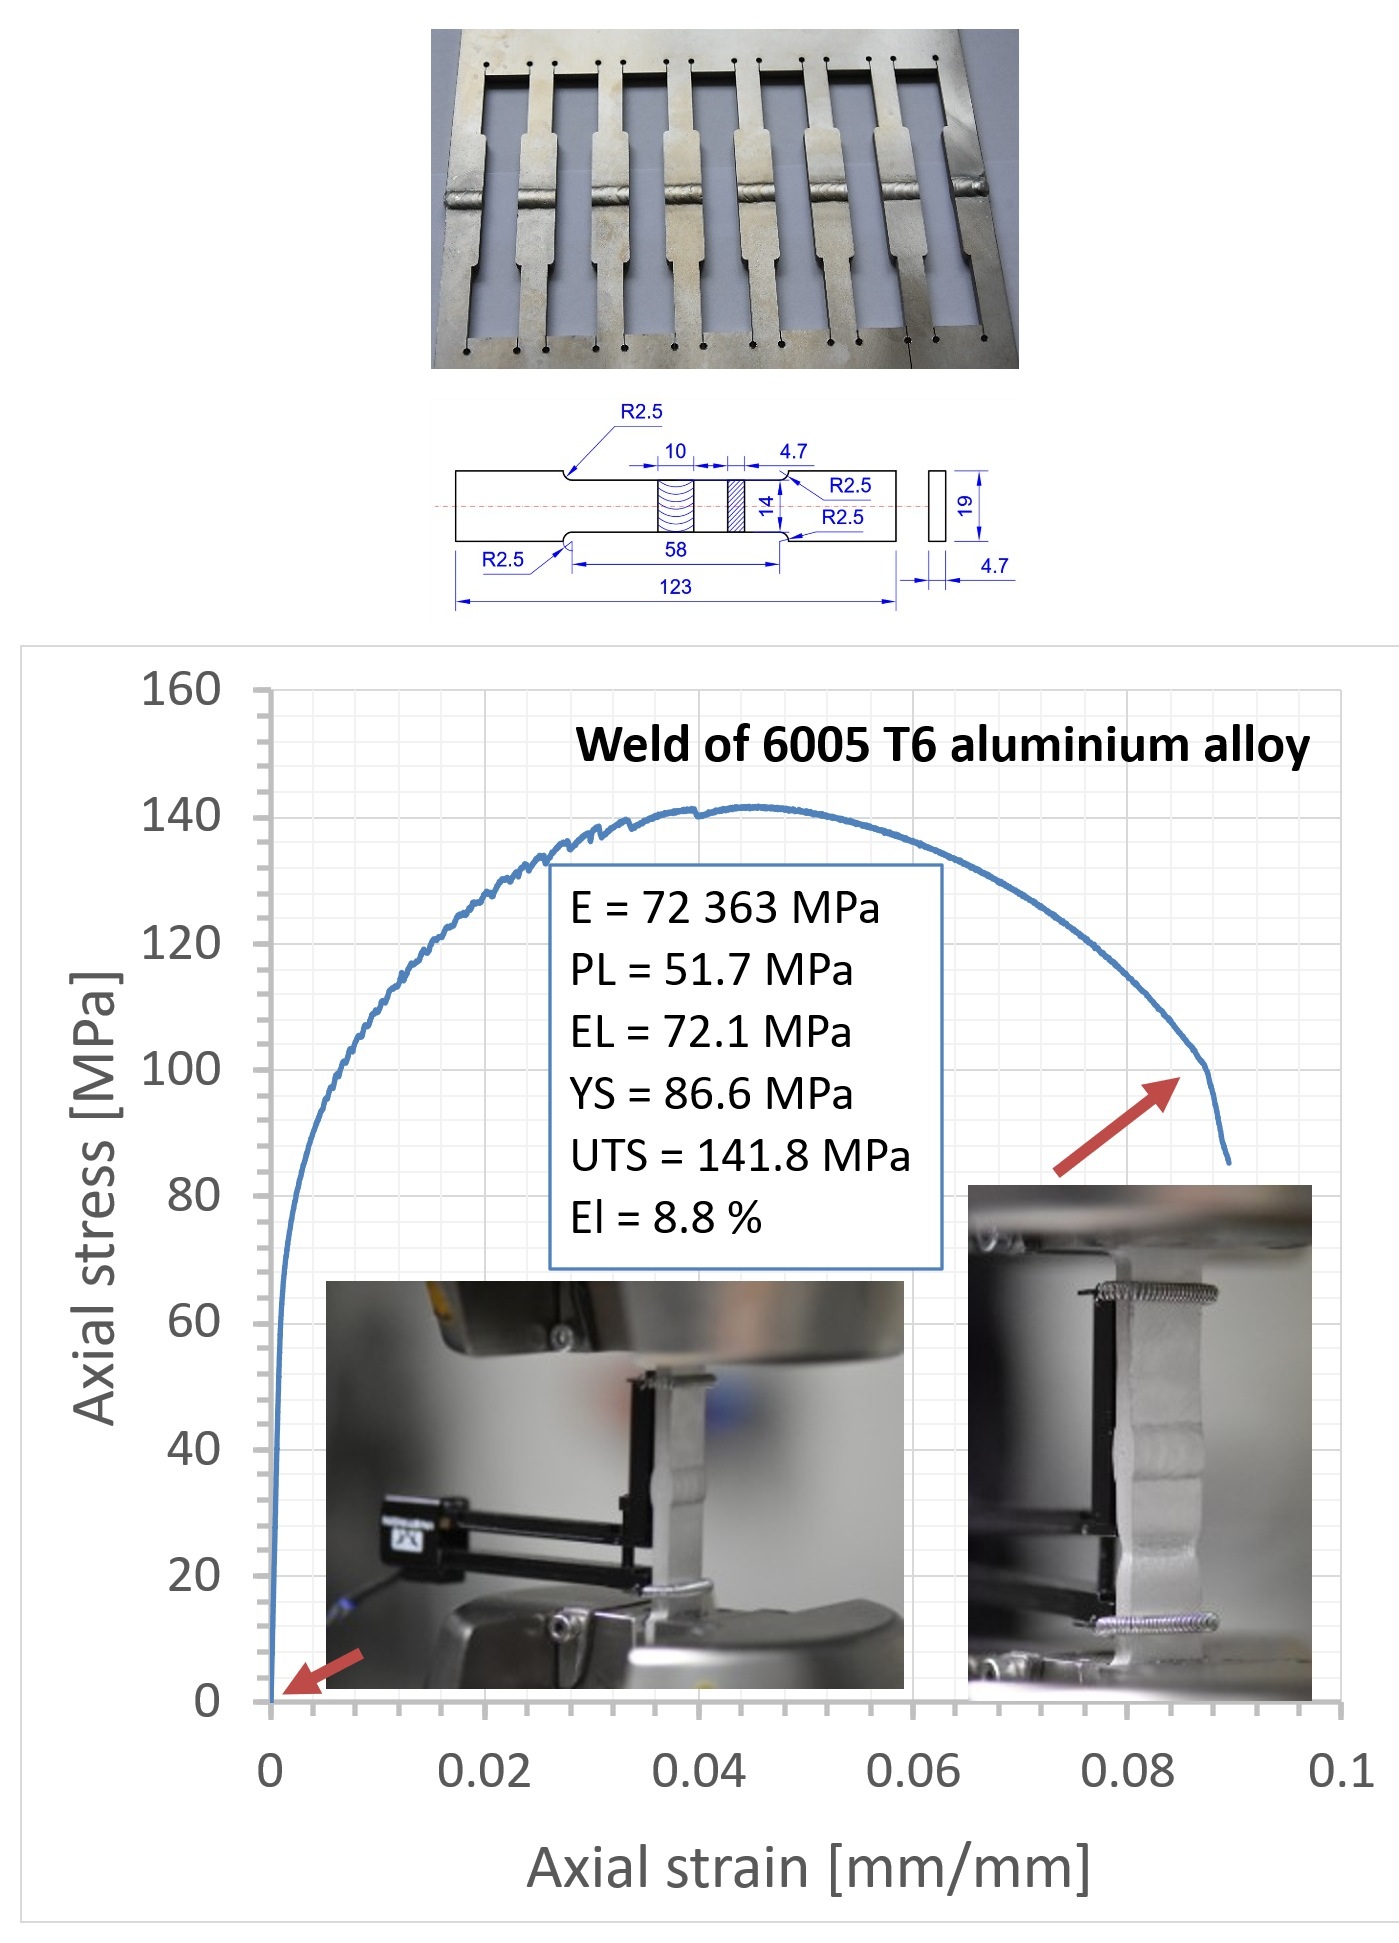
Fig. 9. Specimen distribution in the 6005 T6 welded aluminium alloy plate (a), specimen geometry and dimensions (b) and its results from the tensile test (c): E – Young’s modulus, PL – proportional limit, EL – elastic limit, YS – yield stress, UTS – ultimate tensile strength, El – elongation.
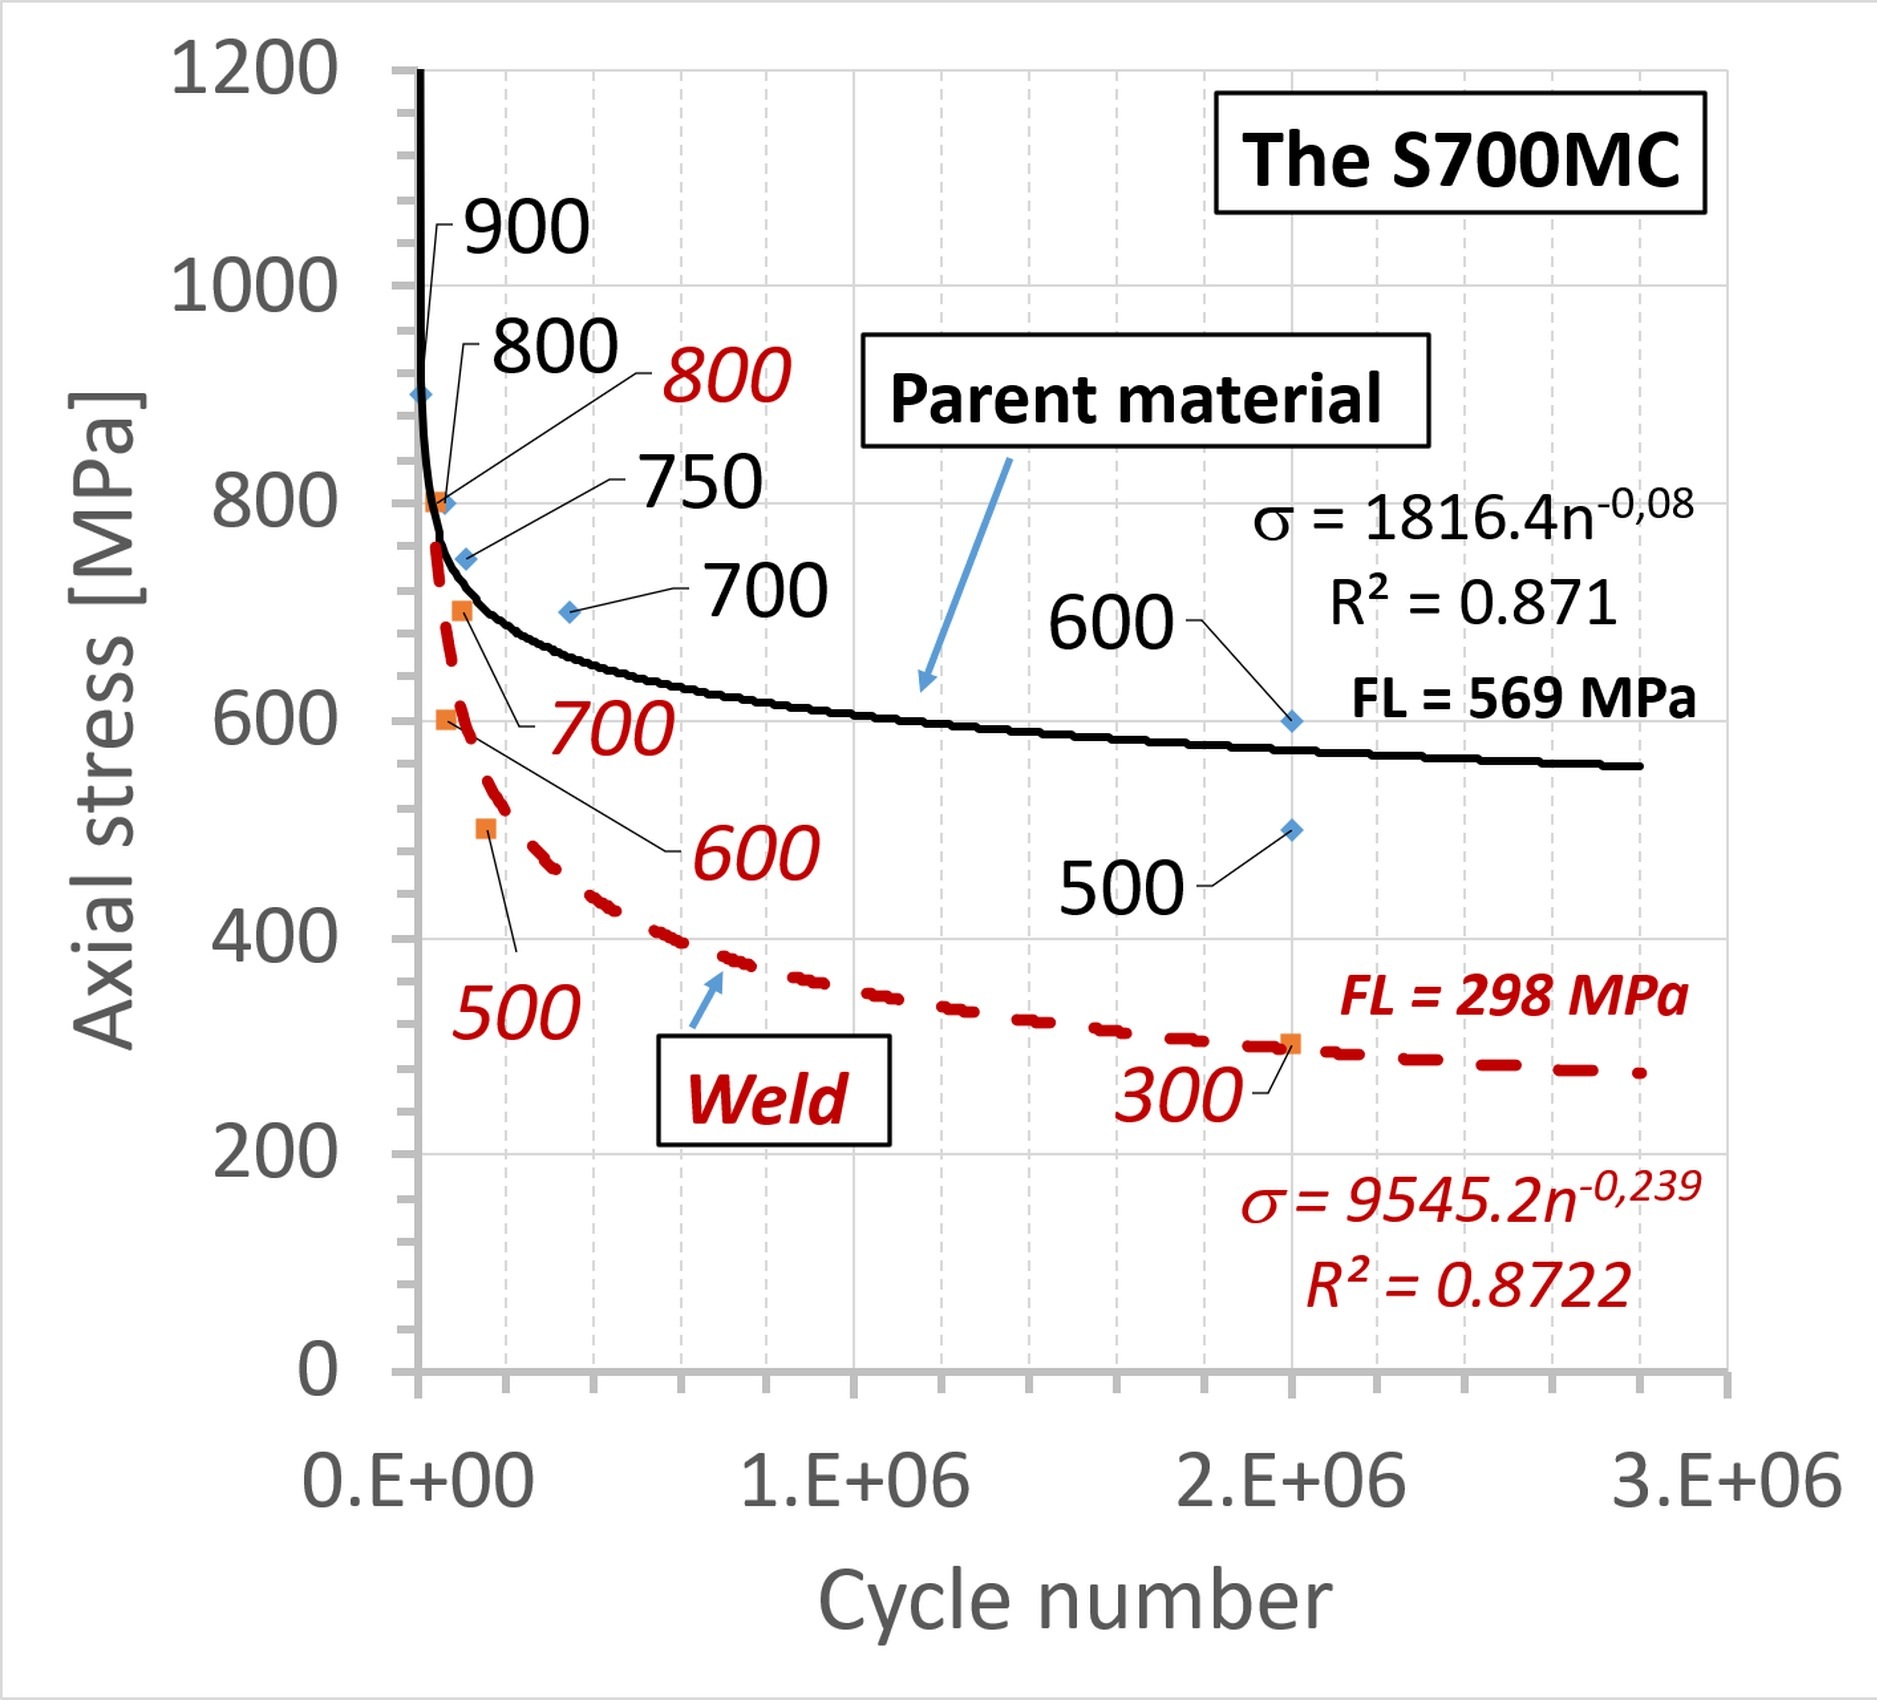
A weld quality assessment may also be included in a fatigue test, utilising parent material and joint results, as shown in Fig. 10. In this case, the difference can be significant, reaching up to two times lower for the joint if high-strength steel is applied. Practically, this indicates that the axial stress values in modelling and operation should not exceed 298 MPa about the weld, as it is the weakest region of a component made from the considered steel type. This suggests that the joining technology should be calibrated to the steel grade, even though this type of structural material is very modern and beneficial.
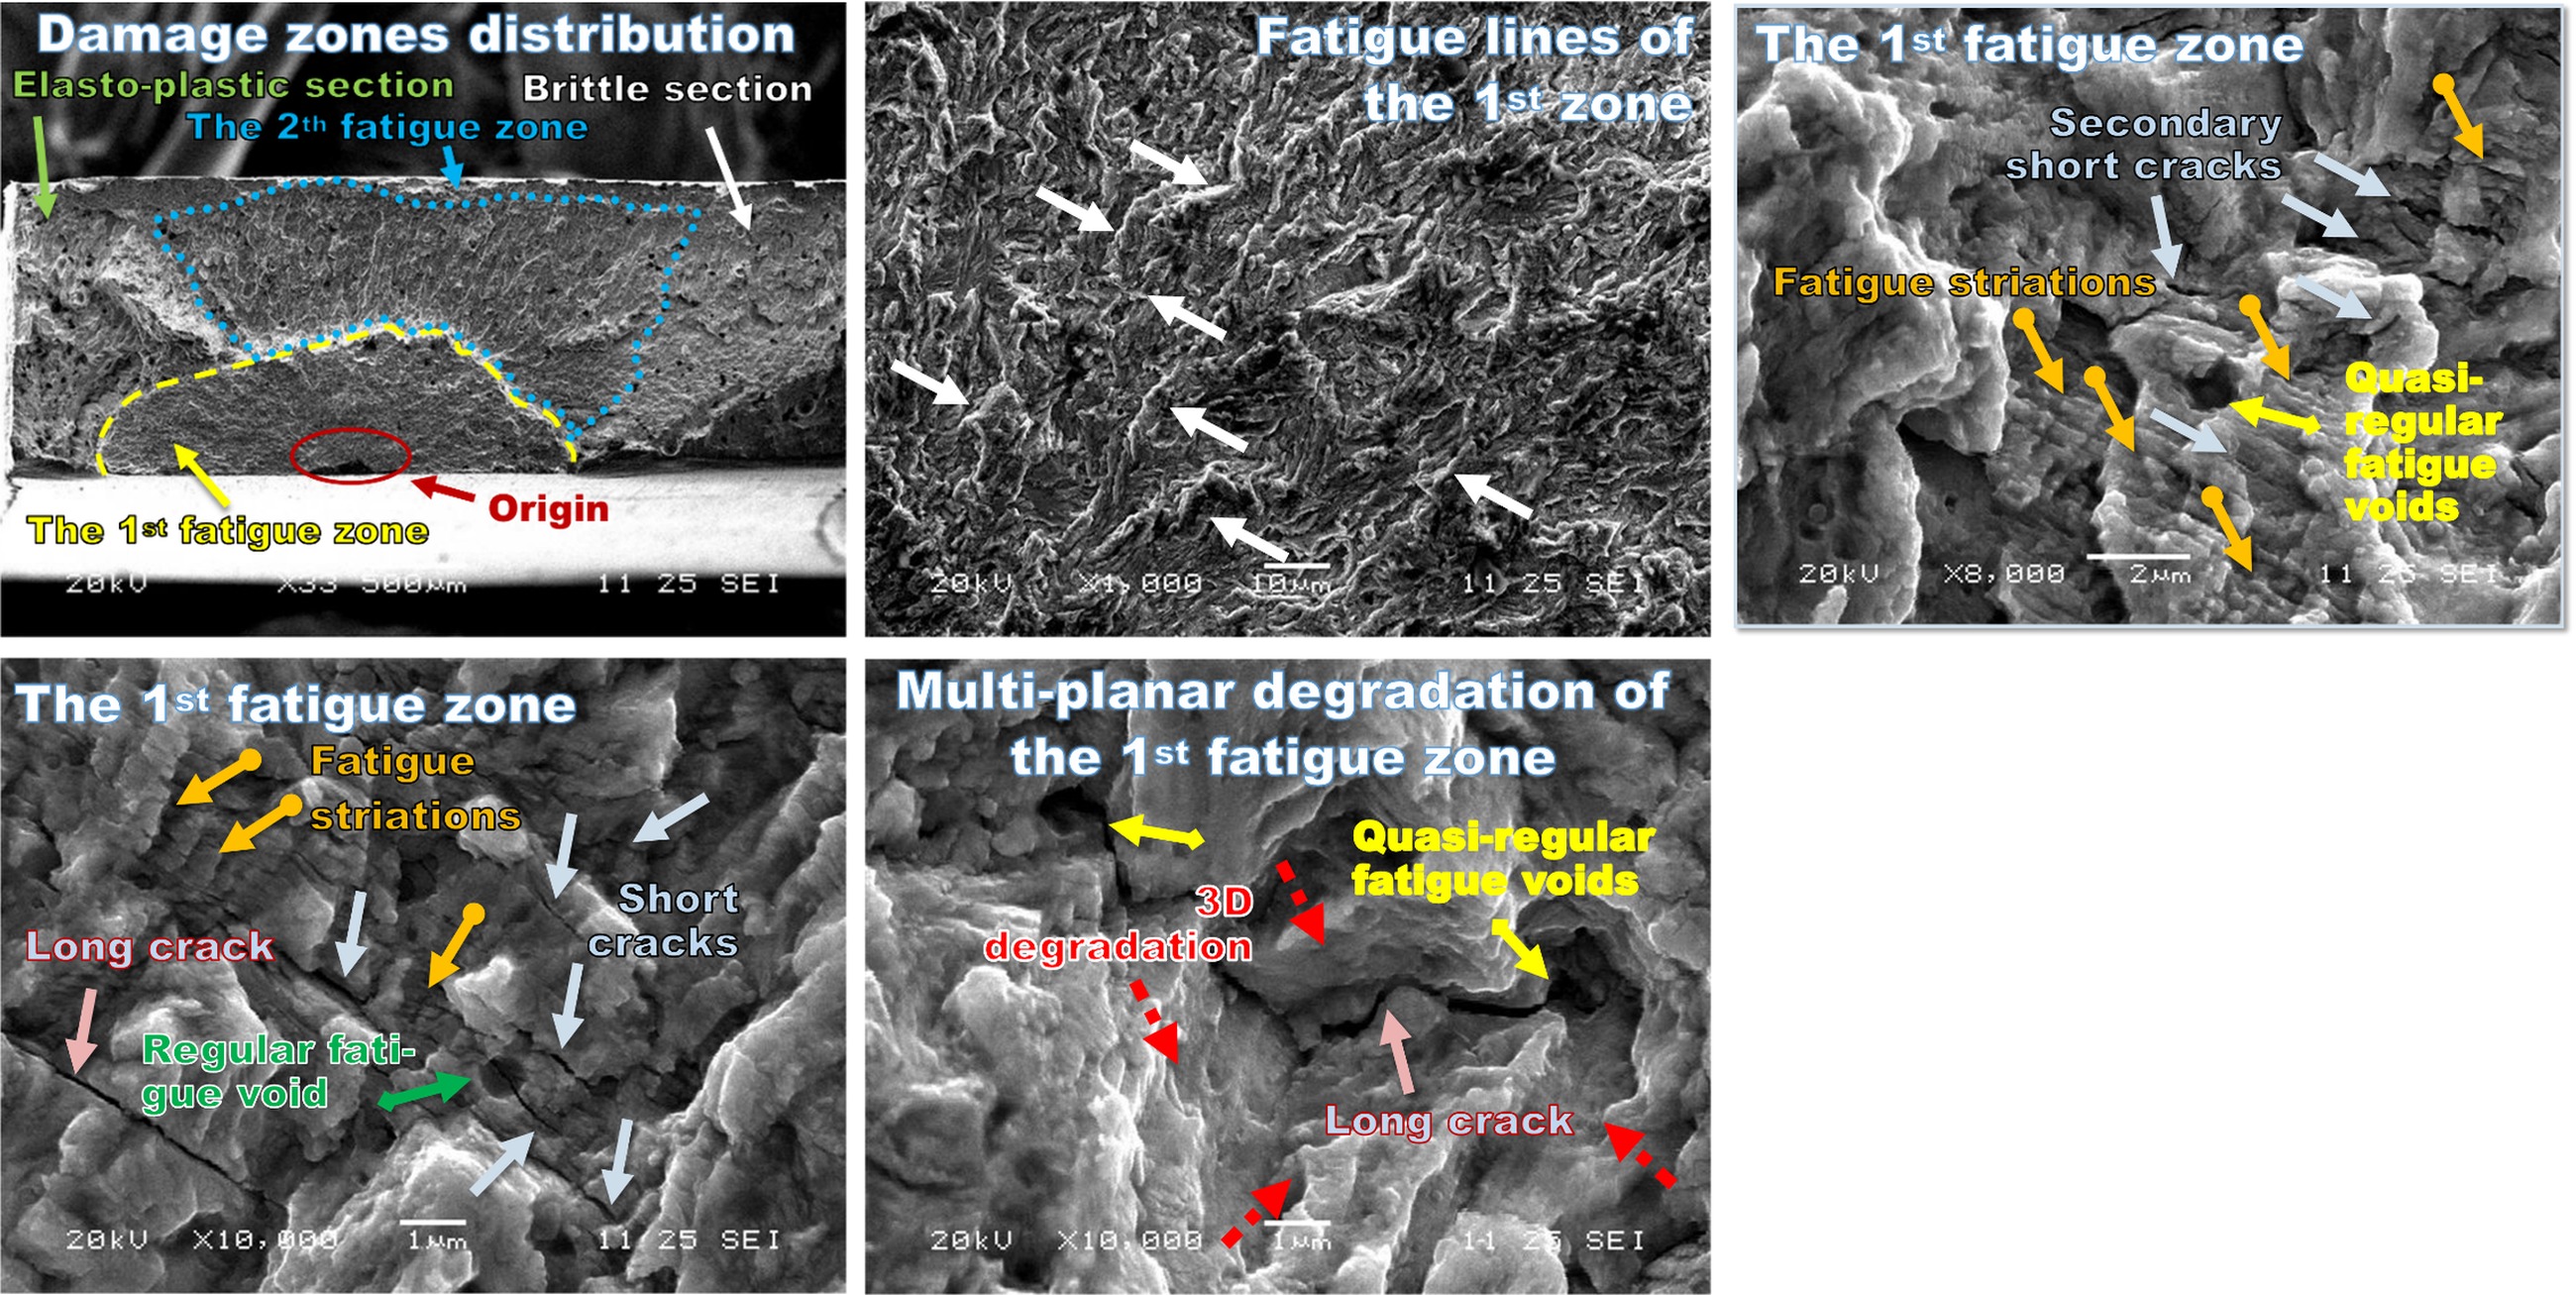
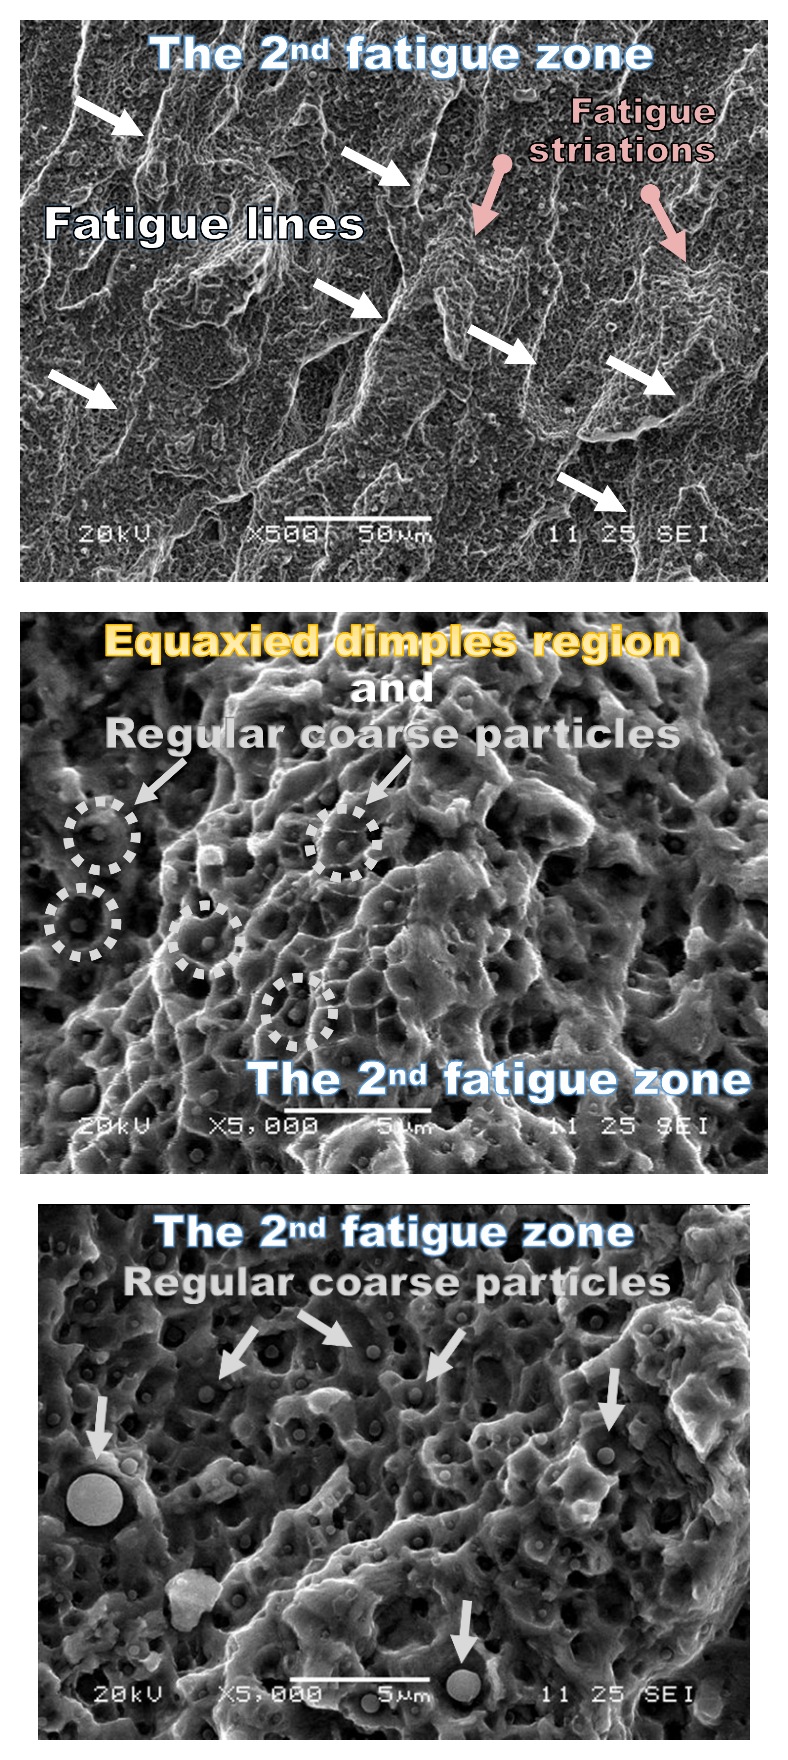
If a crack occurs, efforts should focus on capturing all details of the damage regions (fatigue, brittle and plastic), including fatigue lines, fatigue striations, cracks, and regular or quasi-regular voids (Fig. 11, Fig. 12).
As observed in the case of the S700MC weld subjected to a stress level of 700 MPa, the steel fatigue degradation was associated with two zones, i.e. the first at the origin and the second activated after the first-mentioned. These regions were located in the middle of the weld cross-zone, making the specimen border sections sensitive to the final degradation stages, such as brittle and elastic-plastic, respectively (Fig. 11a).
For this case, the fatigue lines are interrupted in length, indicating a specific degradation type for the S700MC weld steel (Fig. 11b). Nevertheless, typical features of the fatigue zone, such as fatigue striations, are more clearly illustrated (Fig. 11c1). This section also captures short cracks in the fatigue striation zone and long cracks in the cleavage sub-regions (Fig. 11c2). Degradation details from the other inspection section of the 1st fatigue region have revealed multi-planar destruction with long cracks and quasi-regular voids, reflecting the brittle fracturing of the weld in this sub-area (Fig. 11d).
In the case of the 2nd fatigue zone, fatigue lines and fatigue striations were also observed following the secondary origin after the 1st fatigue damage process was completed (Fig. 12a). Nevertheless, this region exhibited different degradation features than the first one. It was related to the elastic-plastic (equiaxed dimples) sub-regions at regular coarse particle occurrence (Fig. 12b,c). It can be concluded that the material mechanical resistance on the cyclic loading was reduced, and then the two last sections appeared, i.e. brittle and elastic-plastic, respectively, causing decohesion.
Summary
Durability examination can be classified as a type of mechanical test intended for final product checking. From practice, it sounds, the tested object should be delivered in a form planned to be used in the trade market, with all realistic components important for capturing its mechanical resistance, i.e. driving axle, springs, bumpers, air bellows and shock absorbers. For coupling, the tested object should be equipped with an approved coupling ball with the correct loading capacity, determined by taking into account the values of technically permissible vehicle weight for towing and towed ones. Moreover, a table with structural materials used in the component should also be delivered because it is directly connected with the final number of cycles for testing. This means for the steel, the limit value of the number of cycles for fatigue limit is equal to 2×10⁶, while in the case of aluminium alloy, this value should be 50% higher, if the cyclic sinusoidal force signal is represented by R = -1.
Depending on the event related to the tested object, the results of a tensile test (for capturing mechanical parameters of a welded joint), a fatigue test (for covering fatigue limit of a welded joint), a macro-photographic analysis (for determining the causes of a crack, e.g. in a coupling ball or its support) or a microscopic analysis (indicating the degradation features of a welded joint under fatigue loading to improve manufacturing technology) may be very helpful.
This enabled the formulation as follows: even though durability tests require the use of cyclic loading to the tested object, some details of the mechanics of materials, joining technology, inspection process and fracture analysis are needed.
Generally, the durability test features can be listed as follows:
The mounting manner of a tested object should follow the operational one.
A cyclic force signal enables the testing of components under stress that frequently exceeds their operational limits, thereby ensuring high safety during use.
The quality of the multi-element component after fatigue is closely linked to the mechanical resistance of all its sections, including the coupling region and its support, welded and screwed joints, the sub-frame, and its mounting regions.
If the component quality is not acceptable, tensile and fatigue tests can support this stage, as they provide values of the mechanical parameters significant for the qualification of joining technology.