
INTRODUCTION
The basic form for crystalline solar cell production is the silicon ingot (see the description of the production procedure above). The ingot (block of silicon), cut with a diamond saw into thin wafers, is the basis of solar cell production. 1 mm thick wafers sawn accurate to 1/10 mm are placed between two plane-parallel metal plates rotating in opposite directions. This procedure enables the wafer thickness to be adjusted to within 1/1000 mm. The subsequent procedure for solar cell production consists of the following steps:
Doped wafers are first etched some micrometers deep. The procedure removes crystal structure irregularities caused by sawing and cleans the wafer. During the extraction of pure silicon the material is doped either as powdered polycrystalline silicon or by the addition of a suitable gas. This is then followed by diffusion. Phosphorus, supplied inside the material in gaseous form, diffuses at 800°C. The n-doped layer and the p-rich oxide layer form on top of the wafers as a result of reaction with oxygen.
The wafers are then folded to form a cube and etched in oxygen plasma, which removes the n-doped layer from the edges. Wet chemical etching then removes the oxide layers from the top of the wafer. At the rear, the contact surface is produced from silver containing 1% aluminum. Special procedures enable silver to be printed over mask on cell surface. The pressed cells are then sintered at high temperatures. A similar procedure is used to print the contacts on the front cell surface, and the anti-reflex layer is applied likewise. In this case titanium paste is used, which on sintering forms titanium dioxide TiO2 or silicon nitride Si or silicon nitride Si3NN4..
The surface of monocrystalline silicon photovoltaic cells enables almost 90% absorption of radiation and the highest efficiency of photoelectric conversion among silicon cells. The temperature of the cells and modules during operation depends on the intensity of the incident radiation, wind speed, air temperature, thermal properties of the installation components and may rise above 70oC at the irradiance of over 750 W/mC at the irradiance of over 750 W/m2 (Garcia Alonso, [1]) and 30 (Garcia Alonso, [1]) and 30oC is reached by a typical building-integrated PV placed on the roof at the ambient temperature of 10.9C is reached by a typical building-integrated PV placed on the roof at the ambient temperature of 10.9oC and the radiation intensity of 381 W/mC and the radiation intensity of 381 W/m2 (Lee et al. [2]). (Lee et al. [2]).
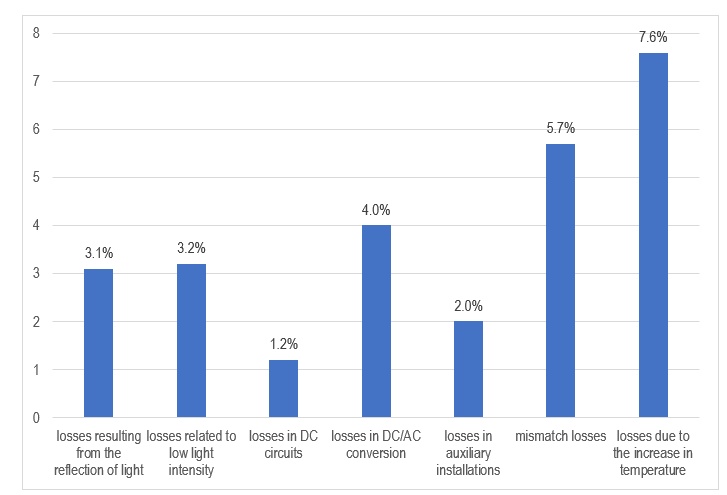
Energy losses in the photovoltaic conversion process include (Fig. 1.): losses resulting from the reflection of light, losses related to low light intensity, losses in DC circuits, losses in DC/AC conversion, losses in auxiliary installations, mismatch losses, losses due to the increase in temperature.
Poulek et al. [3] determined the frequency of reaching different temperature values of photovoltaic modules during the year for various locations for free-standing and roof-integrated installations. The operating temperature of free-standing PV modules practically does not exceed 70°C in an annual cycle, with the exception of hot climates. However, for roof-integrated installations, the situation is worse: while module temperatures do not exceed 80°C in cold and temperate climates, temperatures of over 80°C for 200 hours have been recorded in hot climates, and peak temperatures of over 90°C have been recorded [3].
Dubey et al. [4] analyzed the performance of silicon photovoltaic cells and modules as a function of temperature for different locations and found that the efficiency of PV modules decreases with increasing latitude, although for high latitudes the efficiency is higher due to lower temperatures (southern Andes, Himalayan region and Antarctica).
Therefore photovoltaic modules with less sensitivity to temperature are preferable for the high temperature regions and those more responsive to temperature will be more effective in the low temperature regions. An increase in temperature causes a decrease in PV conversion efficiency, a decrease in electrical output power and other physical parameters.
Thermal effects are described by specifying the NOCT (Nominal Operating Temperature) - the temperature of the module in SRE (Standard Reference Environment) conditions: at the incident radiation intensity of 800 W/m2, ambient temperature of 20, ambient temperature of 20oC and wind speed of 1 m/s and the temperature coefficients of the determined quantities characterizing electrical parameters of cells and modules.C and wind speed of 1 m/s and the temperature coefficients of the determined quantities characterizing electrical parameters of cells and modules.
NOCT is determined based on international standards, e.g. International Standard EN-61215 (2005) for modules illuminated with light falling perpendicularly to their surfaces without load. All these standards are based on the fact that the difference between the temperature of the module and the ambient temperature is practically independent of the temperature of the surrounding air and the strength of the wind, and changes in direct proportion to the intensity of the incident radiation. The following conditions do not meet this assumption: incident radiation intensity below 400 W/m2, wind speed outside the range of 1±0.75 m/s, ambient temperature outside the range of 20±15, wind speed outside the range of 1±0.75 m/s, ambient temperature outside the range of 20±15oC or its fluctuations greater than 5C or its fluctuations greater than 5oC within 10 minutes.C within 10 minutes.
The temperature of the module is determined by the relation:

where E is the intensity of the incident radiation in W/m2, t, tamb is the ambient temperature. is the ambient temperature.
This relationship does not take into account the construction of the module and the cover material. Based on the International Standard EN-61215 (2005), Garcia Alonso [1] determined the NOCT for the tested commercial modules of monocrystalline silicon photovoltaic cells from various manufacturers, obtaining a value of 49.2±1.1oC. The annual amount of electricity produced by a crystalline silicon photovoltaic module varies across Europe for different orientations (east to west) and tilt angles of the module (horizontal to vertical) as well as the use of modules with different NOCT values.C. The annual amount of electricity produced by a crystalline silicon photovoltaic module varies across Europe for different orientations (east to west) and tilt angles of the module (horizontal to vertical) as well as the use of modules with different NOCT values.
According to the formula (1), the module temperature is higher for modules with a higher NOCT value. The difference in NOCT values by 9oC translates into a difference in module temperature of 11.5C translates into a difference in module temperature of 11.5oC (at 1000 W/mC (at 1000 W/m2 radiation) (Bücher et al. [6]). radiation) (Bücher et al. [6]).
As a result of changing the NOCT value from (NOCT +3oC) to (NOCT-3C) to (NOCT-3oC), the annual efficiency of the module increases by 1.3% (data obtained on the basis of simulations using a program developed by CIEMAT). This allows us to conclude that after insolation, the temperature is the second factor determining the output power obtained from the PV module [7].C), the annual efficiency of the module increases by 1.3% (data obtained on the basis of simulations using a program developed by CIEMAT). This allows us to conclude that after insolation, the temperature is the second factor determining the output power obtained from the PV module [7].
With the change of temperature, the electrokinetic potential kT/e changes, and since it is present in most equations describing the properties of PV cells, one can talk about the direct influence of temperature changes on these properties. In the range of very low temperatures of PV cells, the thermal generation of electrons from the baseband to the conduction band practically does not occur, and the impurities are not ionized, so they do not provide charge carriers, i.e. the semiconductor does not conduct, and PV cells do not convert radiation into electric current. Along with the temperature change, the physical properties of the semiconductor material (silicon) from which the silicon cell is made also change. Hence, the relevant properties of PV cells and modules are indirectly changed.
The basic physical aspects of the decrease in output power and energy conversion efficiency for silicon photovoltaic elements, related to the increase in temperature, mainly include:
– increase in the frequency and amplitude of crystal lattice vibrations with increasing temperature, leading to an increase in scattering of charge carriers - electrons and holes - on phonons,
– decrease in the mobility of charge carriers μn and μp with increasing temperature,
– voltage drop of the built-in p-n junction and its ability to separate electrons from holes in photogenerated pairs due to the very strong temperature dependence of carrier concentration (ni2).
It should be noted, however, that many different quantities that determine the output electrical parameters of the operation of photovoltaic cells depend on the temperature and only some of them can be treated as constant (their variability is negligibly small) in the entire operating range, i.e. the practical use of crystalline PV elements. silicon. Others depend on many factors at the same time and the description of their variability using temperature coefficients is insufficient. For example, the recombination rate decreases with increasing temperature, but its value strongly depends on the doping level (Macdonald, Cuevas [8]).
The article presents research on the impact of temperature changes on the efficiency of photovoltaic conversion and on those parameters of crystalline silicon photovoltaic cells that have a decisive impact on this conversion. Thermally sensitive operating parameters of solar cells clearly determine the current-voltage characteristics and conversion efficiency of cells illuminated by a natural or artificial light source. The basic task was to perform accurate measurements and present the results of own research against the current state of knowledge on parameters such as: maximum output electrical power, short-circuit current and open-circuit voltage, series resistance, dark current, duty cycle of the current-voltage characteristic, efficiency, photovoltaic conversion of cells, as well as factors limiting the conversion efficiency and, consequently - the electrical power received by the user.
Theoretical considerations are also included regarding physical phenomena and quantum processes that determine the possible values of operating parameters of crystalline silicon photovoltaic cells, taking into account the effects related to heat transport in the cells during their operation.
It has been shown that the theoretical predictions resulting from the analysis of equations describing the mechanisms of photocurrent generation and flow are confirmed by the experimental studies carried out [9], [10].
The presented results indicate the importance of reducing the temperature of silicon photovoltaic cells in photovoltaic modules, regardless of their installation method: on the roof, building facade or as part of a photovoltaic power plant placed on the ground.
THE TEMPERATURE INFLUENCE MECHANISM ON THE EXPLOITATION PARAMETERS OF SILICON SOLAR CELLS
Quantum efficiency determines the efficiency of energy conversion of incident photons into photoelectric current. Also, determining the influence of the wavelength of the incident radiation on the photocurrent - spectral sensitivity - is a useful tool to determine the suitability of materials used in the production of photovoltaic cells. An increase in the cell temperature affects the spectral sensitivity: a shift of the maximum spectral sensitivity for the short-circuit current for silicon in the infrared range from 950 nm at tc=5=5oC to 1000nm at tC to 1000nm at tc=83=83oC is observed (Mosalam Shaltout et al. [11]). Shifting the point of maximum sensitivity of the cell with increasing temperature towards longer waves is of particular importance in the case of using anti-reflection optical coatings on the surface of cells operating at high temperatures. Spectral characteristics of the coating should be determined at cell temperature.C is observed (Mosalam Shaltout et al. [11]). Shifting the point of maximum sensitivity of the cell with increasing temperature towards longer waves is of particular importance in the case of using anti-reflection optical coatings on the surface of cells operating at high temperatures. Spectral characteristics of the coating should be determined at cell temperature.
The width of the band-gap decreases with the temperature increase. This enables the semiconductor material (silicon) to absorb additional photons with a higher wavelength or - in other words - lower energy (equation 2) (Klugmann-Radziemska [12]):

In addition, charge carriers generated deeply inside the material are used more efficiently due to the increased diffusion length. These effects lead to an increase of the photo - current. On the other hand, with decreasing width of the band gap, more charge carriers can surmount the band-gap, just by means of their thermal excitation.
The energy gap Eg depends on the electronegativity of the atoms that make up the crystal. The E depends on the electronegativity of the atoms that make up the crystal. The Eg gap, which occurs in the complex band structure of a semiconductor, is formed as a result of splitting the energy levels of isolated atoms (or molecules) when they come together in the process of crystal formation (crystallization). Under given external conditions, E gap, which occurs in the complex band structure of a semiconductor, is formed as a result of splitting the energy levels of isolated atoms (or molecules) when they come together in the process of crystal formation (crystallization). Under given external conditions, Eg is determined by both the atomic composition and the type of crystal lattice. The existence of an approximately linear relationship between the thermodynamic properties of the lattice, including the enthalpy change, as well as the heat of atomization ∆H (network energy), and the energy gap was found empirically: E is determined by both the atomic composition and the type of crystal lattice. The existence of an approximately linear relationship between the thermodynamic properties of the lattice, including the enthalpy change, as well as the heat of atomization ∆H (network energy), and the energy gap was found empirically: Eg = C = C.∆H , with ∆H = f(T) where C - coefficient of proportionality.∆H , with ∆H = f(T) where C - coefficient of proportionality.
The bandgap width of semiconductors as a function of temperature in a limited temperature range is given by the formula:

where Eg (300 K) is the band gap at 300 K, which for silicon is 1.12 eV (Wolf [13]). (300 K) is the band gap at 300 K, which for silicon is 1.12 eV (Wolf [13]).
On the other hand, a smaller energy gap can be overcome by a greater number of charge carriers generated by thermal activation, which results in an increase in the reverse saturation current, which is an important diode parameter and determines the change in the working parameters of the cells with temperature.
Singh and Ravindra [14] showed that the reverse saturation current increases with increasing temperature, which causes a decrease in Voc, FF and cell efficiency., FF and cell efficiency.
The absorption coefficient γ is closely related to the width of the energy gap, which changes linearly with the temperature in the region close to room temperature. It can be concluded that at higher temperatures, the depth of penetration of the cell material by photons is smaller, and consequently the cell sensitivity decreases with increasing temperature and at shorter wavelengths of the incident radiation (Woronkova [15]).
The mobility of charge carriers depends on two factors: on the effective mass of the charge carrier and on their interaction with the lattice, and is strongly related to the concentration of impurities and changes in temperature. In a doped semiconductor, carrier scattering takes place on donors and acceptors that have a large scattering cross section. An increase in the concentration of impurities causes a significant decrease in the mean free path of charge carriers and their mobility. At high temperatures, lattice scattering of charge carriers on phonons plays an important role, and then the effect of impurity concentration is less significant.
Since, as indicated above, both the concentration of intrinsic charge carriers and their mobility depend on temperature, then the resistivity of a semiconductor is also a function of temperature. The effect of temperature change on resistivity is different in different temperature ranges and at different levels of doping. The greater the concentration of impurities, the lower the resistivity and the smaller the change in resistivity with temperature change. At intermediate temperatures in the operating range of photovoltaic cells, the decrease in carrier mobility causes an increase in resistivity. Also significant temperature changes of the Fermi level in this range result in a high temperature coefficient of resistivity.
The open-circuit voltage Uoc of silicon photovoltaic cells is a maximum of 0.72 V and is limited by the effects of spontaneous recombination (Kerr et al. [16]). It is also strongly dependent on the operating conditions of the silicon cell: both on the characteristics of the radiation incident on the surface of the cell, and on the temperature of this cell. The value of the open-circuit voltage is, apart from the intensity of the incident radiation, important for obtaining the maximum power on the load resistance. The open-circuit voltage as a function of temperature is described by the relation (Carlson [17]): of silicon photovoltaic cells is a maximum of 0.72 V and is limited by the effects of spontaneous recombination (Kerr et al. [16]). It is also strongly dependent on the operating conditions of the silicon cell: both on the characteristics of the radiation incident on the surface of the cell, and on the temperature of this cell. The value of the open-circuit voltage is, apart from the intensity of the incident radiation, important for obtaining the maximum power on the load resistance. The open-circuit voltage as a function of temperature is described by the relation (Carlson [17]):

where Eg0=1.21 eV is the bandgap width of silicon at 0
K. Assuming that during the operation of the photovoltaic cells their
temperature increases to 340 K, then ln=1.21 eV is the bandgap width of silicon at 0
K. Assuming that during the operation of the photovoltaic cells their
temperature increases to 340 K, then ln

Differentiating equation (3) one obtains the change in open-circuit voltage per one degree change in temperature:

At the temperature T0 = 300 K, assuming the typical value (Bücher et al. [6]) U = 300 K, assuming the typical value (Bücher et al. [6]) Uoc(T(T0) = 0.55V for a single-crystalline silicon cell, we obtain from equation (6):) = 0.55V for a single-crystalline silicon cell, we obtain from equation (6):

i.e. the value of the temperature coefficient in accordance with the one given by Green [7], to which the values declared by the manufacturers of photovoltaic modules can be compared, striving for the lowest possible values.
The electric current (photocurrent) is directly related to the number of photons Nλ of wavelength λ incident on the cell per unit of time and to the quantum efficiency ηλ:

where r(λ) is the reflection coefficient from the upper surface absorbing the radiation. Introducing the expression for the irradiation power:

from equation (7) we get:


where:
Temperature is one of the decisive factors, both for losses and efficiency of photovoltaic conversion of PV cells.
The photovoltaic conversion efficiency is defined as the ratio of the maximum output electric power Pmax to the total power of the incident radiation, thus according to the formula (11): to the total power of the incident radiation, thus according to the formula (11):

where: FF- characteristic fill factor:

The characteristic fill factor is in practice the highest and close to unity for lower irradiation values and lower cell temperature and decreases both with the increase of irradiation and temperature.
This is the result of an increase in the series resistance of the cell, associated with an increase in both of these parameters.
The FF can be determined with sufficient accuracy from the formula given by Markvart et al. [18]:

where FF0 is here the fill factor of the ideal cell characteristic, and: is here the fill factor of the ideal cell characteristic, and:

which illustrates the influence of the series resistance rs on the fill factor of the characteristic and why the cells show an unexpected degradation of both the open circuit voltage U on the fill factor of the characteristic and why the cells show an unexpected degradation of both the open circuit voltage Uoc and the FF factor at higher series resistances. and the FF factor at higher series resistances.
According to the formula (14), the characteristic fill factor depends on the temperature both directly and indirectly through mid and U and Uoc..
As the temperature increases, the silicon band gap Eg decreases, according to formula (3), which allows the absorption of additional photons with a longer wavelength. The charge carriers generated by these lower-energy photons penetrate deeper into the semiconductor - they can be used due to the longer diffusion path. This leads to a slight increase in the short-circuit current I decreases, according to formula (3), which allows the absorption of additional photons with a longer wavelength. The charge carriers generated by these lower-energy photons penetrate deeper into the semiconductor - they can be used due to the longer diffusion path. This leads to a slight increase in the short-circuit current Isc. On the other hand, with decreasing width of the band gap, more charge carriers can surmount the band-gap, just by means of their thermal excitation.. On the other hand, with decreasing width of the band gap, more charge carriers can surmount the band-gap, just by means of their thermal excitation.
In the range of very low temperatures of PV cells, the thermal generation of electrons from the baseband to the conduction band practically does not occur, and the impurities are not ionized, so they do not provide charge carriers, i.e. the semiconductor does not conduct, and PV cells do not convert radiation into electric current.
RESEARCH METHODOLOGY
The primary task was to perform measurements and present the results of our own research against the current state of knowledge regarding parameters such as: maximum output power, short circuit current, open circuit voltage, series resistance, dark current, current-voltage characteristic fill factor, photovoltaic conversion efficiency of the cells, in order to identify factors limiting conversion efficiency and, consequently, the electrical power consumed by the user.
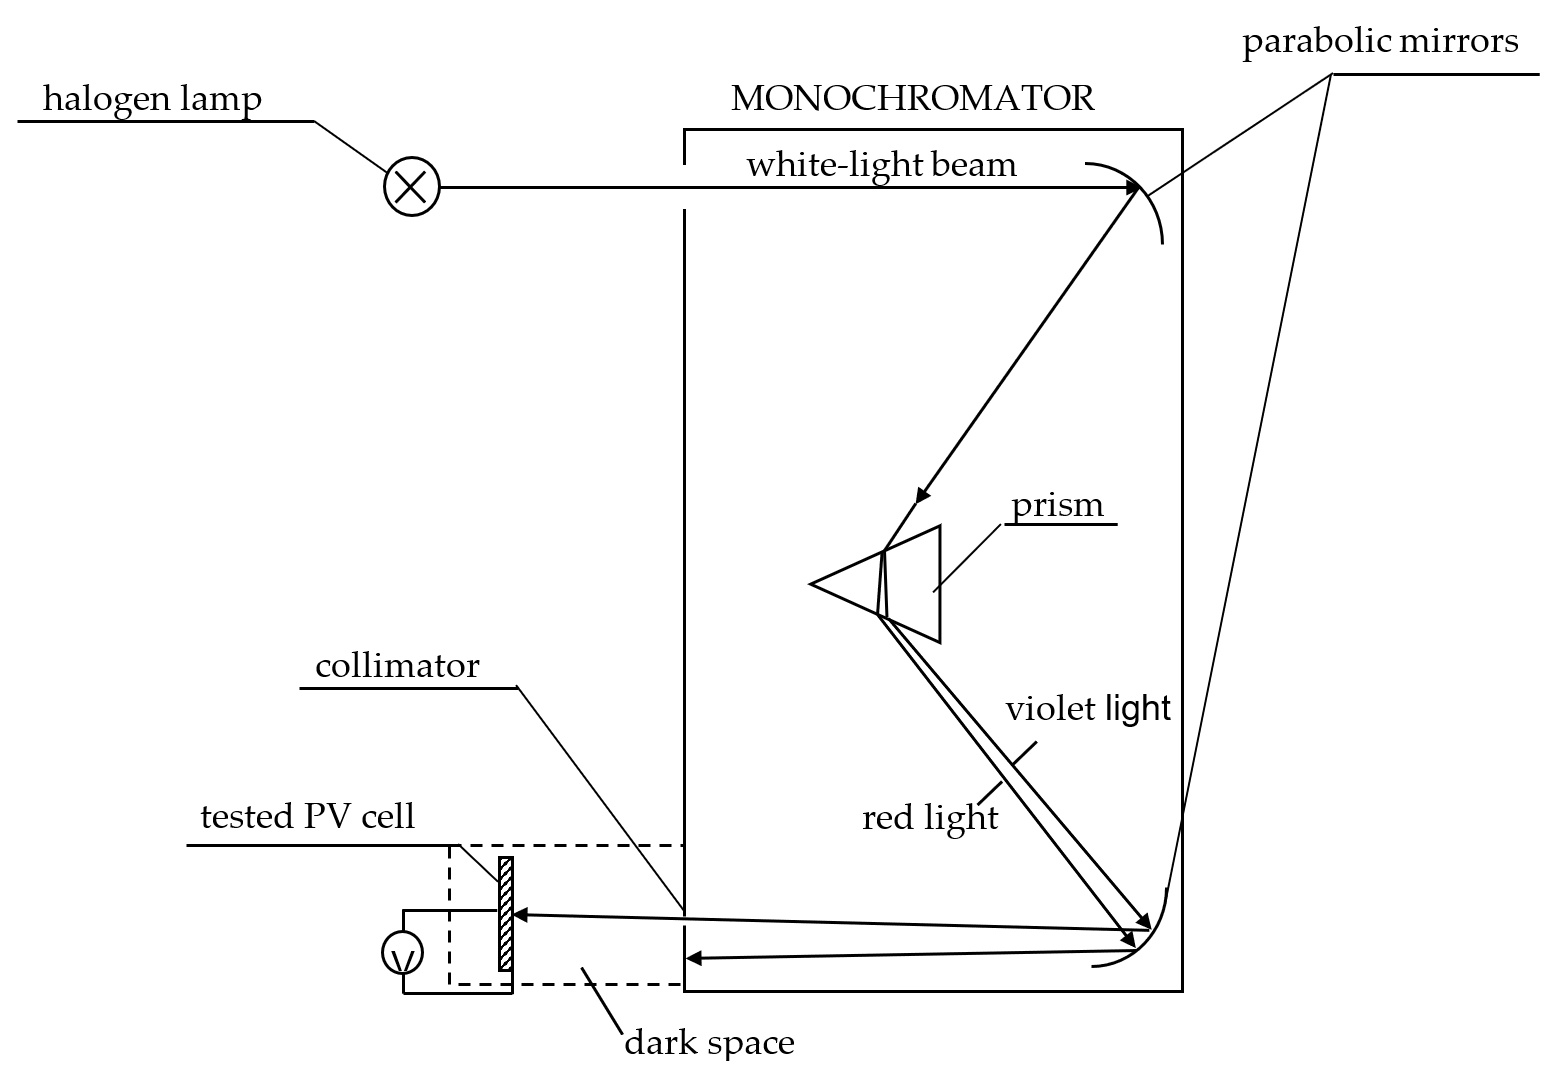
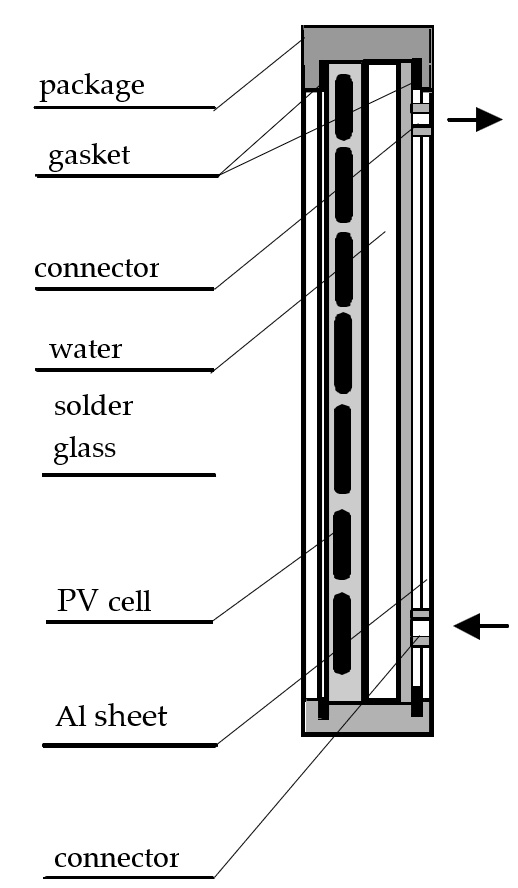
Measurement stations were built to test the cells in isothermal conditions in a wide range of temperatures, typical for terrestrial applications, and a hybrid system of a photovoltaic module with a PV/T water solar collector: measurement station enabling temperature stabilization and regulation on the entire surface of the tested cell with temperature sensors and computer reading and data acquisition - a stand for testing solar cells and silicon diodes in an optical darkroom with a temperature control and stabilization system (Fig.2.) (Klugmann-Radziemska [12]); station for determining current-voltage characteristics when cells are illuminated with sunlight and artificial light (incident radiation intensity values from 600 to 800 W/m2) in the temperature range from 293 K to 353 K (Fig. 3.) (Klugmann [19]); a monochromator system with an optical darkroom and a halogen light source for measuring the spectral characteristics - the voltage of the open circuit of a crystalline silicon cell as a function of the wavelength of the incident radiation (Fig. 5.) (Radziemska [20]); a stand for testing the energy efficiency of a hybrid system in which the photovoltaic module is cooled with water (Fig. 6) (Klugmann [19]).) in the temperature range from 293 K to 353 K (Fig. 3.) (Klugmann [19]); a monochromator system with an optical darkroom and a halogen light source for measuring the spectral characteristics - the voltage of the open circuit of a crystalline silicon cell as a function of the wavelength of the incident radiation (Fig. 5.) (Radziemska [20]); a stand for testing the energy efficiency of a hybrid system in which the photovoltaic module is cooled with water (Fig. 6) (Klugmann [19]).
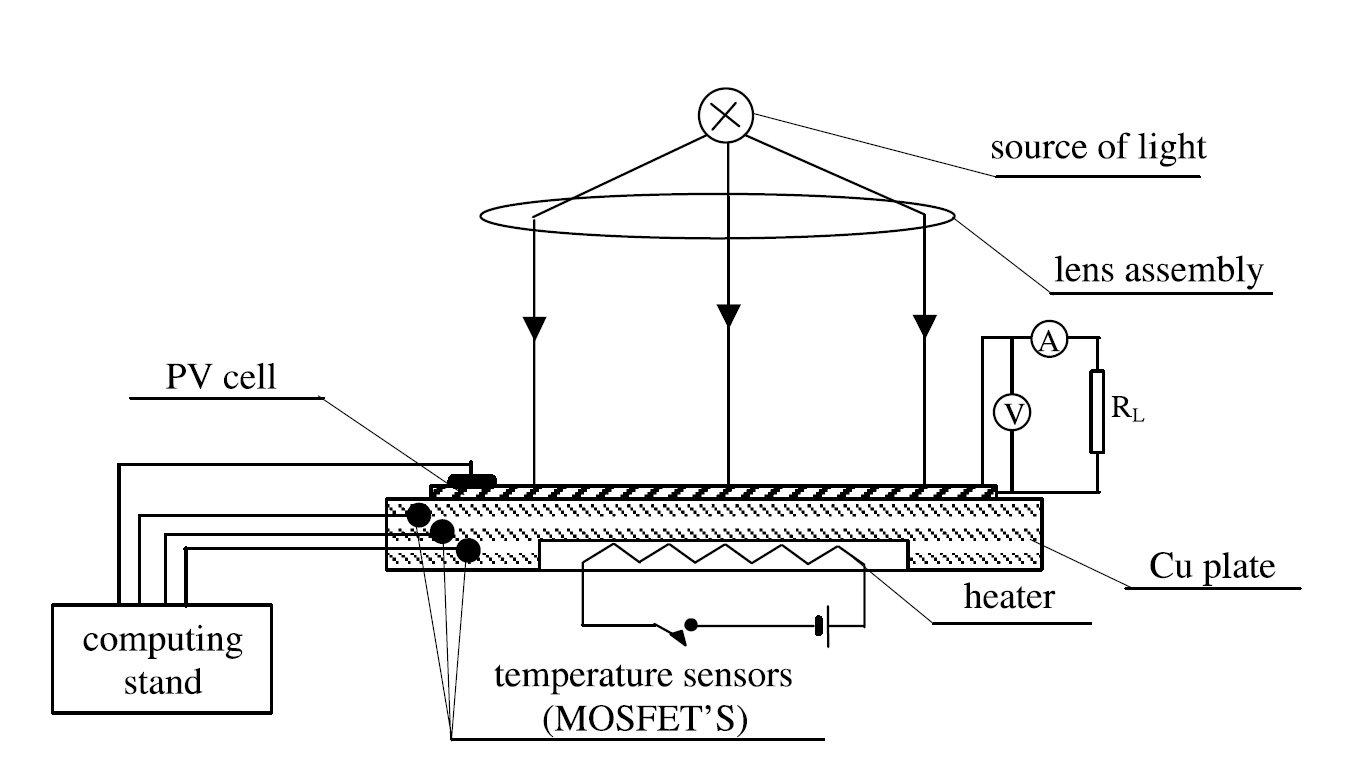
Fig. 2. A stand for testing solar cells and silicon diodes in an optical darkroom with a temperature control and stabilization system
The first experimental stand consisted of a 10 mm thick copper plate, the task of which was to ensure isothermality over the entire surface of the tested elements. The electric heater was powered by a stabilized DC power supply.
The measurement of the temperature of the lower and upper surfaces of the tested PV cells or photodiodes was carried out using transistors (MOSFET) with computer reading and recording of data with an accuracy of ±0.1K. The light source was a halogen lamp with a power of 400 W, placed at the focus of the converging lens in order to uniform illumination of the tested elements. A class 0.1 decade resistor with a resistance of 0.1Ω to 10kΩ was used as the load resistance RL..
At the station for determining the spectral characteristics, the light source was a halogen lamp with a monochromator system. A beam of white light from a halogen lamp, after passing through the monochromator, fell on the tested silicon cell. For different positions of the monochromator mirrors, the dependence of the open circuit voltage Uoc on the wavelength of the incident radiation λ was determined. on the wavelength of the incident radiation λ was determined.
In order to determine the operating parameters of the silicon photovoltaic cell module as a function of temperature in the hybrid system, a photovoltaic module, consisting of 72 cells connected in a series-parallel system, was glued to an aluminum plate (3 mm thick), maintaining a distance of 8 mm. The capacity of the space between the cells and the plate was 11.88 dm3. Two aluminum stubs were welded to the aluminum plate at the top and bottom to supply and discharge thermostated cooling water, which is the working medium of the thermal collector. The system was built in an aluminum frame. The frame was mounted on wheels and it was possible to adjust the angle of inclination to set it perpendicular to the direction of the sun's rays. The absorber of the module (solar collector) obtained in this way is the dark blue surface of silicon cells placed between two glass plates. To increase this area, a panel with square cells was used, which - although more expensive - provides better space utilization than round cells.. Two aluminum stubs were welded to the aluminum plate at the top and bottom to supply and discharge thermostated cooling water, which is the working medium of the thermal collector. The system was built in an aluminum frame. The frame was mounted on wheels and it was possible to adjust the angle of inclination to set it perpendicular to the direction of the sun's rays. The absorber of the module (solar collector) obtained in this way is the dark blue surface of silicon cells placed between two glass plates. To increase this area, a panel with square cells was used, which - although more expensive - provides better space utilization than round cells.
The series resistance was determined using the measurement system shown in Fig. 3 from the slope of the dark characteristic Idark(U) in region B of the graph (Fig. 4) based on the equation:(U) in region B of the graph (Fig. 4) based on the equation:

It can be seen that series resistance affects the shape of the characteristic only in region B at current I’ and ∆U = I’rs, and for high current values, it leads to a deviation from the ideal characteristic in region C., and for high current values, it leads to a deviation from the ideal characteristic in region C.
Current-voltage characteristics were determined for various values of the intensity of incident solar radiation by simultaneously measuring the water temperature at the inlet and outlet of the collector using copper-constantan thermocouples with a computer data acquisition system and the flowing water stream.
The obtained results were compared with review articles: Singh, Ravindra [14], Sun et al. [21]), Sandness, Rakstad [22].
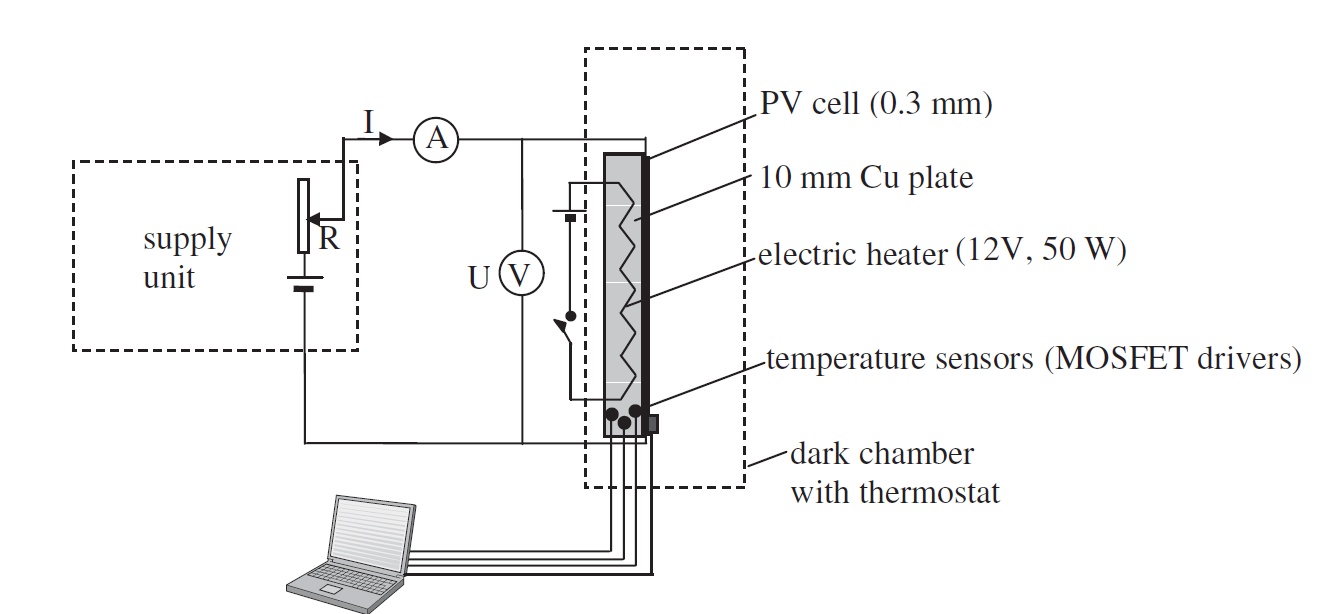
Fig. 3. A station for determining current-voltage characteristics in different temperatures without illumination
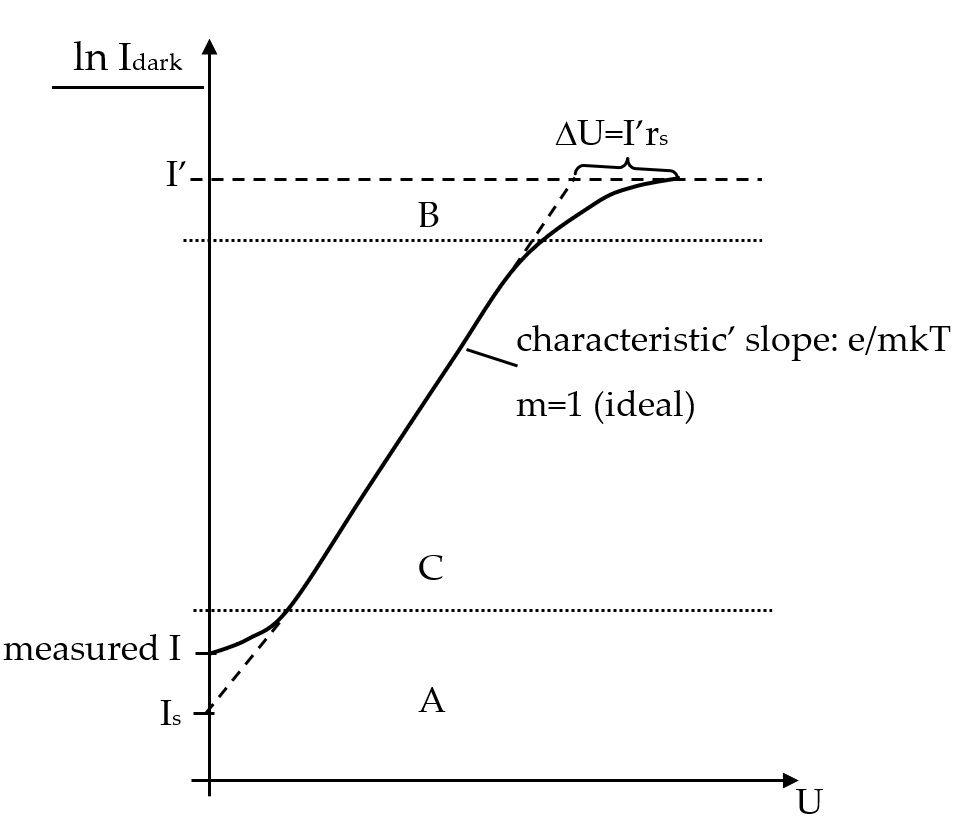
Fig. 4. Semilogarithmic plot of the dark Idark(U) characteristic in the forward direction on the base of the equivalent one-diode model in the range of low currents (A), high currents (B) and average (diffusion) currents (C)
RESULTS
Influence of temperature increase on photovoltaic conversion efficiency of a PV cell
Under illumination the fourth quadrant of the light I-U is the region of interest and the figures of merit for the device are: the open-circuit voltage (Uoc) – the maximum voltage obtainable under open-circuit conditions, the short-circuit current (I) – the maximum voltage obtainable under open-circuit conditions, the short-circuit current (Isc) – the maximum current through the load under short-circuit conditions, Fill Factor FF.) – the maximum current through the load under short-circuit conditions, Fill Factor FF.
As a result of the measurements, it was found that during the operation of photovoltaic cells, their temperature increases, which reduces the energy gap, which causes a slight increase in the short circuit current and a significant decrease in the open circuit voltage, the characteristic fill factor, and consequently: the cell efficiency. This is consistent with the reports presented by Singh and Ravindra [14].
The corresponding uncertainties of the temperature coefficients were estimated. The measurement uncertainty was calculated for each point on the current-voltage characteristic. Linear dependencies of the parameter values with increasing temperature were determined. The coefficient of determination R2 of the regression is very close to 1. The measurement uncertainty for the temperature value T of the photovoltaic cells is determined based on several sources of uncertainty, such as the thermometer's resolution and accuracy. The maximum error is 0.25°C within the temperature range relevant to the problem under study (15-80°C). However, the difference between the actual cell temperature and the measured temperature of the module's rear surface has by far the greatest impact on the measurement error. of the regression is very close to 1. The measurement uncertainty for the temperature value T of the photovoltaic cells is determined based on several sources of uncertainty, such as the thermometer's resolution and accuracy. The maximum error is 0.25°C within the temperature range relevant to the problem under study (15-80°C). However, the difference between the actual cell temperature and the measured temperature of the module's rear surface has by far the greatest impact on the measurement error.
The output voltage of the photovoltaic cell is only slightly dependent on irradiance, while the current intensity increases with intensity of insolation. The working point of the solar cell therefore depends on load and insolation. In addition, the output voltage of a solar cell is temperature-dependent. A higher cell working temperature leads to lower output, and hence to lower efficiency.
The level of efficiency indicates how much of the radiated quantity of light is converted into usable electrical energy. Both the intensity of incident radiation and the cell temperature influence the current-voltage characteristics measured at constant radiation intensity, and consequently the key parameters: short circuit current, open circuit voltage, characteristic fill factor, maximum power and photovoltaic conversion efficiency (Fig. 7).
An increase in temperature reduces the energy conversion efficiency of all types of solar cells except: organic cells, for which a weak maximum conversion efficiency is observed near 40oC and amorphous silicon cells (a-Si:H), which after heating have an inverse temperature dependence, i.e. the efficiency increases with the increase of temperature; however, after irradiation, their efficiency decreases again with increasing temperature and stabilizes at a lower level [23]. This Staebler-Wroński degradation effect causes the efficiency to drop to about 40% of the initial value.C and amorphous silicon cells (a-Si:H), which after heating have an inverse temperature dependence, i.e. the efficiency increases with the increase of temperature; however, after irradiation, their efficiency decreases again with increasing temperature and stabilizes at a lower level [23]. This Staebler-Wroński degradation effect causes the efficiency to drop to about 40% of the initial value.
Efficiency changes as a function of temperature can be quantified by the coefficient of relative temperature changes in efficiency:

For small temperature changes near 300 K:

Efficiency changes as a function of temperature can be quantified by the coefficient of relative temperature changes in efficiency:

For small temperature changes near 300 K:

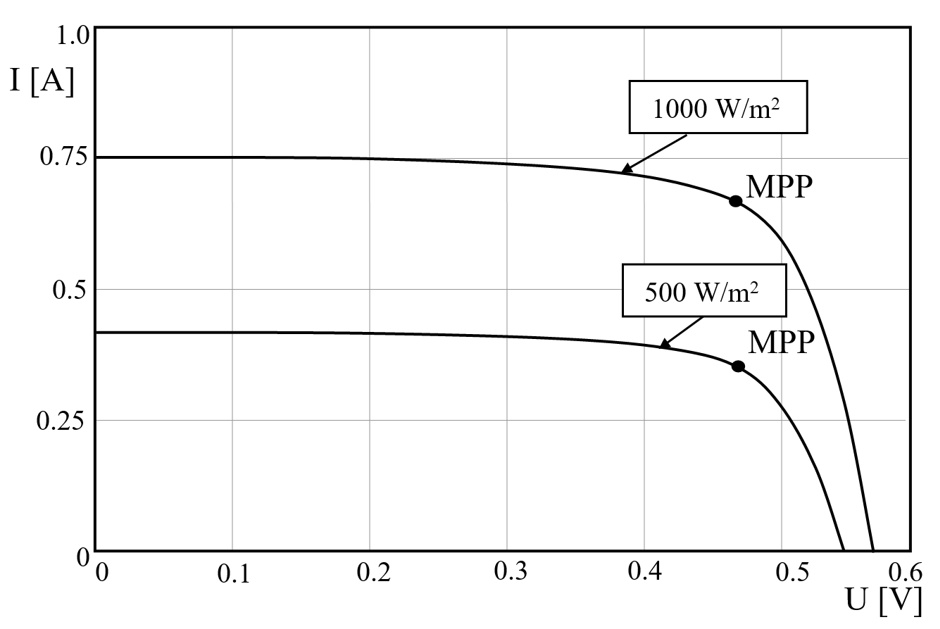
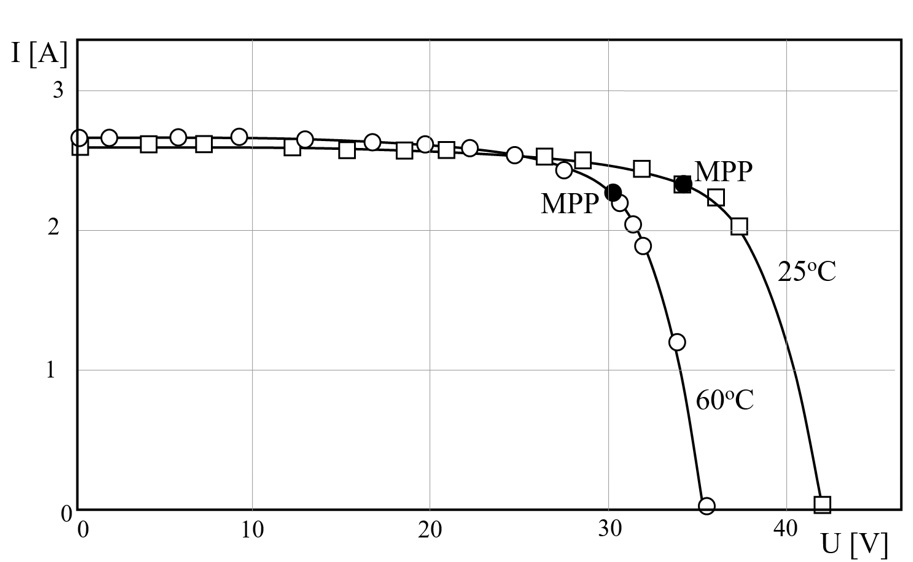
Fig. 7. Exemplary current-voltage characteristics, measured for different incident radiation and in different temperatures [20]
The most important physical properties of crystalline silicon, which change with increasing temperature, are the decreasing energy gap and the increasing lifetime of minority carriers. The increase in temperature also causes a significant decrease in the barrier voltage of the p-n junction potential of the photovoltaic cell and the separation capacity of this junction [12]. This results in a slight increase in current and a significant decrease in voltage, visible in the Figure 7, which compares the characteristic curves measured at different temperatures.These phenomena cause also a slight increase in the cell short circuit current [24].
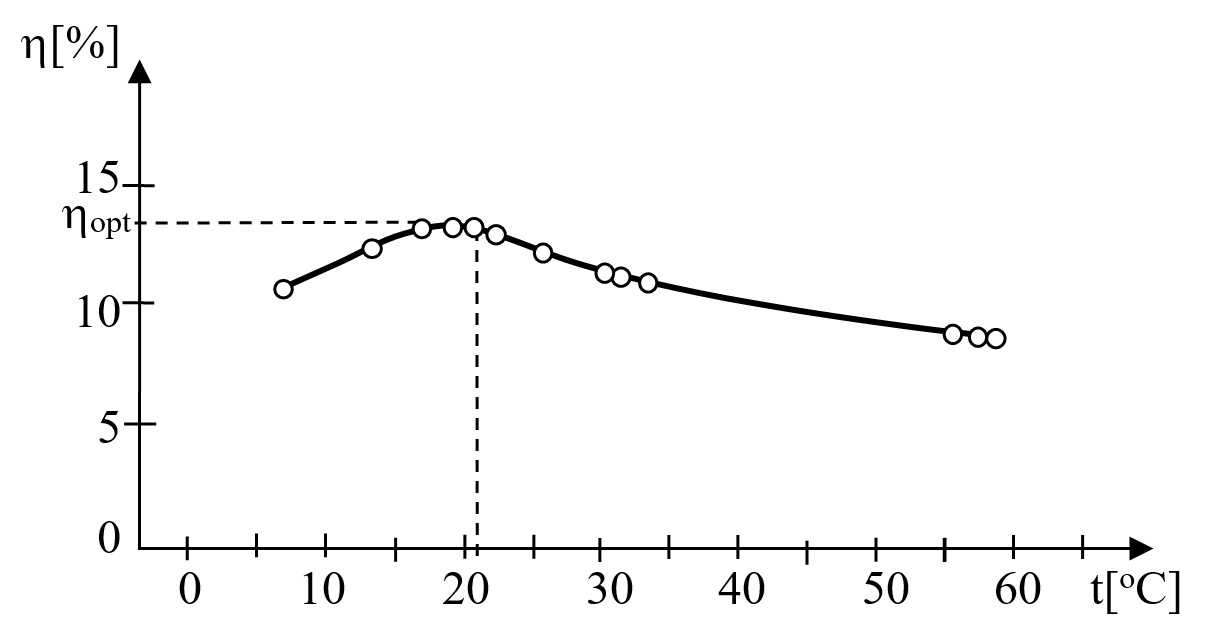
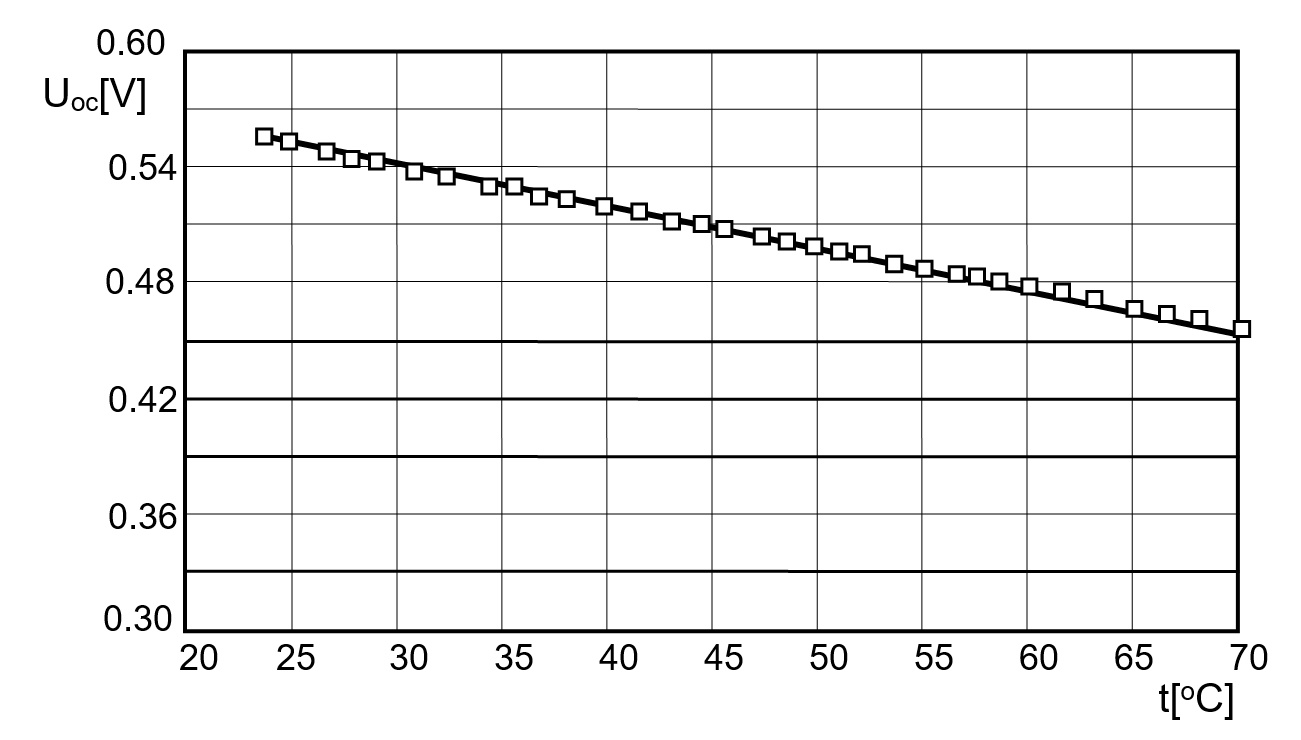
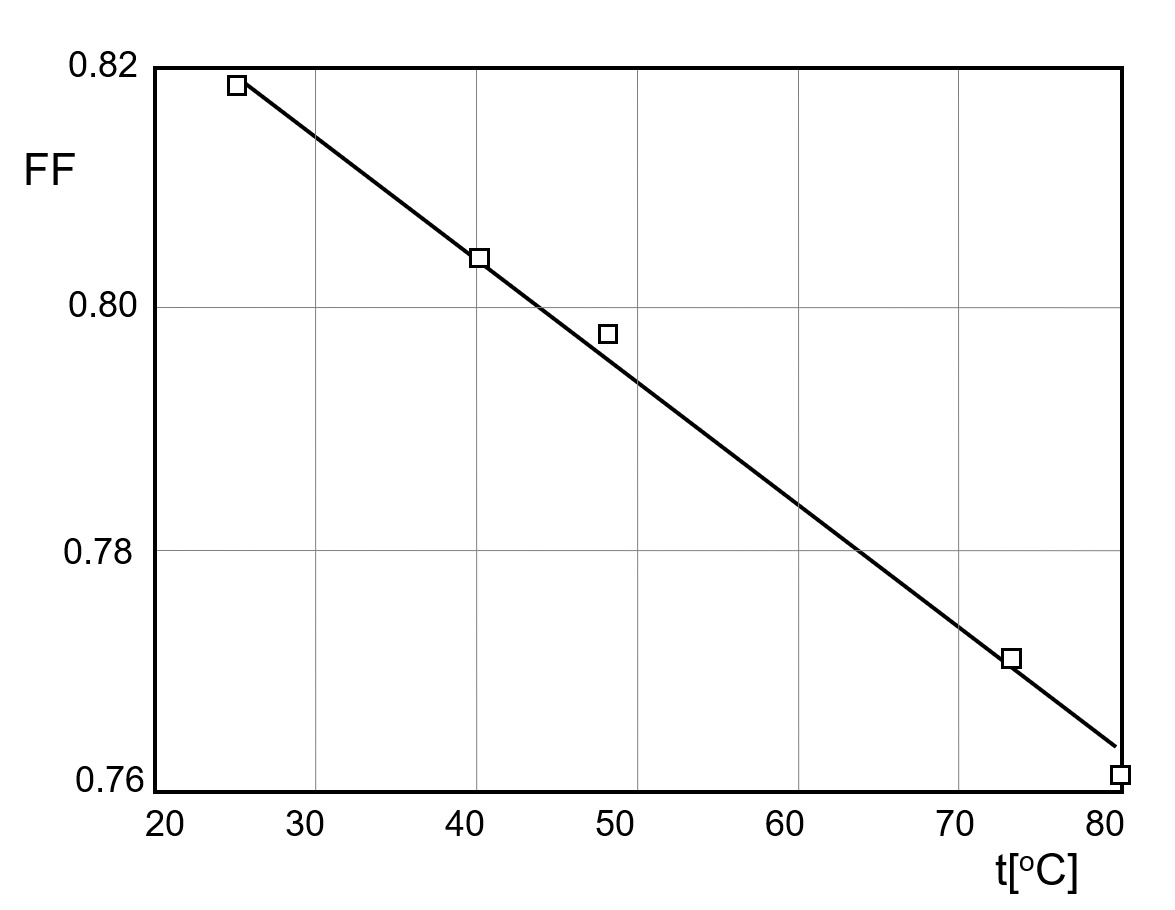
Figures 8-10 show the crystalline solar cell efficiency, open circuit voltage, and fill factor as a function of cell temperature.
Assuming linear changes in these parameters over the temperature range of 25°C-80°C, the temperature coefficients (TC) of the working parameters of photovoltaic cells were determined.
Temperature coefficients of working parameters of photovoltaic cells
Measurements of temperature coefficients (TC) using various continuous light sources and the pulsed solar simulator SPIRE 240A were carried out by Emery et al. [25]. He represented these coefficients with a common formula (19) and (20):


where Z is the measured parameter.
For crystalline silicon, he obtained the following values on this basis:




while for example, one of the best: SunPower's solar modules have a power temperature coefficient of -0.34% /°C. This means is that for every 1°C above 25°C, the efficiency of SunPower's solar modules decreases by 0.37%.
King et al. [26] obtained coefficients for crystalline silicon calculated on the basis of measurements in natural conditions of sunlight illumination:



which is consistent with the measurements presented by Klugmann-Radziemska [12] and by Shell Solar and SOLARTEC manufacturers:

Based on the data collected by a group of specialists from the University of Opole (Rodziewicz et al. [23]), the value of the open-circuit voltage temperature coefficient for silicon photovoltaic cells is:

which is consistent with the measurements presented in the article
(Klugmann-Radziemska [12]): - 0.38
The temperature coefficient of mobility of electrons and holes for silicon is (Wolf [13]):


which means that the mobility of carriers decreases monotonically with increasing temperature.
The temperature does not have a significant effect on the short-circuit current density (Shimizu [27]), because, as results from the measurements of a single-crystalline silicon cell (Klugmann-Radziemska [12]):

which is consistent with the measurements of Hall [28] and the cell
manufacturer SOLARTEC, which states:
On the basis of laboratory measurements made in a thermostatic system, the temperature efficiency coefficient for silicon solar cells was determined, in accordance with equation (17):

what is a measure of the decrease in the photovoltaic conversion efficiency of silicon cells per unit temperature increase. This value is similar to that given by Sandnes and Rekstad [22]: -0.06 %/K.
A summary of the obtained temperature coefficients of electrical parameters of silicon photovoltaic cells is presented in Table 1.
Tab. 1
Comparison of temperature coefficients of electrical parameters of silicon photovoltaic cells
Coefficient | Formula | Value [%/K] | Source |
temperature coefficient of maximum power |
| -0.4 -0.52 -0.48 -0.62 -0.38 | [25] [26] [30] [31] [33] |
temperature coefficient of open cell voltage |
| -0.3 -0.39 -0.352 -0.38 -0.37 -0.334 -0.28 | [25] [26] [23] [12] [30] [32] [33] |
temperature coefficient of short circuit current |
| 0.025 0.03 0.03 0.039 0.069 0.06 | [25] [26] [30] [32] [33] |
temperature coefficient of fill factor |
| -0.15 -0.2 | [25] [29] |
temperature efficiency coefficient for silicon solar cells |
| -0.085 -0.06 | [12] [22] |


The presented data demonstrates the need for the most efficient heat removal from the module to maintain the lowest possible cell temperature. The thermal conductivity coefficient of silicon photovoltaic cells was determined.
For temperatures ranging from 0 to 100oC, it ranges from 80 to 150 W/(mC, it ranges from 80 to 150 W/(m.K), meaning they conduct heat quite well, allowing for heat removal from the module's rear wall.K), meaning they conduct heat quite well, allowing for heat removal from the module's rear wall.
Both the above results and the conclusions presented by Sun et al. [22] indicate the need to reduce the temperature of photovoltaic modules. Such solutions already exist on the market (water cooling, air cooling, and the use of phase change materials) and are still the subject of ongoing research.
CONCLUSIONS
The article shows a direct negative impact of temperature increase on individual parameters and the output power obtained as a result.
Solar cells and photovoltaic modules work best at a certain temperature, characteristic of the material from which they are made.
Silicon is a good photovoltaic material at temperatures close to or below 298 K. At high temperatures the conversion efficiency of the cell decreases so that at 473 K it drops to 5% of the value corresponding to 298 K.
Knowledge of the temperature coefficients of different modules is key in selecting the appropriate photovoltaic module for a particular purpose at a particular site.
Due to the significant temperature dependence of the con-version efficiency of the silicon module, its cooling is beneficial as it results in the removal of the total thermal energy from absorption of those photons that are not involved in the generation of electron-hole pairs, indirect and direct pair recombination and Joule’s heat of the photoelectric current.
The obtained results provide practical advice for designers and users of photovoltaic installations, clearly indicating that it is beneficial to reduce the operating temperature of photovoltaic cells by cooling them. An effective way to counteract this unfavorable phenomenon is to remove thermal energy, which reduces their temperature and, consequently, increases the output power. It is worth considering the use of hybrid systems in which photovoltaic cell modules are cooled by water or air, and the heat carried by the cooling medium can be used in heating or air conditioning of buildings.
In order to limit the temperature increase of photovoltaic cells included in the modules integrated with the building (BIPV installations), it is necessary to provide adequate ventilation on the back of the module, leaving at least a gap between the module and the structural element of the building (roof, wall).