
Introduction
Implant failure is a common occurrence in small animal orthopedics, yet reports on its risk factors are scarce. Identifying these risk factors could significantly enhance clinical outcomes for patients. Abnormal fracture healing has been suggested to correlate with implant failure, which has been documented in 17-23% of fracture cases in small animal veterinary medicine [10, 18]. Implant related complications consist of: plate breakage, plate bending, screw pull-out and intramedullary pin migration [8].
Plate bending and breakage are most likely related with use of undersized plates, inadequate plate span ratio (PSR: ratio between the plate length over the overall fracture length), and an insufficient working length (WL: number of empty screw holes between the proximal and distal screws closest to the fracture). It is however unclear if plate WL affects stiffness and resistance to fatigue failure. A recent in vitro investigation, utilizing a femoral fracture gap model stabilized with a 2.4 mm locking compression plate (LCP), determined that plate width-to-length ratio (WL) did not impact stiffness, gap motion, or resistance to fatigue. Both short and long plate WL configurations were deemed suitable for clinical use [5]. Additionally, alongside considering the biomechanical properties of the plate itself, various biological factors, such as the age of the dog, fracture localization, open fracture nature, and the type of approach, could contribute to delayed bone healing and subsequent plate fatigue breakage. The screw pull-out is usually the result of incorrect screw insertion into the plate. Achieving proper screw-plate locking relies on two surgeon-dependent factors: drilling bone holes at appropriate angles using dedicated guides and applying optimal insertion torque during final tightening to prevent either screw loosening or cold-welding [8].
Contradictory findings exist regarding the time required for clinical union in veterinary medicine when comparing open reduction internal fixation (ORIF) and minimal invasive plate osteosynthesis (MIPO). Two studies comparing these techniques for repairing tibial and radius/ulna fractures in dogs found no significant difference between the treatment groups [4, 12]. However, in another study assessing the healing of canine radial fractures treated with ORIF or MIPO using radiographic and ultrasonographic methods, fractures treated with MIPO healed approximately twice as quickly as those treated with ORIF. Additionally, MIPO-treated fractures exhibited significantly greater callus formation [13].
Implant biocompatibility refers to the ability of implant materials to elicit a positive response within a specific biological context and for a particular purpose. This characteristic hinges on both the corrosion resistance and the cytotoxicity of any resultant corrosion products.
Corrosion entails the gradual loss of metallic ions from a metal surface into the surrounding environment. Various types of corrosion can occur. It's imperative for implant biomaterials to possess corrosion resistance to prevent adverse effects. Corrosion can lead to surface roughening, compromised structural integrity of the implant, release of metallic elements or alloys, and potential toxic reactions. Additionally, nearby tissues may exhibit discoloration, and patients might experience allergic reactions due to the release of these elements [11].
Metal implants in biological environments are prone to different types of corrosion. Pitting represents a severe localized corrosion attack resulting in substantial damage and the release of significant amounts of metal ions. This phenomenon involves the formation of small cavities or holes on a material's surface, which would otherwise be protected by a durable, self-repairing passive film. The initiation of such pits is often attributed to the interaction of specific aggressive ions with areas where the film is defective or weak. While some pits may be visible to the naked eye, they are generally imperceptible and pose a serious risk as they can facilitate the development of stress corrosion cracking (SCC) or fatigue cracks, potentially leading to catastrophic component failure during service. The severity of pitting largely hinges on the quality of the surface layer or film formed due to the material's interaction with its environment [6].
Corrosion fatigue denotes the fracture failure of metal resulting from the combined effects of electrochemical reactions and cyclic loading. Resistance to corrosion fatigue is a critical consideration for load-bearing surgical implant metals or metals utilized in applications involving repetitive motion. While failures may not typically occur, cracks can originate from concealed imperfections, surface irregularities, minute defects, chemical exposure, and other factors. The corrosive surroundings can exacerbate the impact of these imperfections by inducing localized corrosive attack [14].
Stress corrosion cracking (SCC) refers to the formation of cracks due to the simultaneous action of mechanical stress, often static and tensile, and chemical factors in al-loys, frequently involving chlorides. This phenomenon arises when external stress, such as static tensile stress or residual stresses from manufacturing processes, combines with a reactive environment.
Crevice corrosion, a type of corrosion linked to structural features, occurs when a metal surface is partially shielded from its surroundings. It typically manifests beneath the head of a screw securing a plate or in similar locations, such as the junction be-tween components of two pieces or a hip nail. The prerequisite for this process is the presence of a crevice—a narrow, deep fissure—either at an interface between device parts, like between a plate and a screw head, or due to defects such as fatigue cracks.
So far, few studies have been devoted to the topic of the quality of metal implants used in animal treatment. Therefore, the purpose of this study is to evaluate the physical and chemical properties of Ti6Al4V alloy implants in the treatment of hip dysplasia. At the same time, the scope of the conducted research will enable preliminary determination of biocompatibility of the tested implants [9].
Materials And Methods
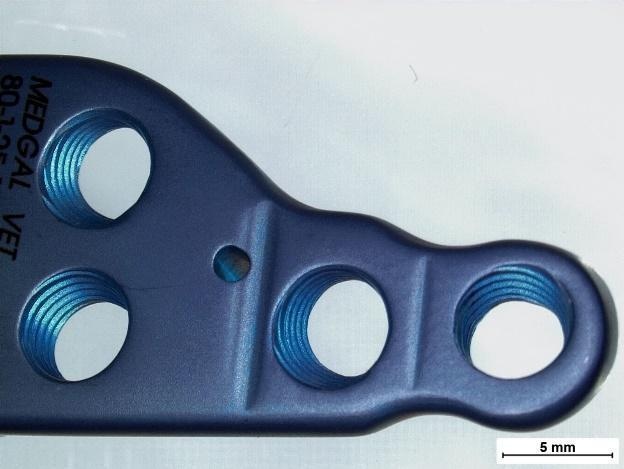
The research material was a titanium alloy designed for Double and Triple Pelvic Osteotomies (DPO/TPO) surgical technique.
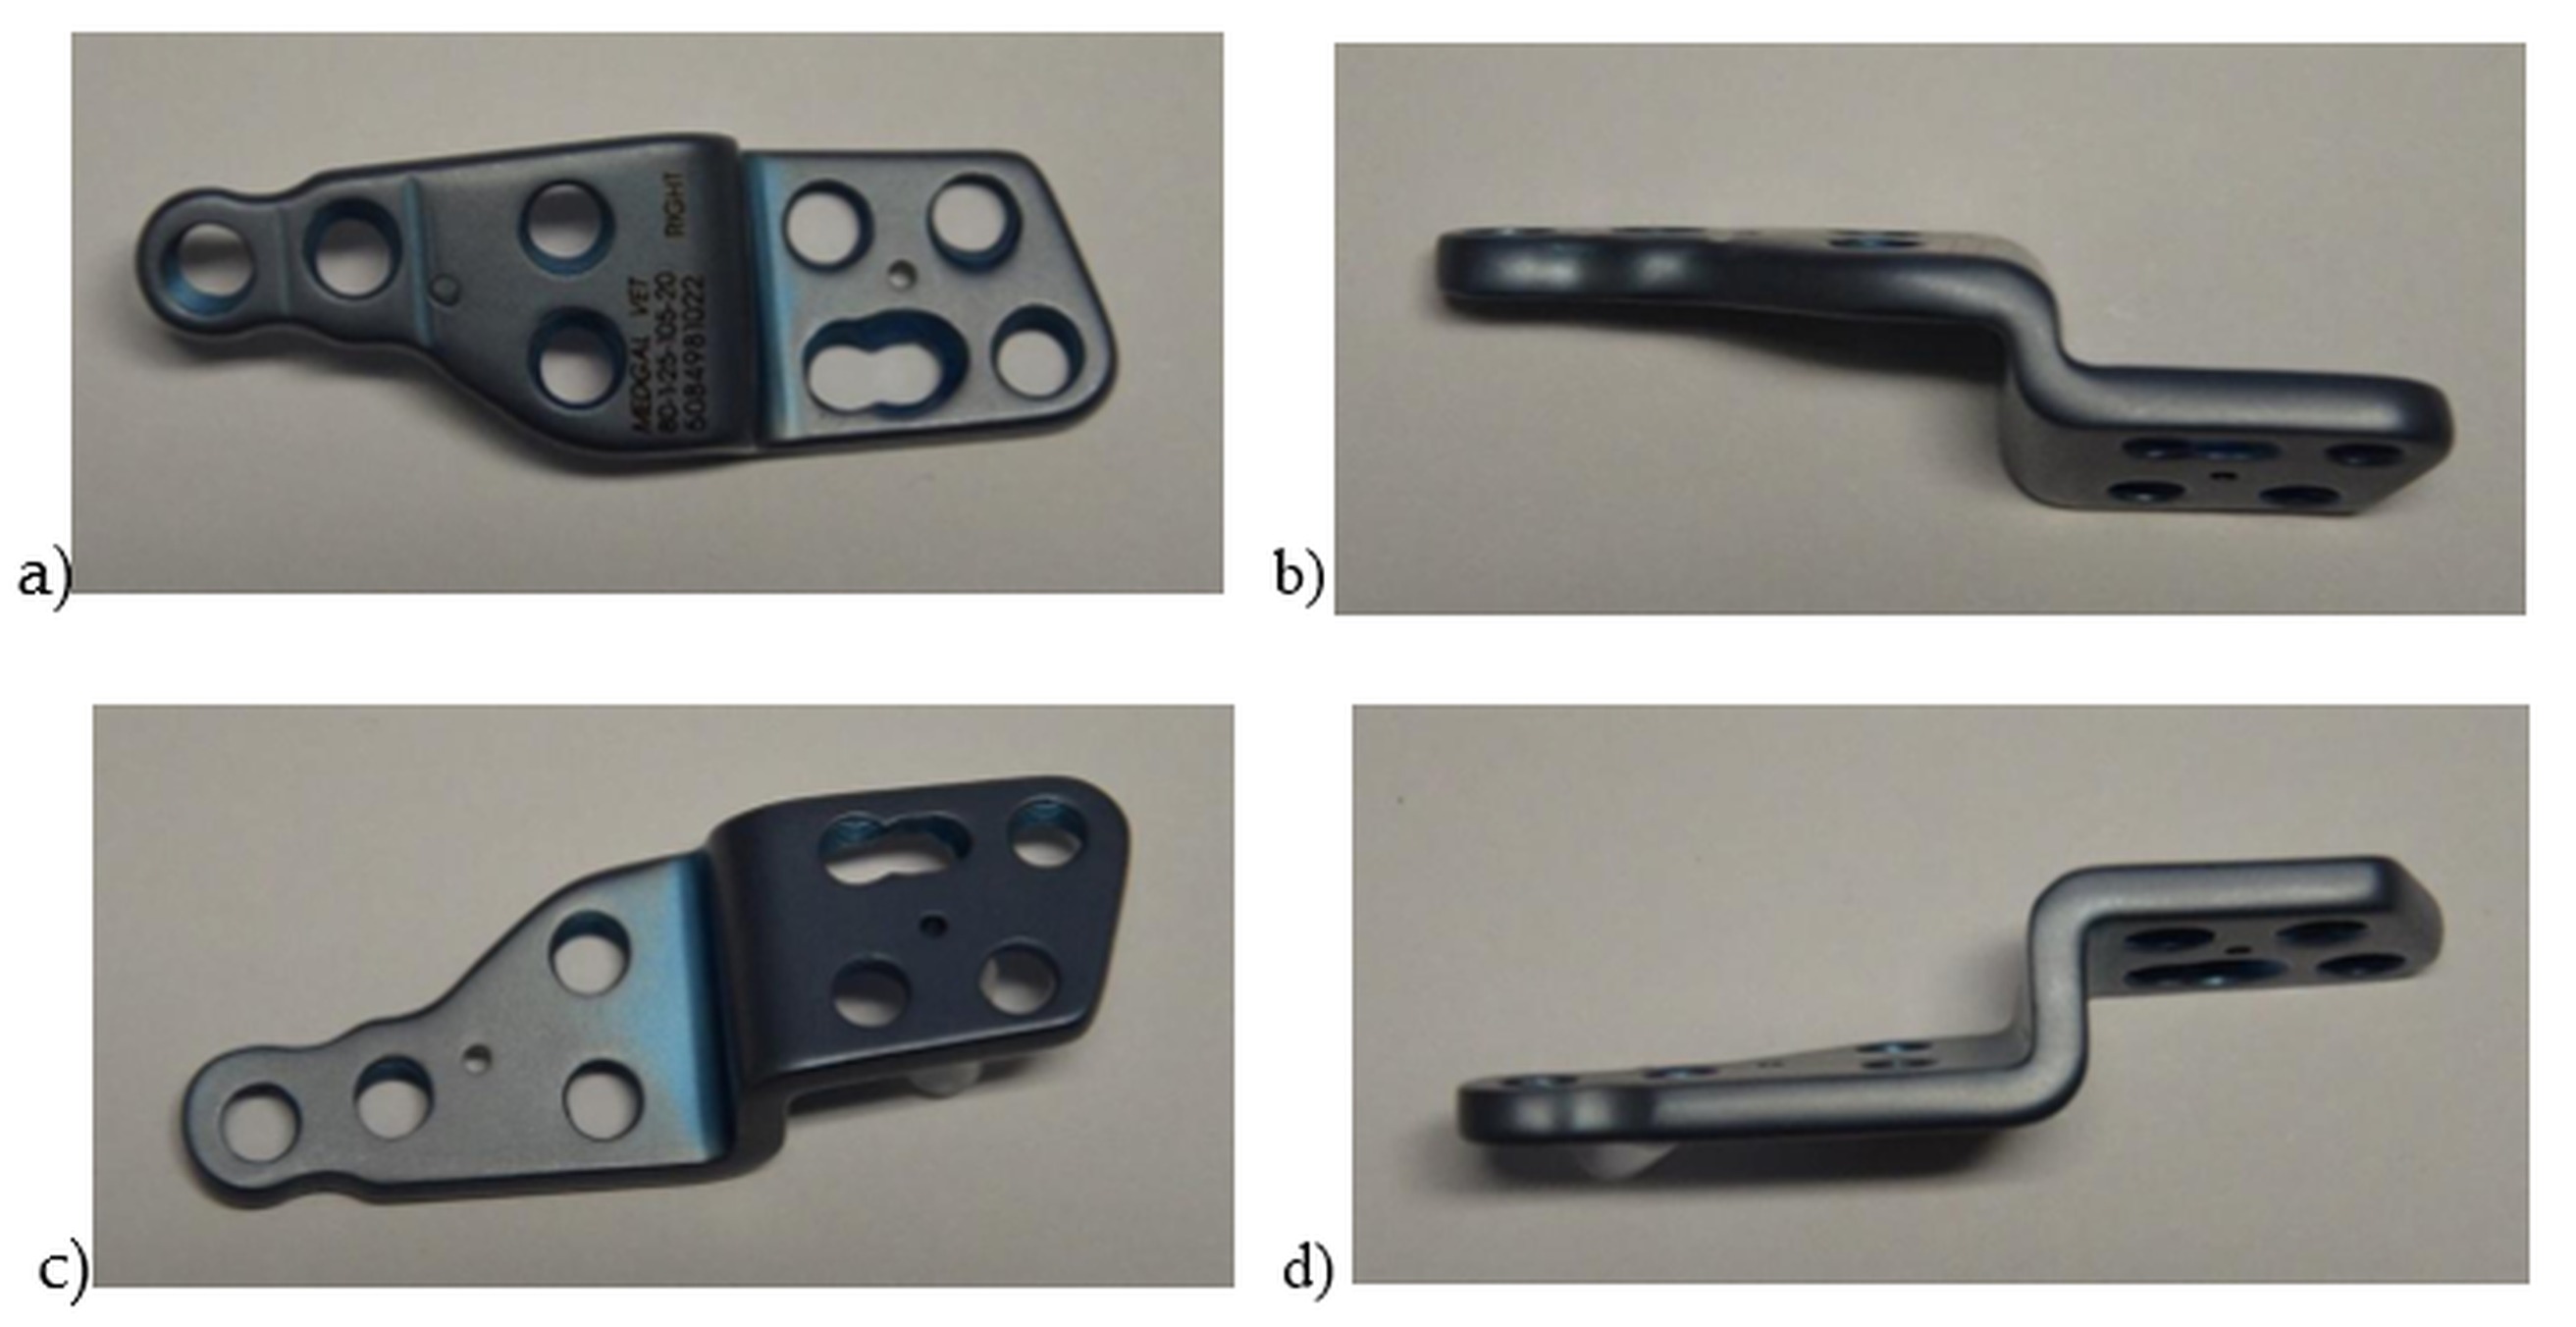
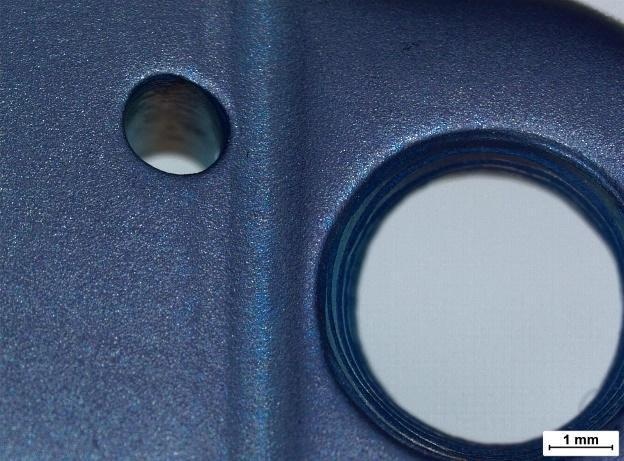
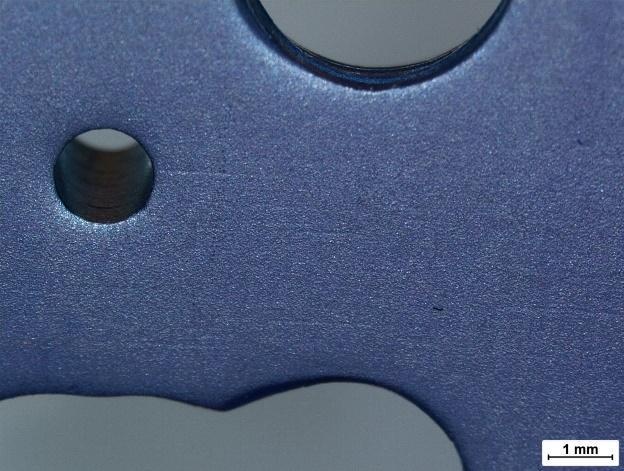
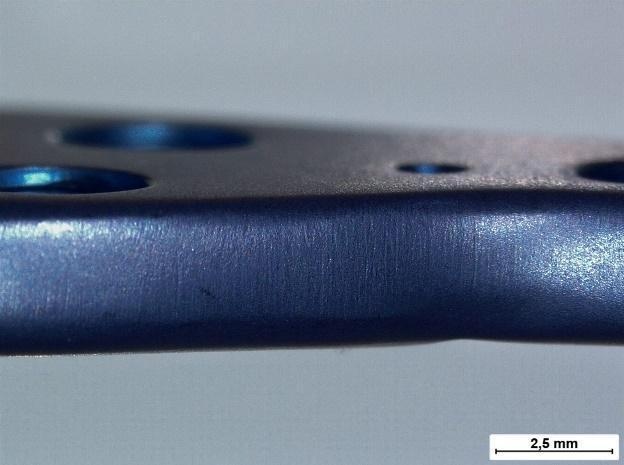
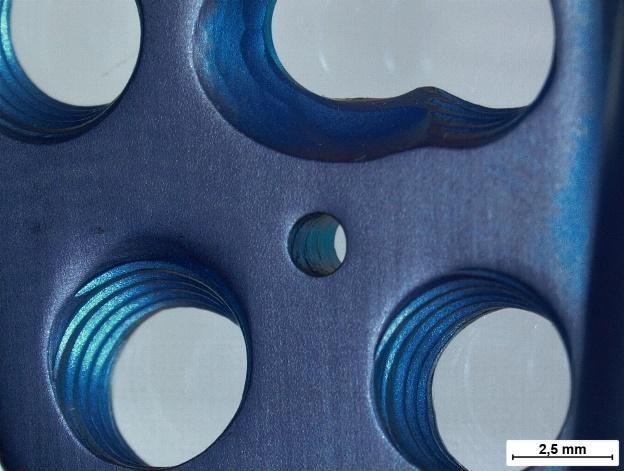
Figure 1 a) shows the upper surface of the implant, 1 c) shows the lower surface adjacent to the bone, 1 b) and 1 d) show the side edges to the long axis of the implant.
Surface quality tests
Surface quality tests were carried out using:
optical digital microscope
Macroscopic assessment of the implant’s surfaces was performed using a Leica DVM6 optical digital microscope at magnifications of 3 ÷ 100x.
scanning electron microscope
Surface assessment was carried out using a TESCAN VEGA Scanning Electron Microscope (SEM) (TESCAN, Brno, Czech Republic). Observations were carried out using an SE detector at 15 keV energy at x100, x500 and 2000x magnifications.
optical profilometer
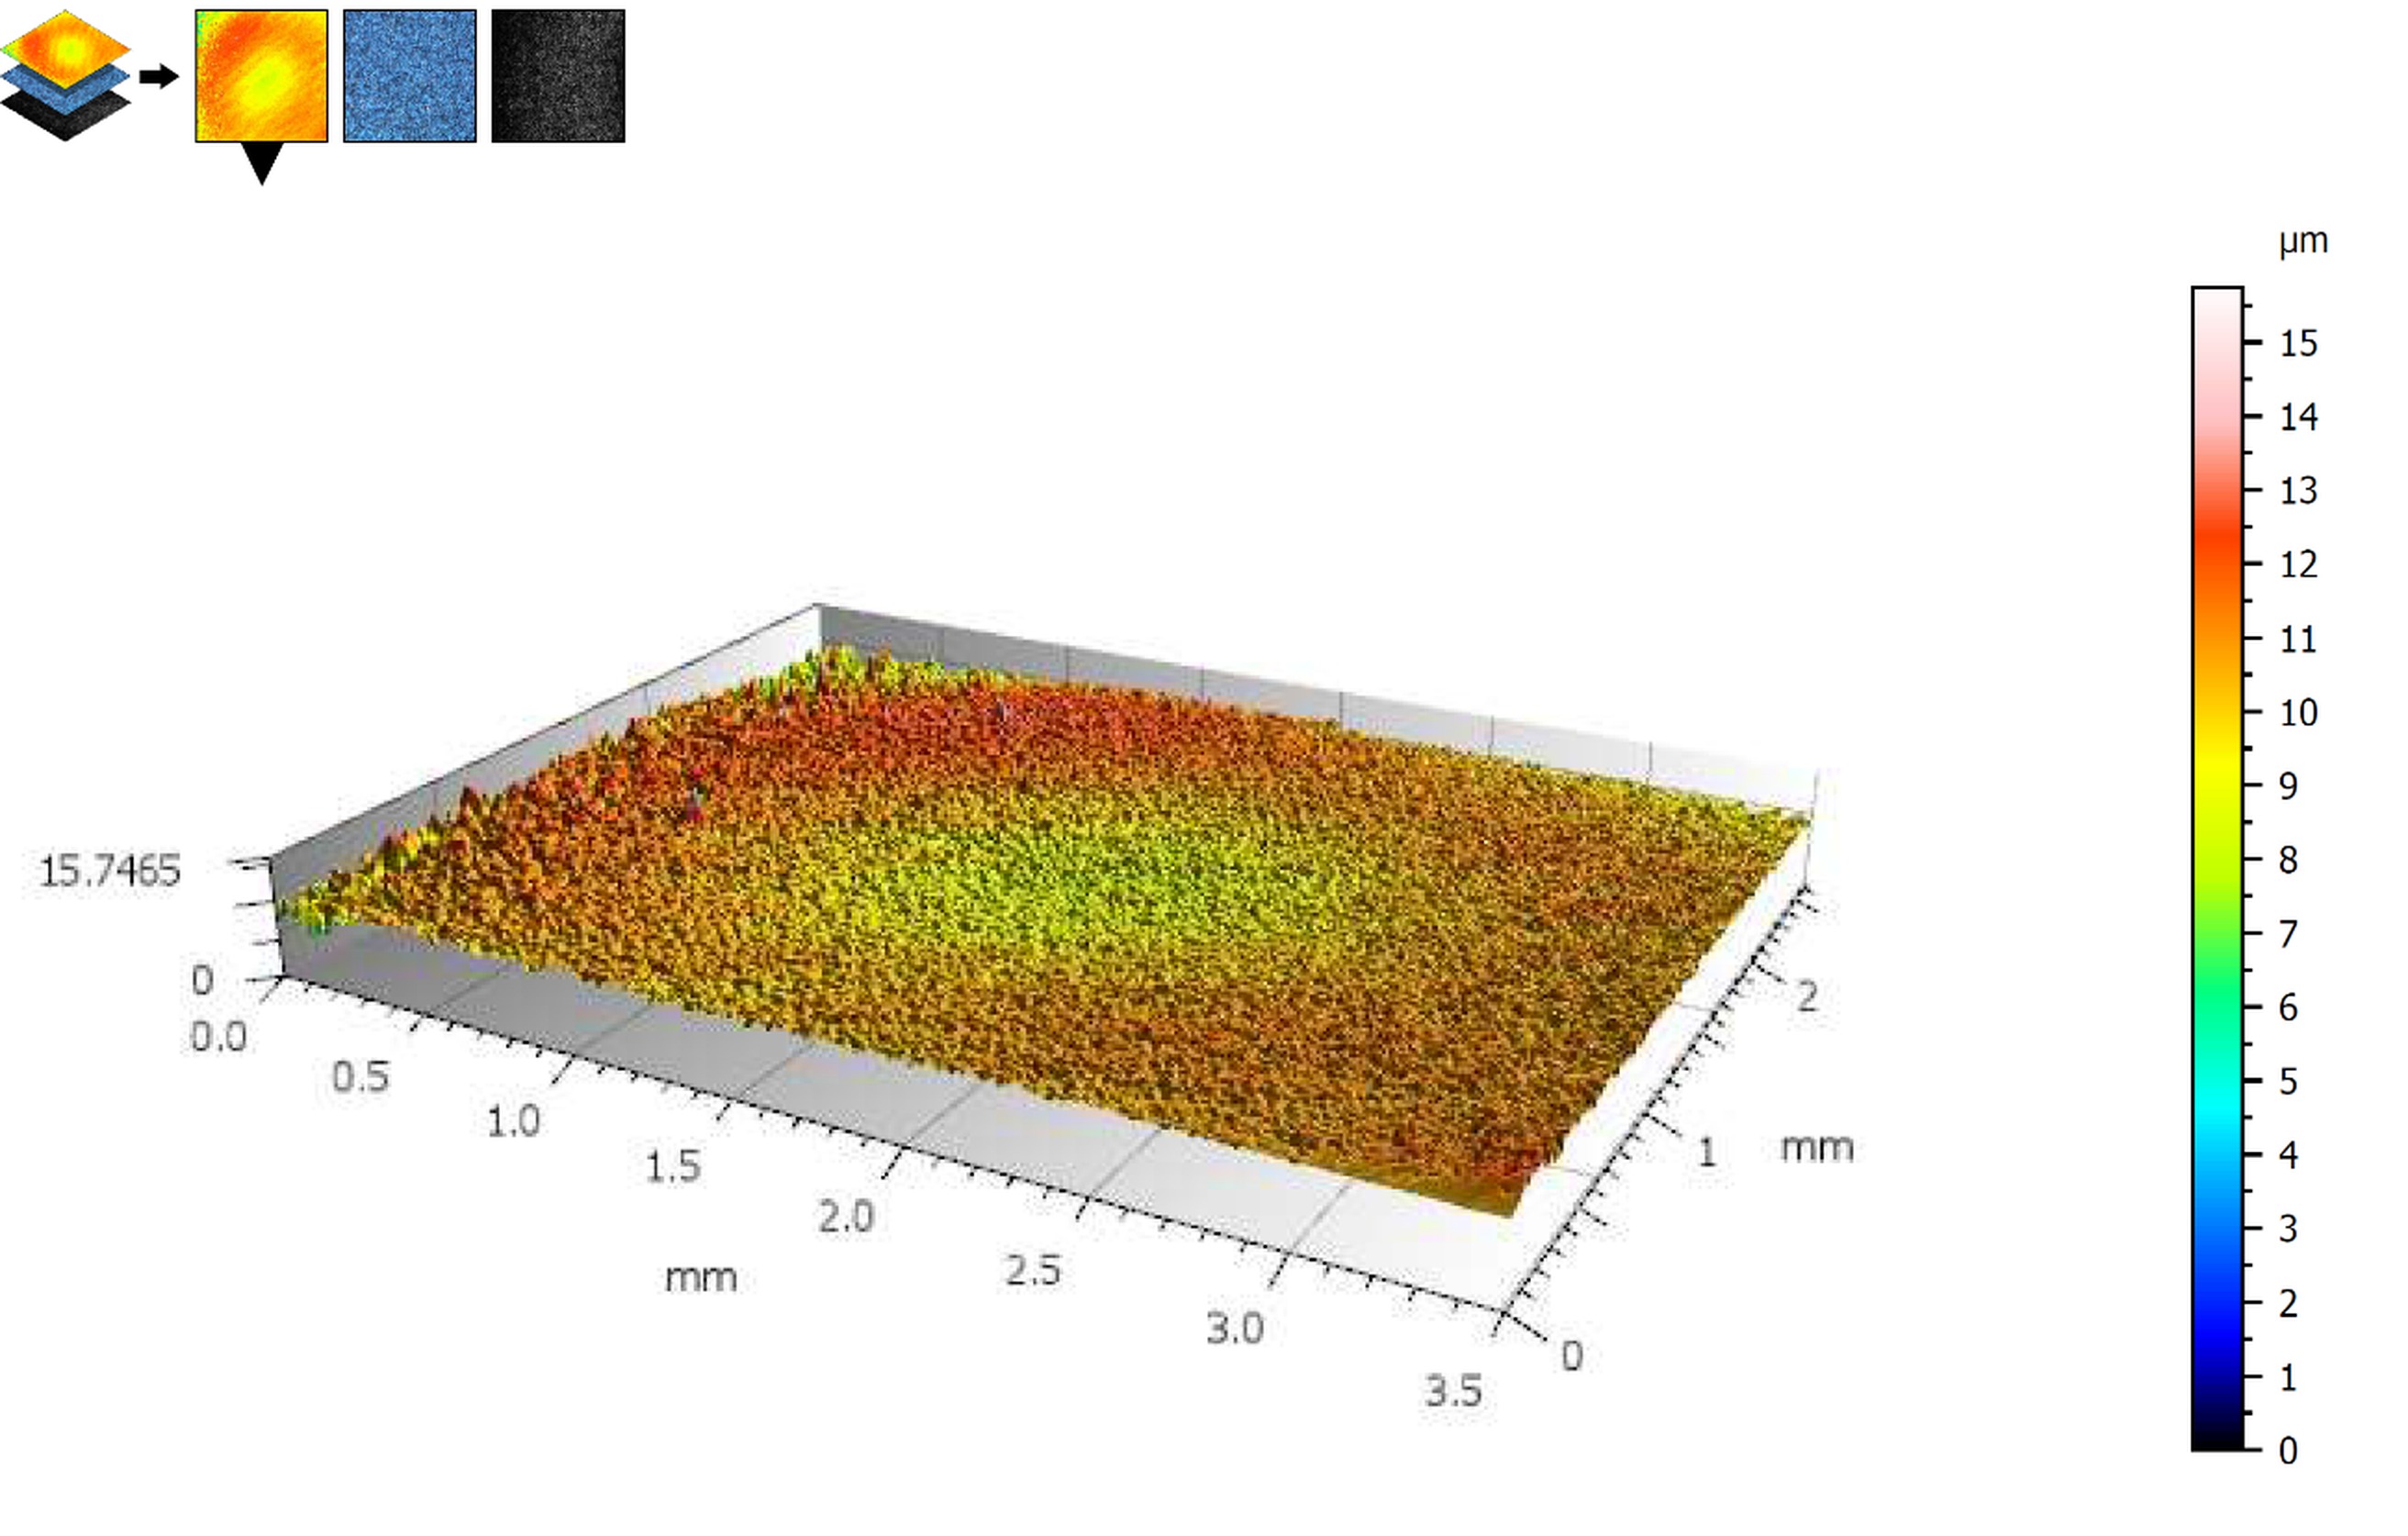
Surface topography studies were carried out using a Leica DCM 8 optical profilometer using the confocal method using green light at 20x magnification. The surface analysis was performed using Leica Map Premium 9 software. The area of the analyzed surface was 3.5 x 2.6 mm. Profiles in two directions were determined for each surface (upper and lower). The parameters Sq, Ssk, Sku, Sp, Sv, Sz and Sa were determined in accordance with the ISO 25178 standard and the parameters Rq, Rsk, Sku, Rz, Ra in accordance with the ISO 21920 standard. The tests were carried out for 6 randomly selected places, 3 from each implant side.
Evaluation of the alloy structure
To assess the structure, longitudinal and transverse metallographic sections were made as part of the research. The samples were hot embedded in MultiFast resin and then mechanically polished using Struers equipment. The samples were then polished using an aluminum oxide suspension. The etching process was carried out in the 8% HF solution. Metallographic examinations were carried out on the Observer Z1.m light microscope from ZEISS at magnifications of 100 ÷ 1000x.
Hardness and hardness profile measurements
The hardness of the analyzed plate was tested using the Vickers method. The measurements were carried out using a DuraScan hardness tester from Struers at a load of 5 N. The tests were carried out on longitudinal and transverse sections, with 5 tests performed on each.
The hardness profile of the coatings on the surface of the tested implant was carried out on an open platform equipped with a Micro-Combi-Tester from CSM Instruments using a Vickers indenter using the Oliver&Pharr method. The aim of the test was to determine the instrumental hardness as a function of the penetration depth. The speed of loading and unloading was 3000 nm/min, and the time of holding the sample under maximum pressure was 5 s. The value of the indenter load was the resulting one. Microhardness measurement was carried out at the following penetrator depth values: 200 nm, 300 nm, 400 nm, 500 nm, 1000 nm, 2000 nm, 3000 nm, 4000 nm, 5000 nm, 6000 nm, 7000 nm.
Testing the adhesion of the coating to the substrate
The adhesion of the TiO2 layer to the substrate was tested using a scratch test using an open platform equipped with a Micro-Combi-Tester from CSM in accordance with the recommendations of the PN-EN ISO 20502:2016-05 standard. Using a diamond Rockwell indenter, a scratch was made with a length of l = 3 mm, gradually increasing the load at a rate of vs = 10 N/min and a table travel speed of vt = 10 mm/min, with an increasing loading force Fc in the range of 0.03 ÷ 30 N The minimum normal force causing the delamination of the tested coating to the substrate was determined as the critical force. Changes in acoustic emission, friction force and friction coefficient, as well as microscopic observations, were used to assess the critical force Lc. There were three scratches on the upper and lower surfaces.
Pitting corrosion resistance tests
Pitting corrosion resistance tests were carried out using the potentiodynamic method. A PGP201 potentiostat from the Radiometer was used. The reference electrode was a saturated calomel electrode, and the auxiliary electrode was a platinum wire. Before testing, the samples were cleaned in ethyl alcohol in an ultrasonic cleaner for 10 minutes. The tests began by determining the EOCP opening potential for 60 minutes. Polarization curves were then recorded, starting from the initial potential Est = EOCP − 100 mV. The rate of change of potential was 3 mV/s. The tests were carried out up to a potential value of +4000 mV or an anode current density of 1 mA/cm2. The tests were carried out in a PBS solution (Chem Solve; chemical composition: NaCl 0.14M, KCl 0.0027 M, phosphate ions PO4-3 0.010 M). Based on the polarization curves using the Stern method, characteristic values describing the resistance to pitting corrosion were determined, i.e.: corrosion potential Ecorr (mV) and polarization resistance Rp (kΩcm2). The tests were performed on 5 samples obtained from implants.
Surface wettability tests
Wettability tests were carried out by the sessile drop method using Attention Theta Flex (Biolin Scientific). The tests were carried out at room temperature using 1.5 µl droplets of distilled water. The applied droplets were analyzed using OneAttesion software. Contact angle measurements were started 3 s after droplet deposition. Each measurement lasted 60 s with a sampling frequency of 1 Hz. Tests were performed for 6 randomly selected areas, 3 on each side of the implant.
Energy Dispersive Spectroscopy
The analysis of the chemical composition using the EDS method was carried out using a TESCAN VEGA Scanning Electron Microscope (SEM) (TESCAN, Brno, Czech Republic) equipped with an Xplore EDS Electron Dispersive Spectroscopy (EDS) detector (Instruments OXFORD, Oxford, England). The tests were carried out point-wise at 2000x magnification and on a surface area of 110 x 110 µm, for which maps of the distribution of individual elements on the tested surface were created. Based on the measured spectra, the chemical composition of the sample's surface layer was determined in t%. The spectrum of carbon (C) was omitted in the analysis, considering it an organic and atmospheric pollutant deposited on the surface of the tested sample.
X-Ray Photoelectron Spectroscopy
The surface chemical state examination was done with the use of a multi-chamber ultra-high vacuum experimental setup equipped with an X-ray photoelectron spectroscopy (XPS) setup. For the XPS investigation, monochromatic Al Kα radiation (PREVAC, dual-anode source XR-40B; energy 1486.60 eV) was utilized for sample excitation. The binding energy (BE) axis of the analyzer was calibrated to the Ag 3d5/2 (368.27 eV) [1] region of the silver sample kept at the same sample stage as an examined sample. Additionally, the BE scale was monitored with control of the C-C signal in the C 1s region with respect to the described procedures [7]. The electron pass energy was set to 200 eV (scanning step, 0.9 eV) and to 100 eV (scanning step, 0.05 eV) for the survey spectra and the individual high–resolution regions, respectively. For the highest energy resolution and limitation of energy dispersion effects, the curved analyzer exit slit (C 0.8 mm x 25 mm) was utilized. The peaks were decomposed using CasaXPS software with the use of Shirley's background and the LA line shapes. The full-width at half-maximum (FWHM) values were slightly varying within a narrow range The spin–orbit splitting was taken into account, where applicable. The estimated uncertainty of the energy position of components was 0.08 eV.
Ar+ ion etching (for in-depth chemical analysis) was performed using a grazing–incidence–oriented PREVAC IS40A1 ion gun equipped with a differential pumping stage. The sputtering process was performed with energy 1.5 keV with a spot size of 3.0x2.0 mm2 for 5 min per etching step. The ultimate scan was done after 45 min. of Ar+ etching. The partial pressure of Ar was kept at the level of 5·10-8 mbar during the sputtering.
Results
Surface quality tests
Surface quality tests using:
optical stereoscopic microscope,
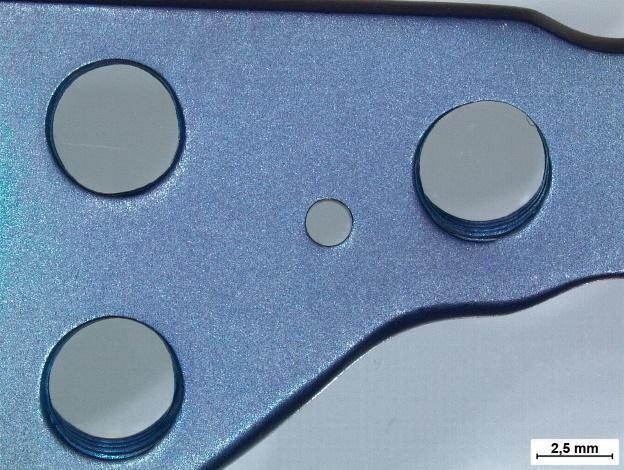
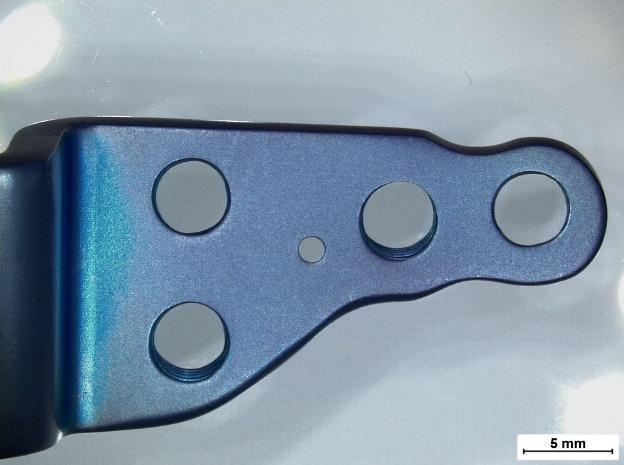
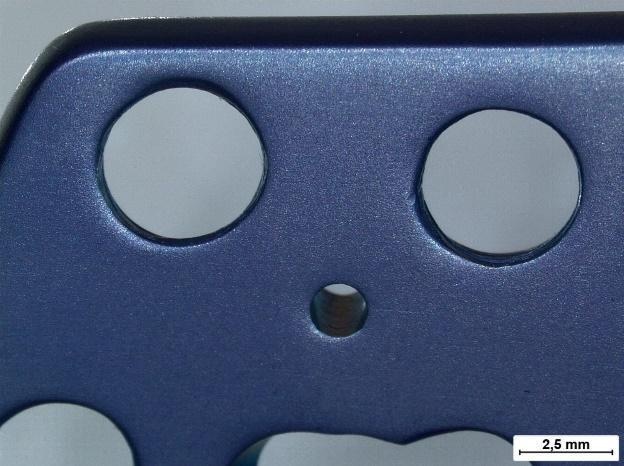
The surface of the implants is characterized by a heterogeneous, matte, blue color (Figure 2 a), the intensity of which changes slightly within the zones subjected to permanent deformation during the shaping of its structural form (Figure 2 b). The variation in color was also influenced by the heterogeneous topography of the implants, created during vibration processing - Figure 2 c, d, e. Moreover, scratches remaining after grinding are visible on the surface of the implants (Figure 2 e, f). They occur mainly on the side surfaces of the implants (Figure 2 f). No unwanted machining residues were observed in the threaded holes and screw sockets. These surfaces are also characterized by a blue color (Figure 2 g, h).
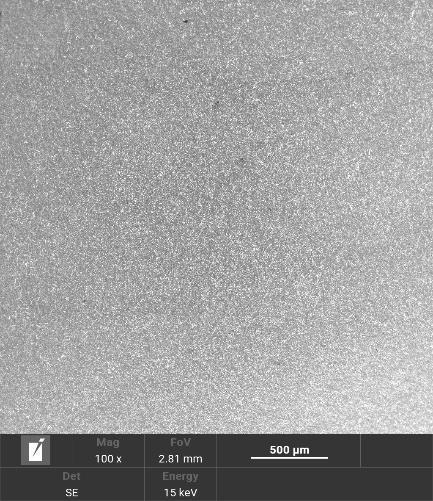
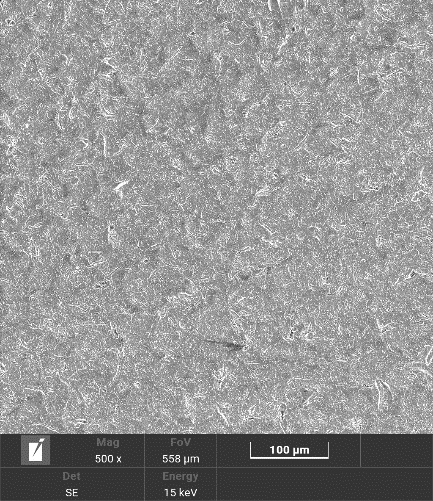
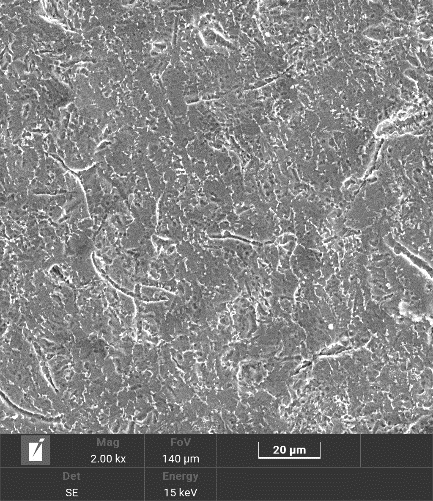
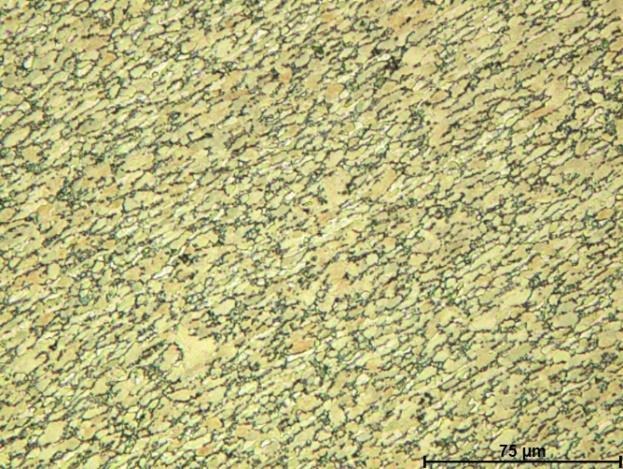
scanning electron microscope
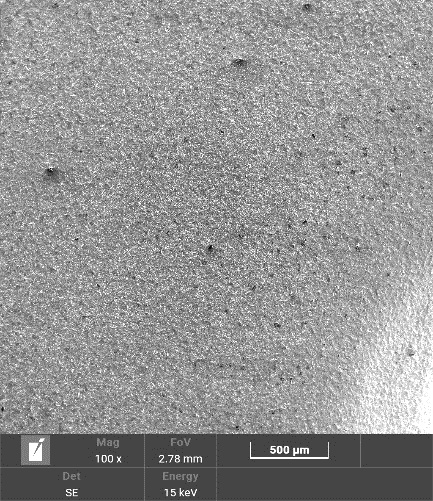
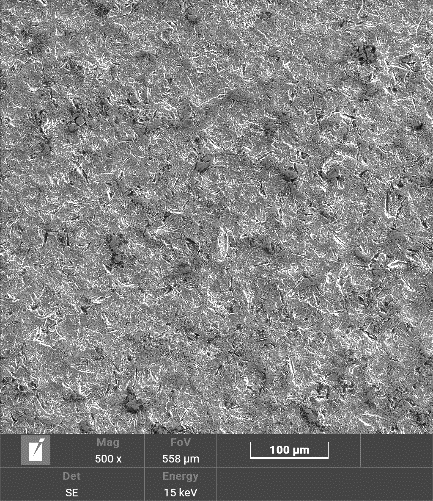
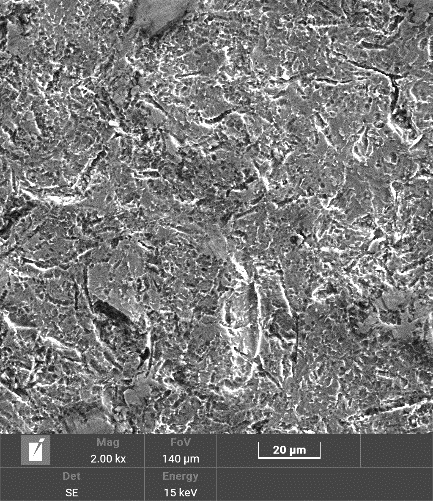
Microscopic examinations were performed on the upper and lower surfaces of the implant adjacent to the bone. Both surfaces were characterized by similar topography. There were numerous, evenly distributed dents on the surface, which were remnants of vibration processing - Figure 3.
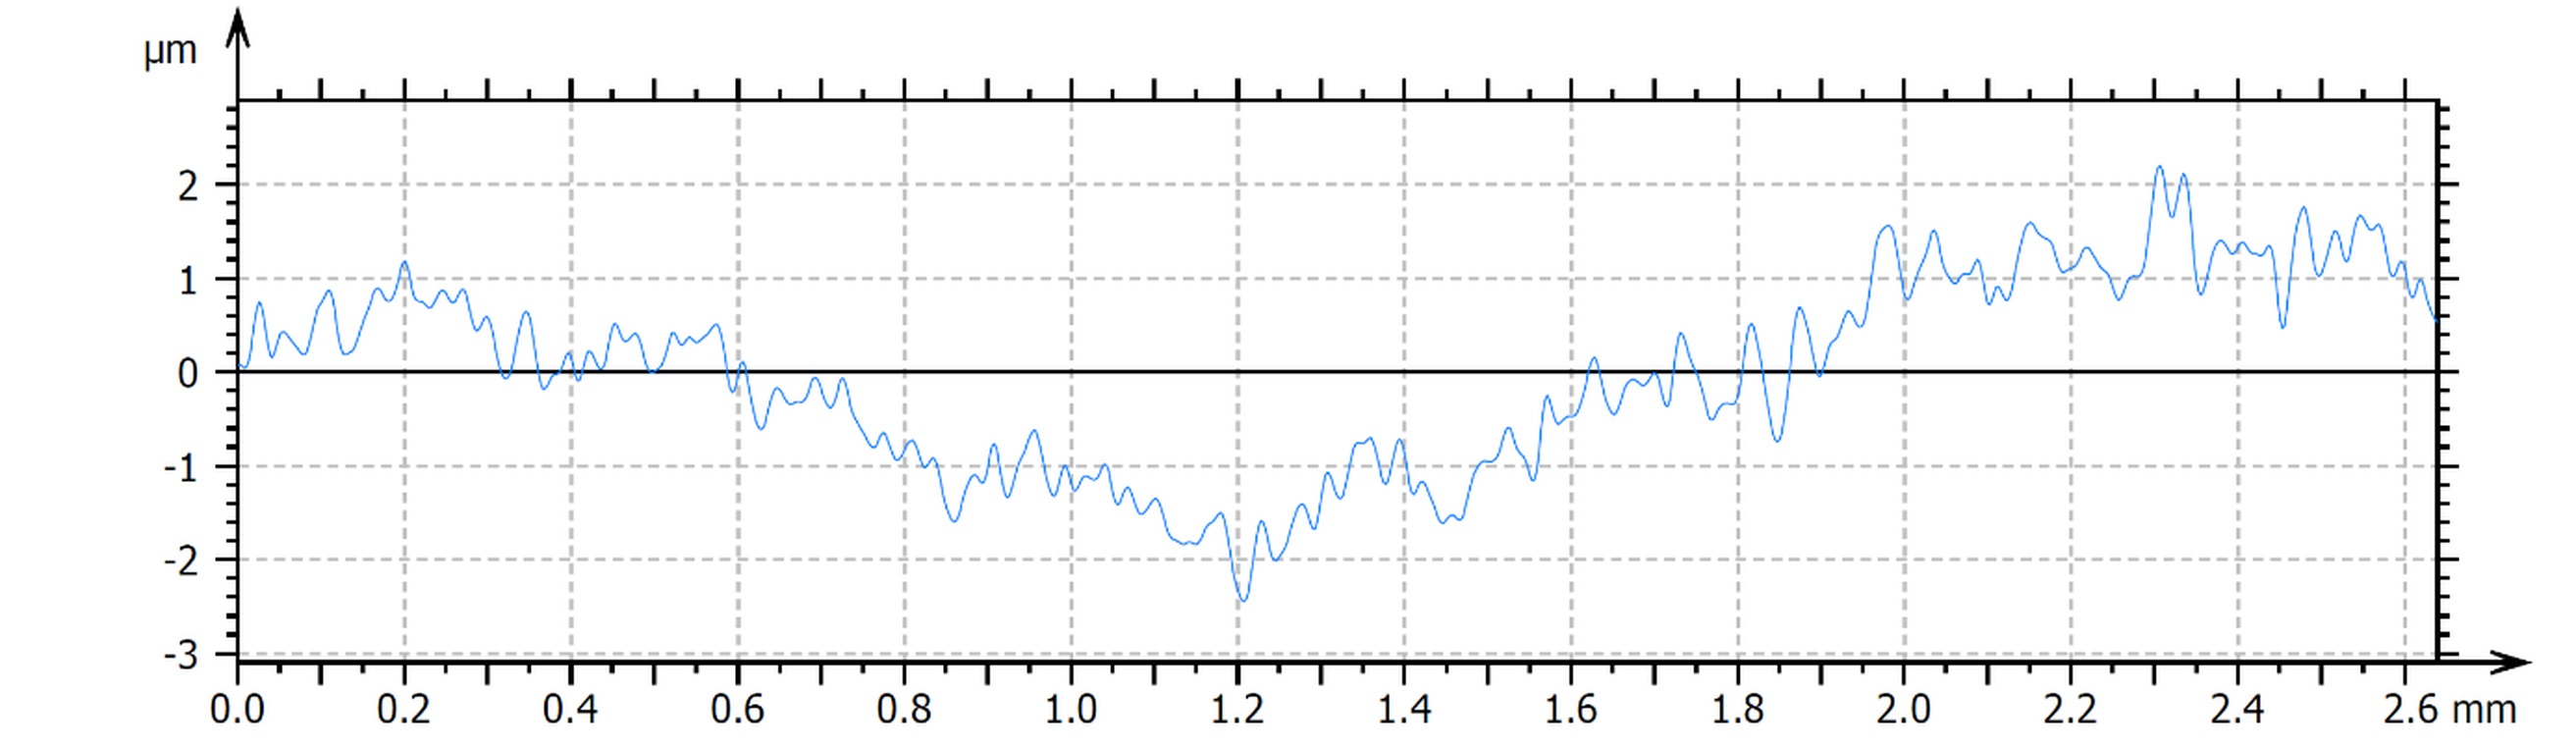
optical profilometer
Analysis of the test results indicates varied surface roughness. The lower surface adjacent to the bone was characterized by greater roughness - Tables 1, 2. An example image of the external surface (3D) and profile of the implant is shown in Figures 4 and 5, respectively.
Tab. 1
Surface roughness parameters
Up | Down | |
Sq, μm | 1,03 | 2,21 |
Ssk | -0,93 | -0,37 |
Sku | 6,36 | 5,70 |
Sp, μm | 5,33 | 20,43 |
Sv, μm | 10,41 | 29,17 |
Sz, μm | 15,75 | 49,6 |
Sa, μm | 0,77 | 1,66 |
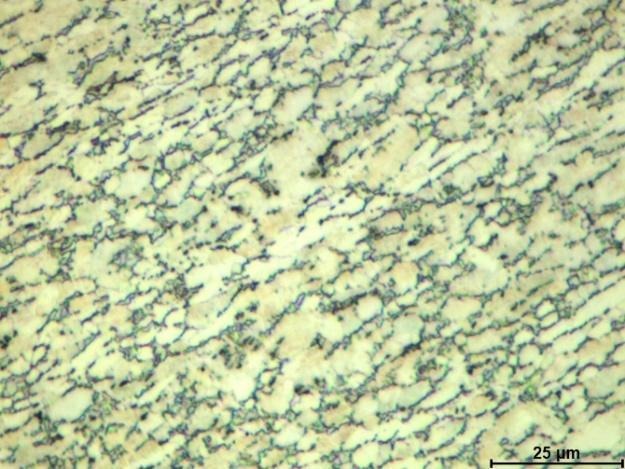
Alloy structure
Based on the observations made, the correct structure of the material from which the plate was made was observed. Observations showed the existence of a two-phase structure α + β - Figure 6. It was characterized by a homogeneous microstructure consisting of equiaxed grains of the α phase and the β phase located at the grain boundary of the α phase.
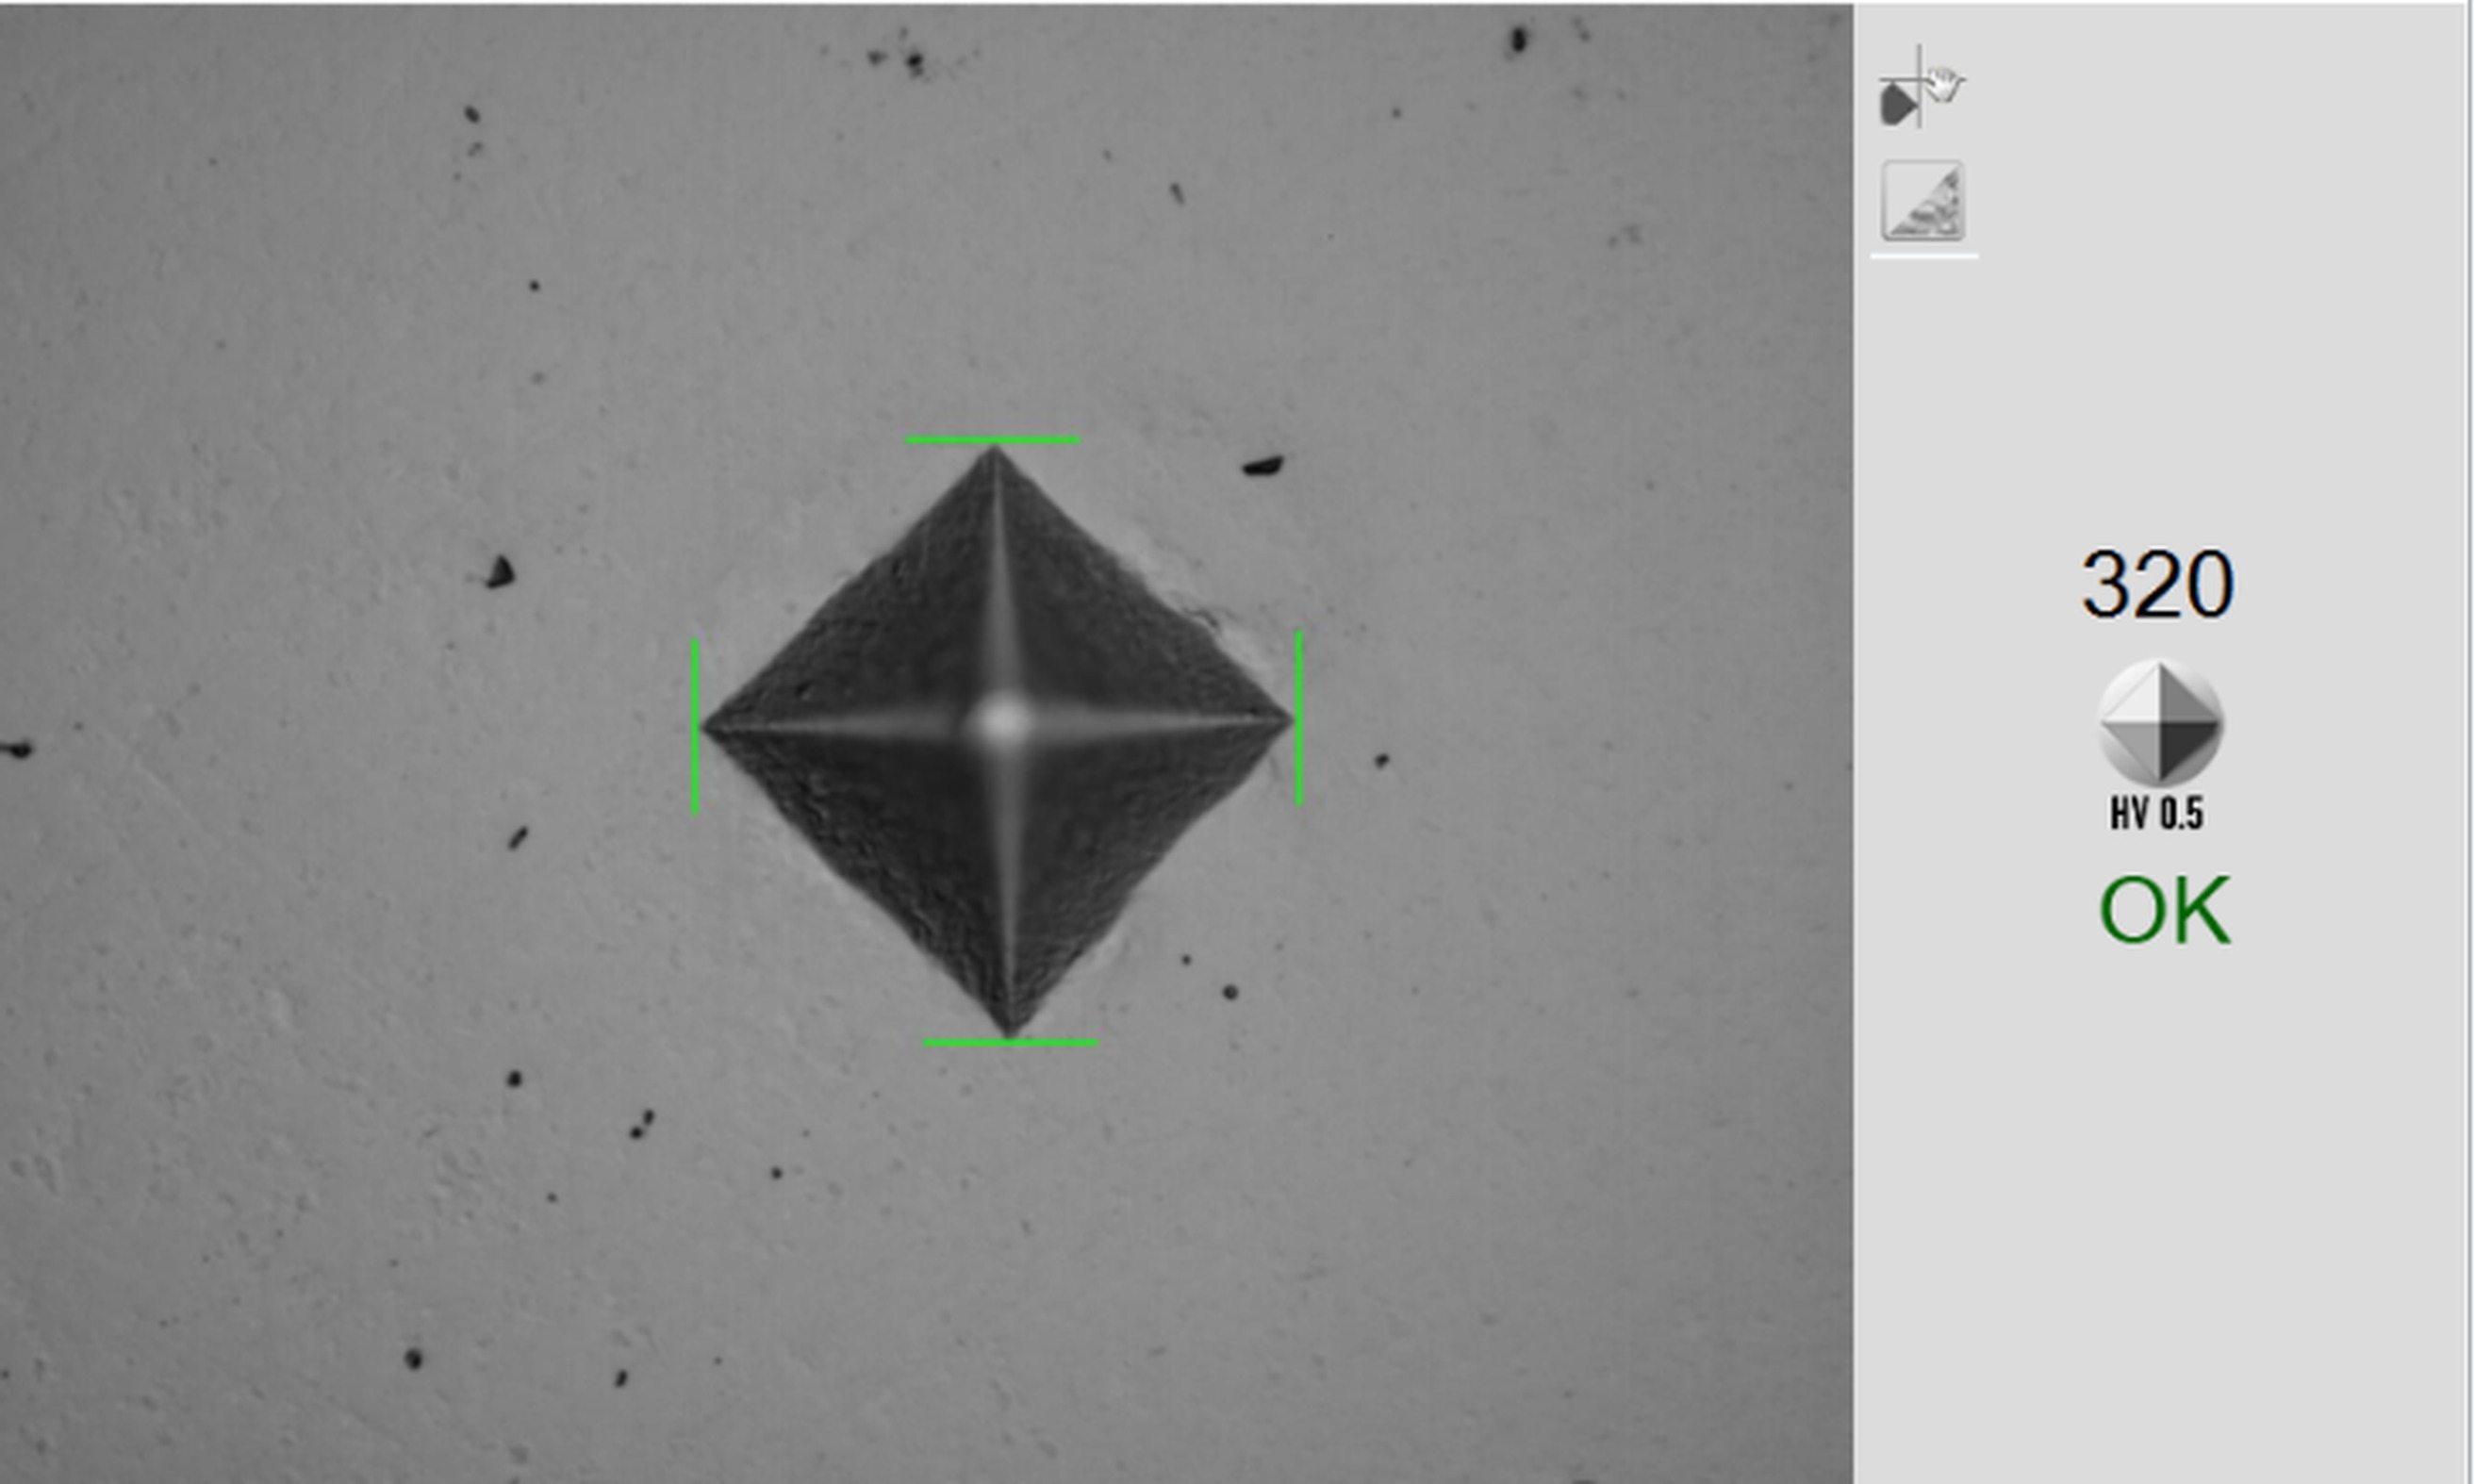
Hardness and hardness profile
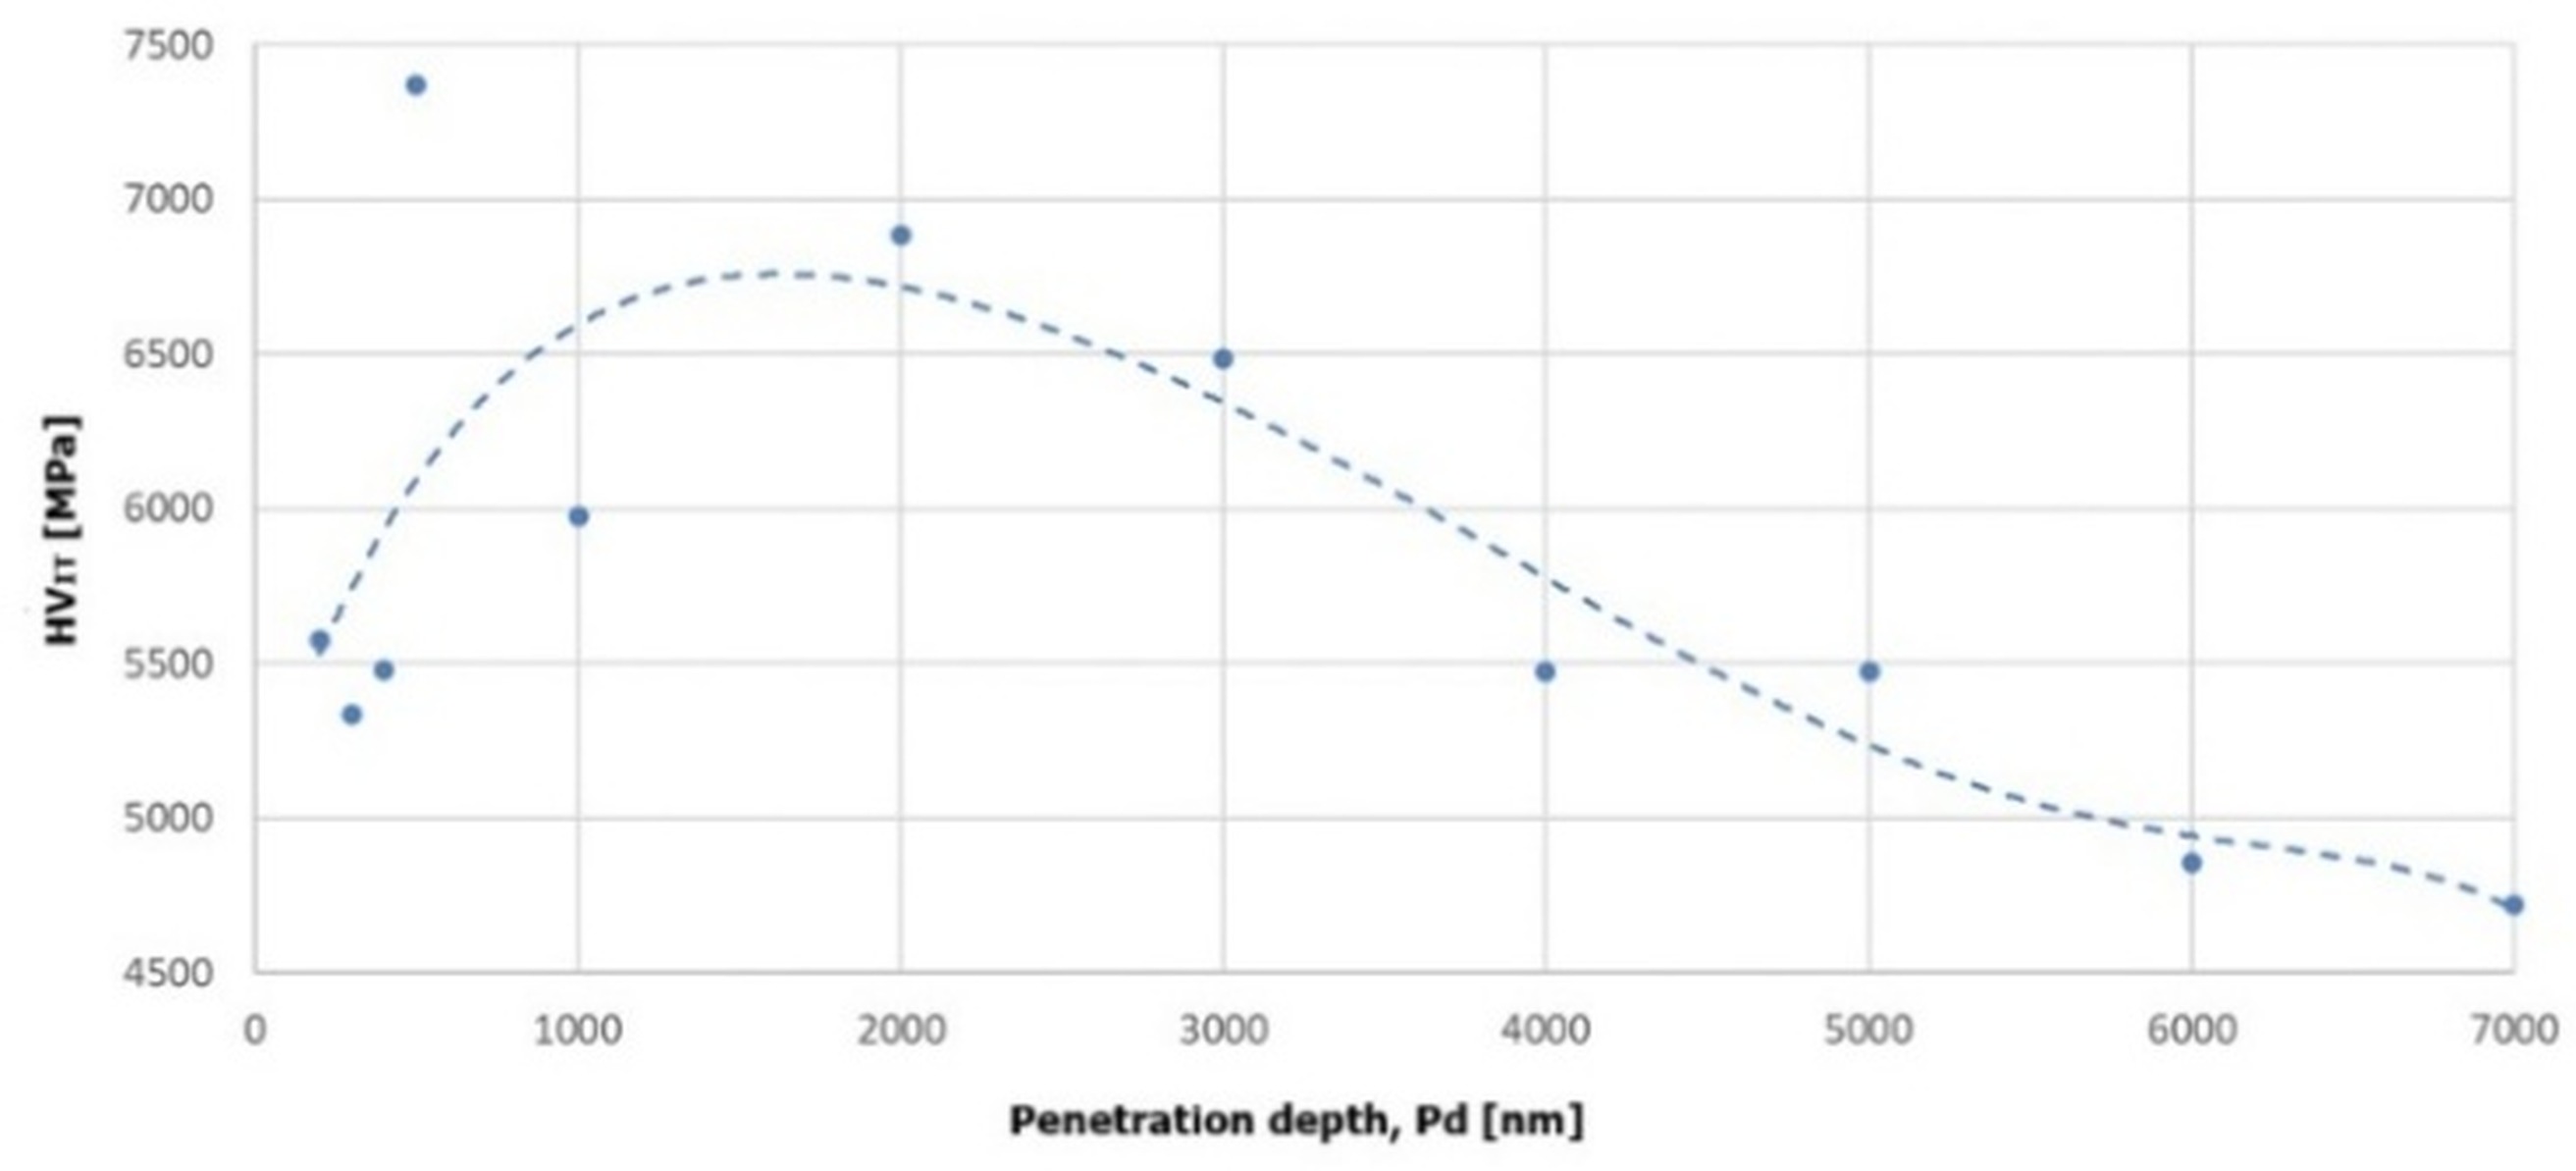
The measurements performed did not show significant differences in hardness on the longitudinal and cross-sections of the tested samples. It was found that the average hardness value was in the range of 307 ÷ 328 HV0.5 - Figure 7.
Based on the analysis, different hardness values were shown depending on the distance from the implant surface. Higher hardness was observed in the surface layer to a depth of approximately 4000 nm, compared to the core of the material. This effect may be the result of the strengthening of the material caused by the use of vibration treatment preceding the anodic oxidation process - Figure 8.
Adhesion of the coating to the substrate
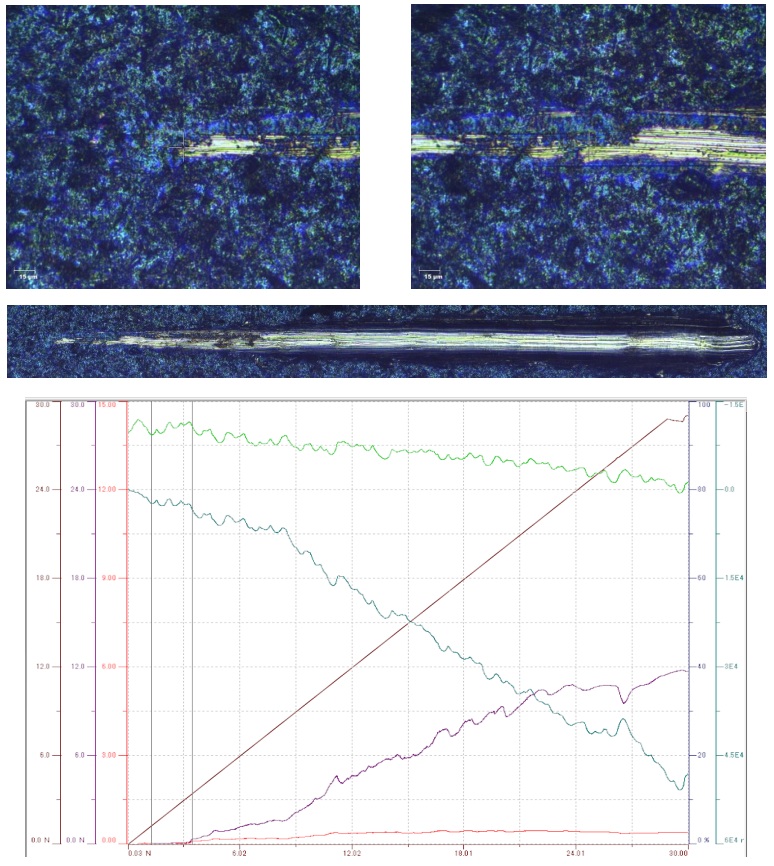
The analyzed coating was characterized by good adhesion to the substrate. Based on the measurements performed, it was found that the coating was chipped at a value of Lc2 = 1.27 ± 0.05 N, and a complete break in its continuity was observed at a value of Lc3 = 3.46 ± 0.1 N. Based on the macroscopic assessment of the scratch, discontinuous perforation of the coating was found. Examples of sample surface scratches and the curves recorded during the tests are shown in Figure 9.
Pitting corrosion resistance tests
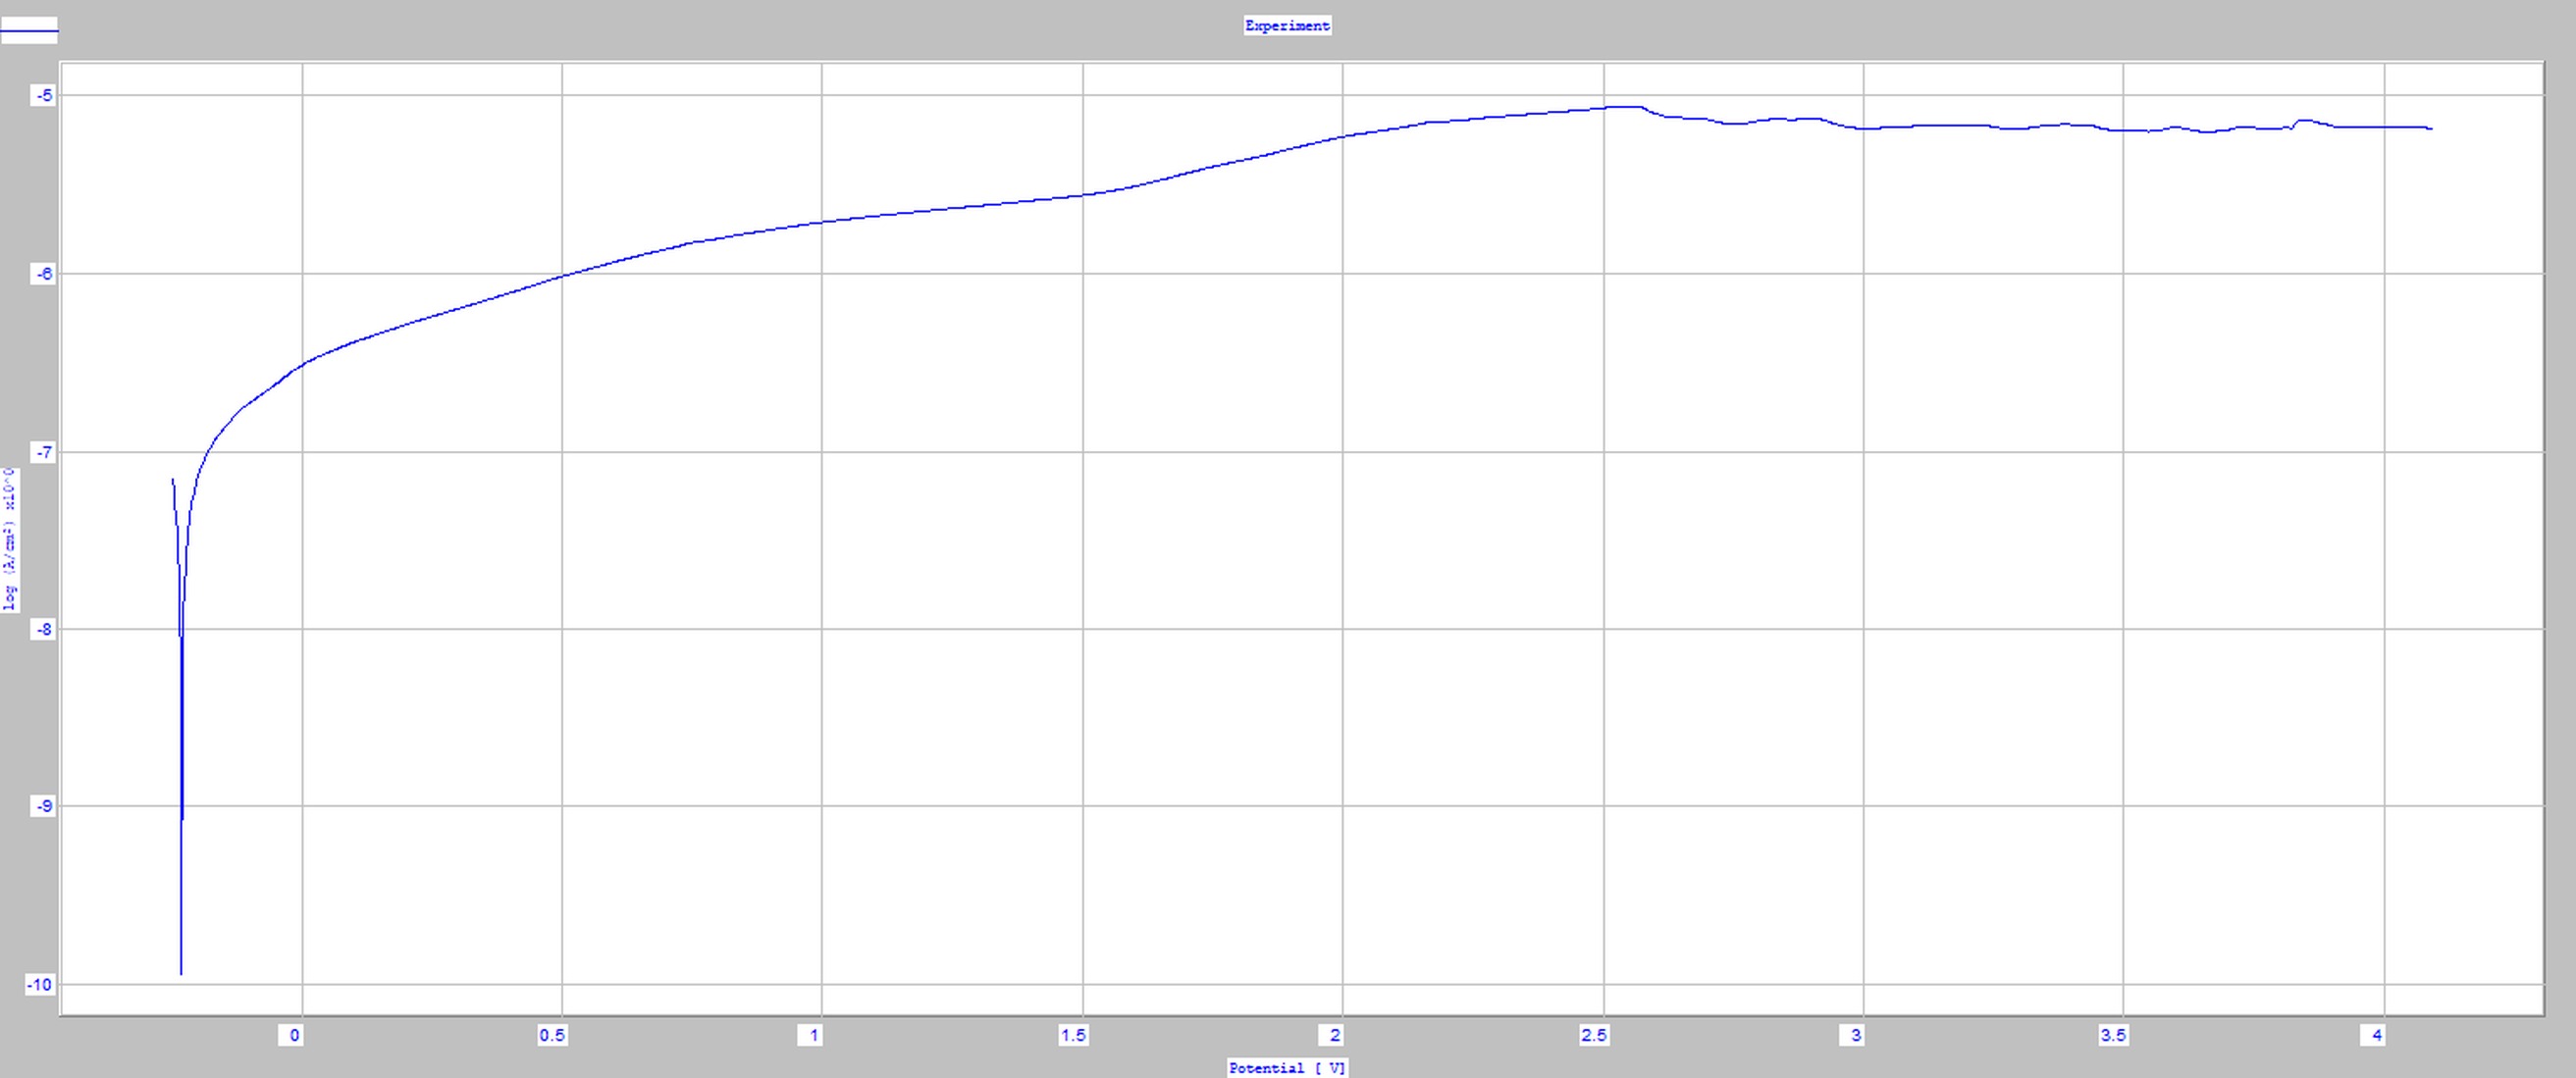
Polarization curves of samples obtained from the implant are characterized by the absence of hysteresis loops. This indicates effective passivation of the implant surfaces in the entire measurement range E = + 4000 mV. In this range, no sudden increase in current density was observed, which would indicate the initiation of the corrosion process - Figure 10. This was confirmed by microscopic observations of the surfaces of samples after corrosion tests.
The average values of the corrosion potential Ecorr and the polarization resistance Rp determined using the Stern method were Ecorr = -255.5 ± 10mV and Rp = 480.17 ± 55 kΩcm2, respectively.
Surface wettability
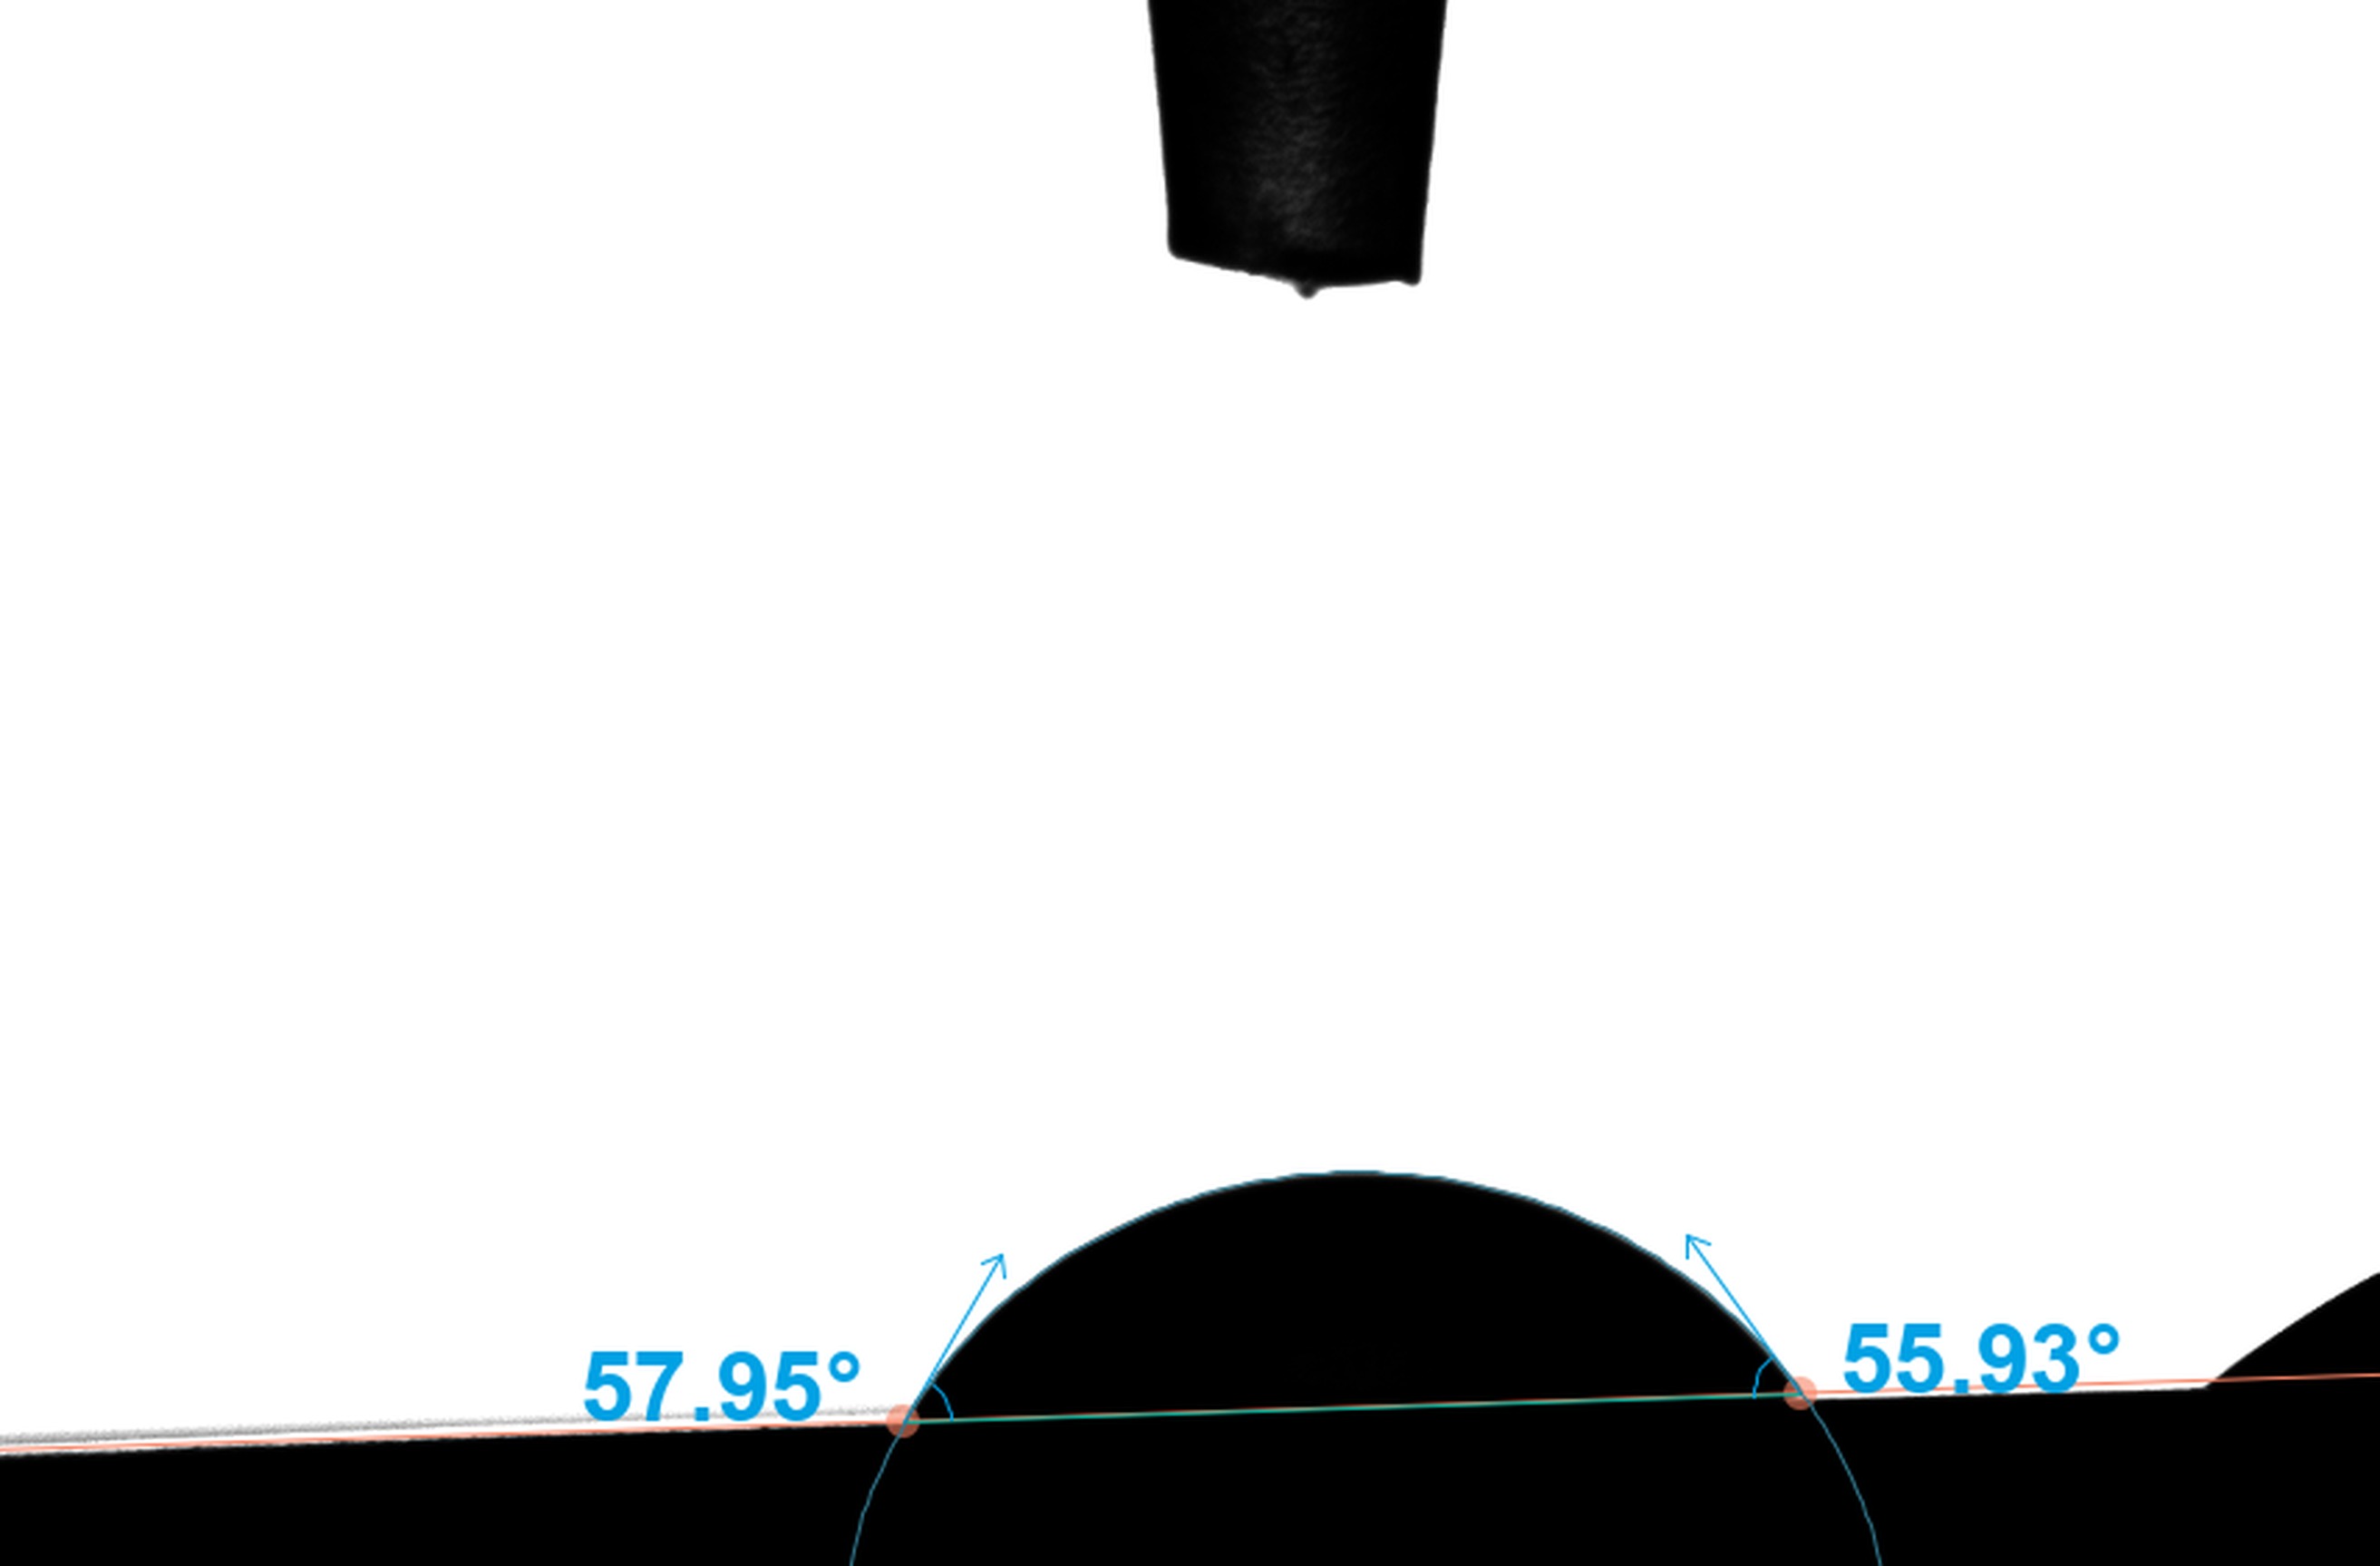
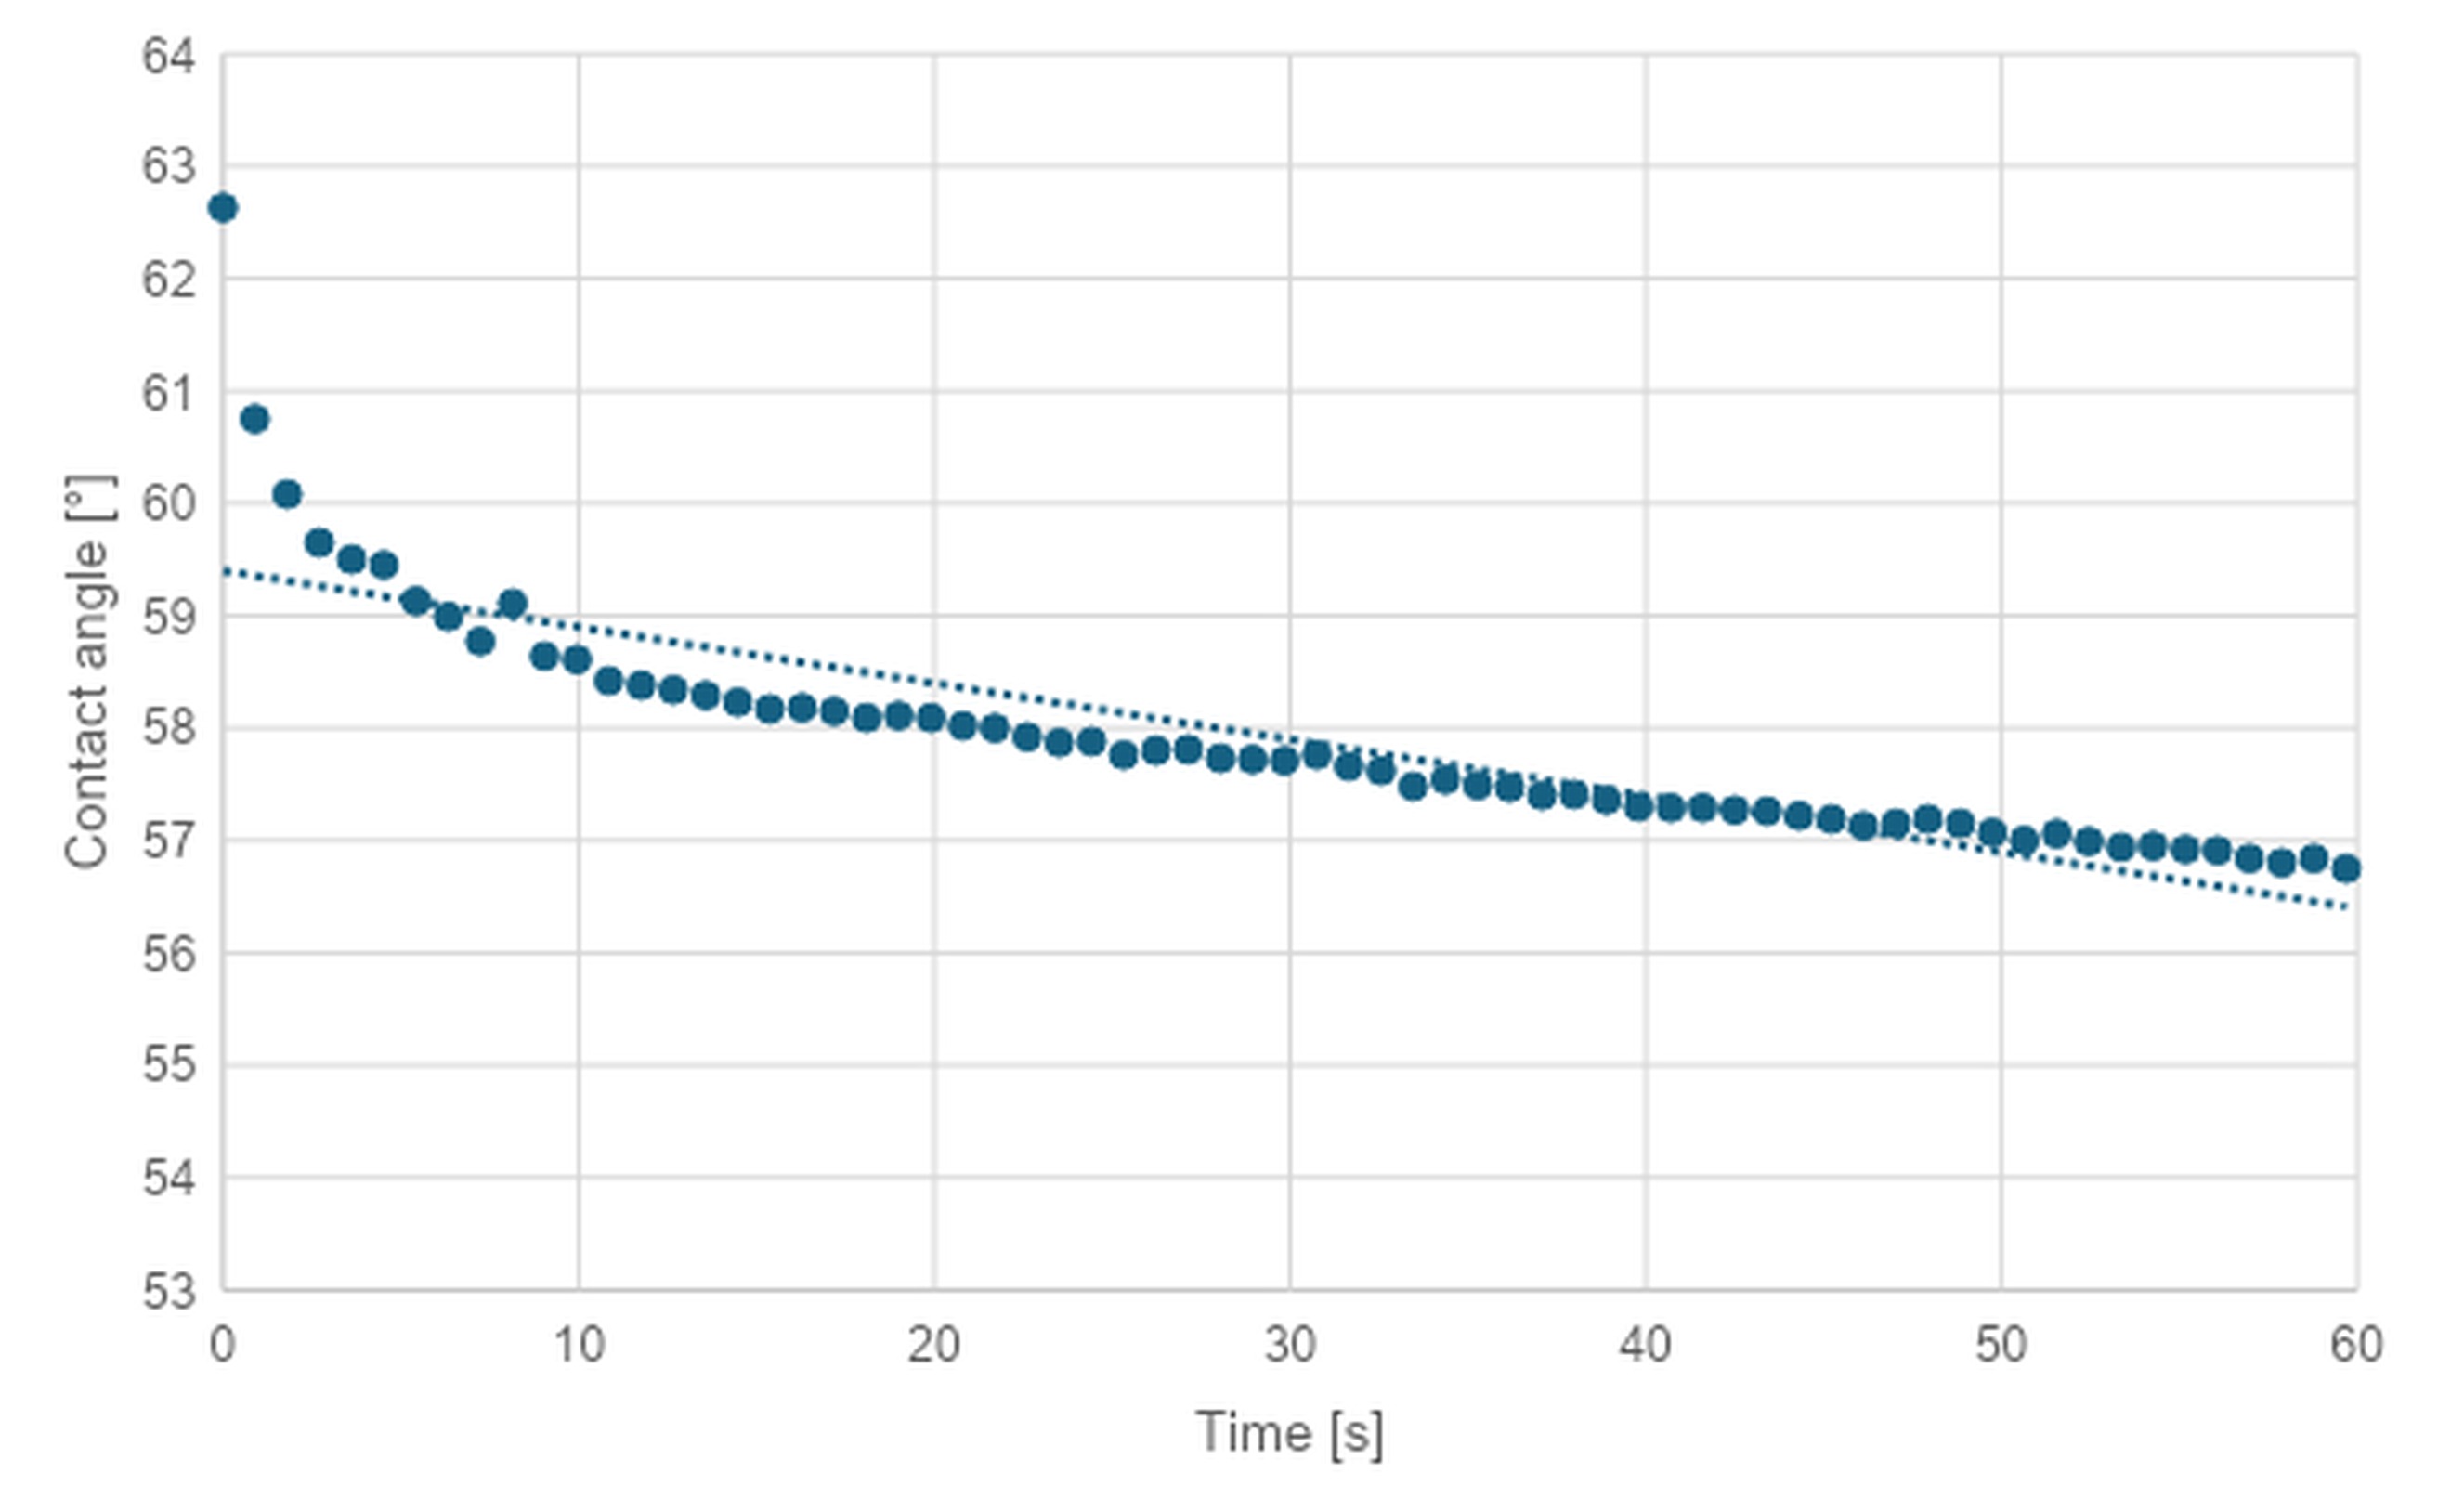
The value of the contact angle Θ of the tested surfaces was in the range of 56.4±58.8°. The average value of the contact angle was Θ = 57.5±2.4°. The obtained results demonstrate the hydrophilic nature of the surface. Figure 11 shows an example droplet. Figure 12 shows the water contact angle as a function of time.
The chemical composition of the surface layer
Analysis of the chemical composition of the implants' surface layer showed that they consist mainly of Ti, O, Al and V. Moreover, in the lower surface layer of the implants (adjacent to the bone), the presence of Si and Na, which are remnants of vibration processing, was found. The surface image, overview spectrum and element distribution of the upper and lower surface layers are shown in Figures 13 and 14, respectively.
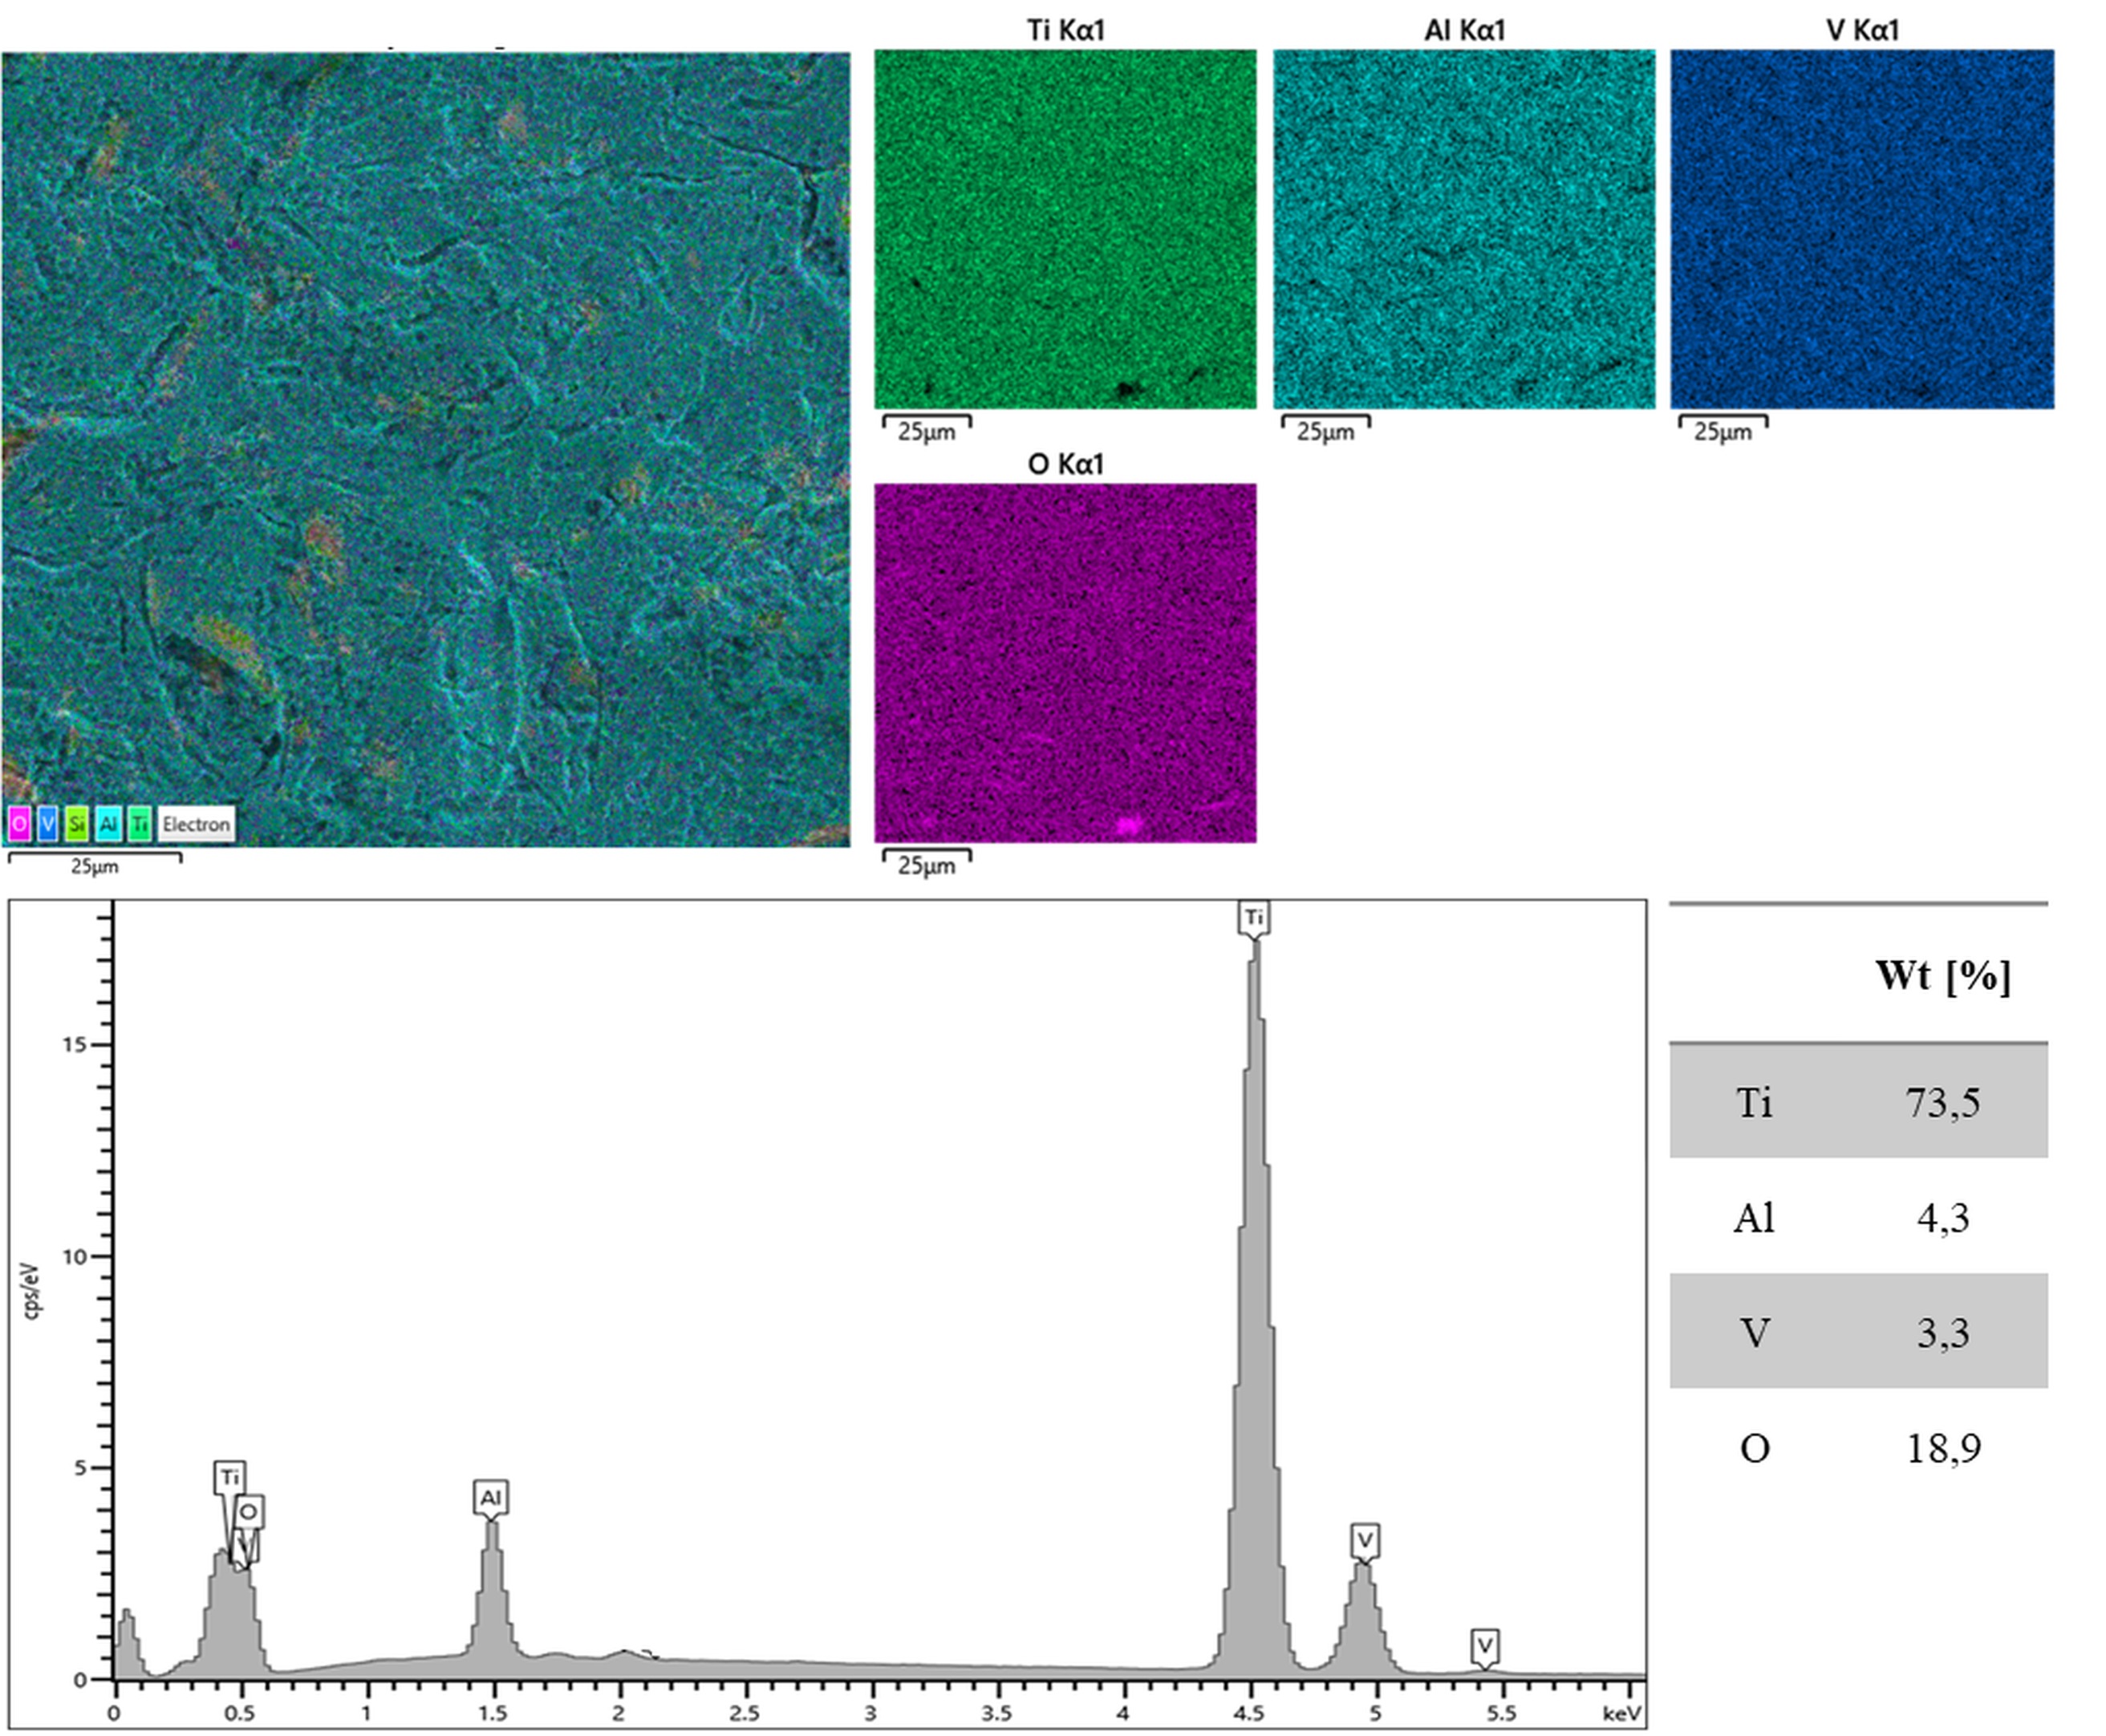
Fig. 13. Image of the SEM surface subjected to EDS analysis with an overlaid map of the element distribution: left - summary map, right - map of identified elements. EDS spectrum of the examined upper surface with the determined chemical composition
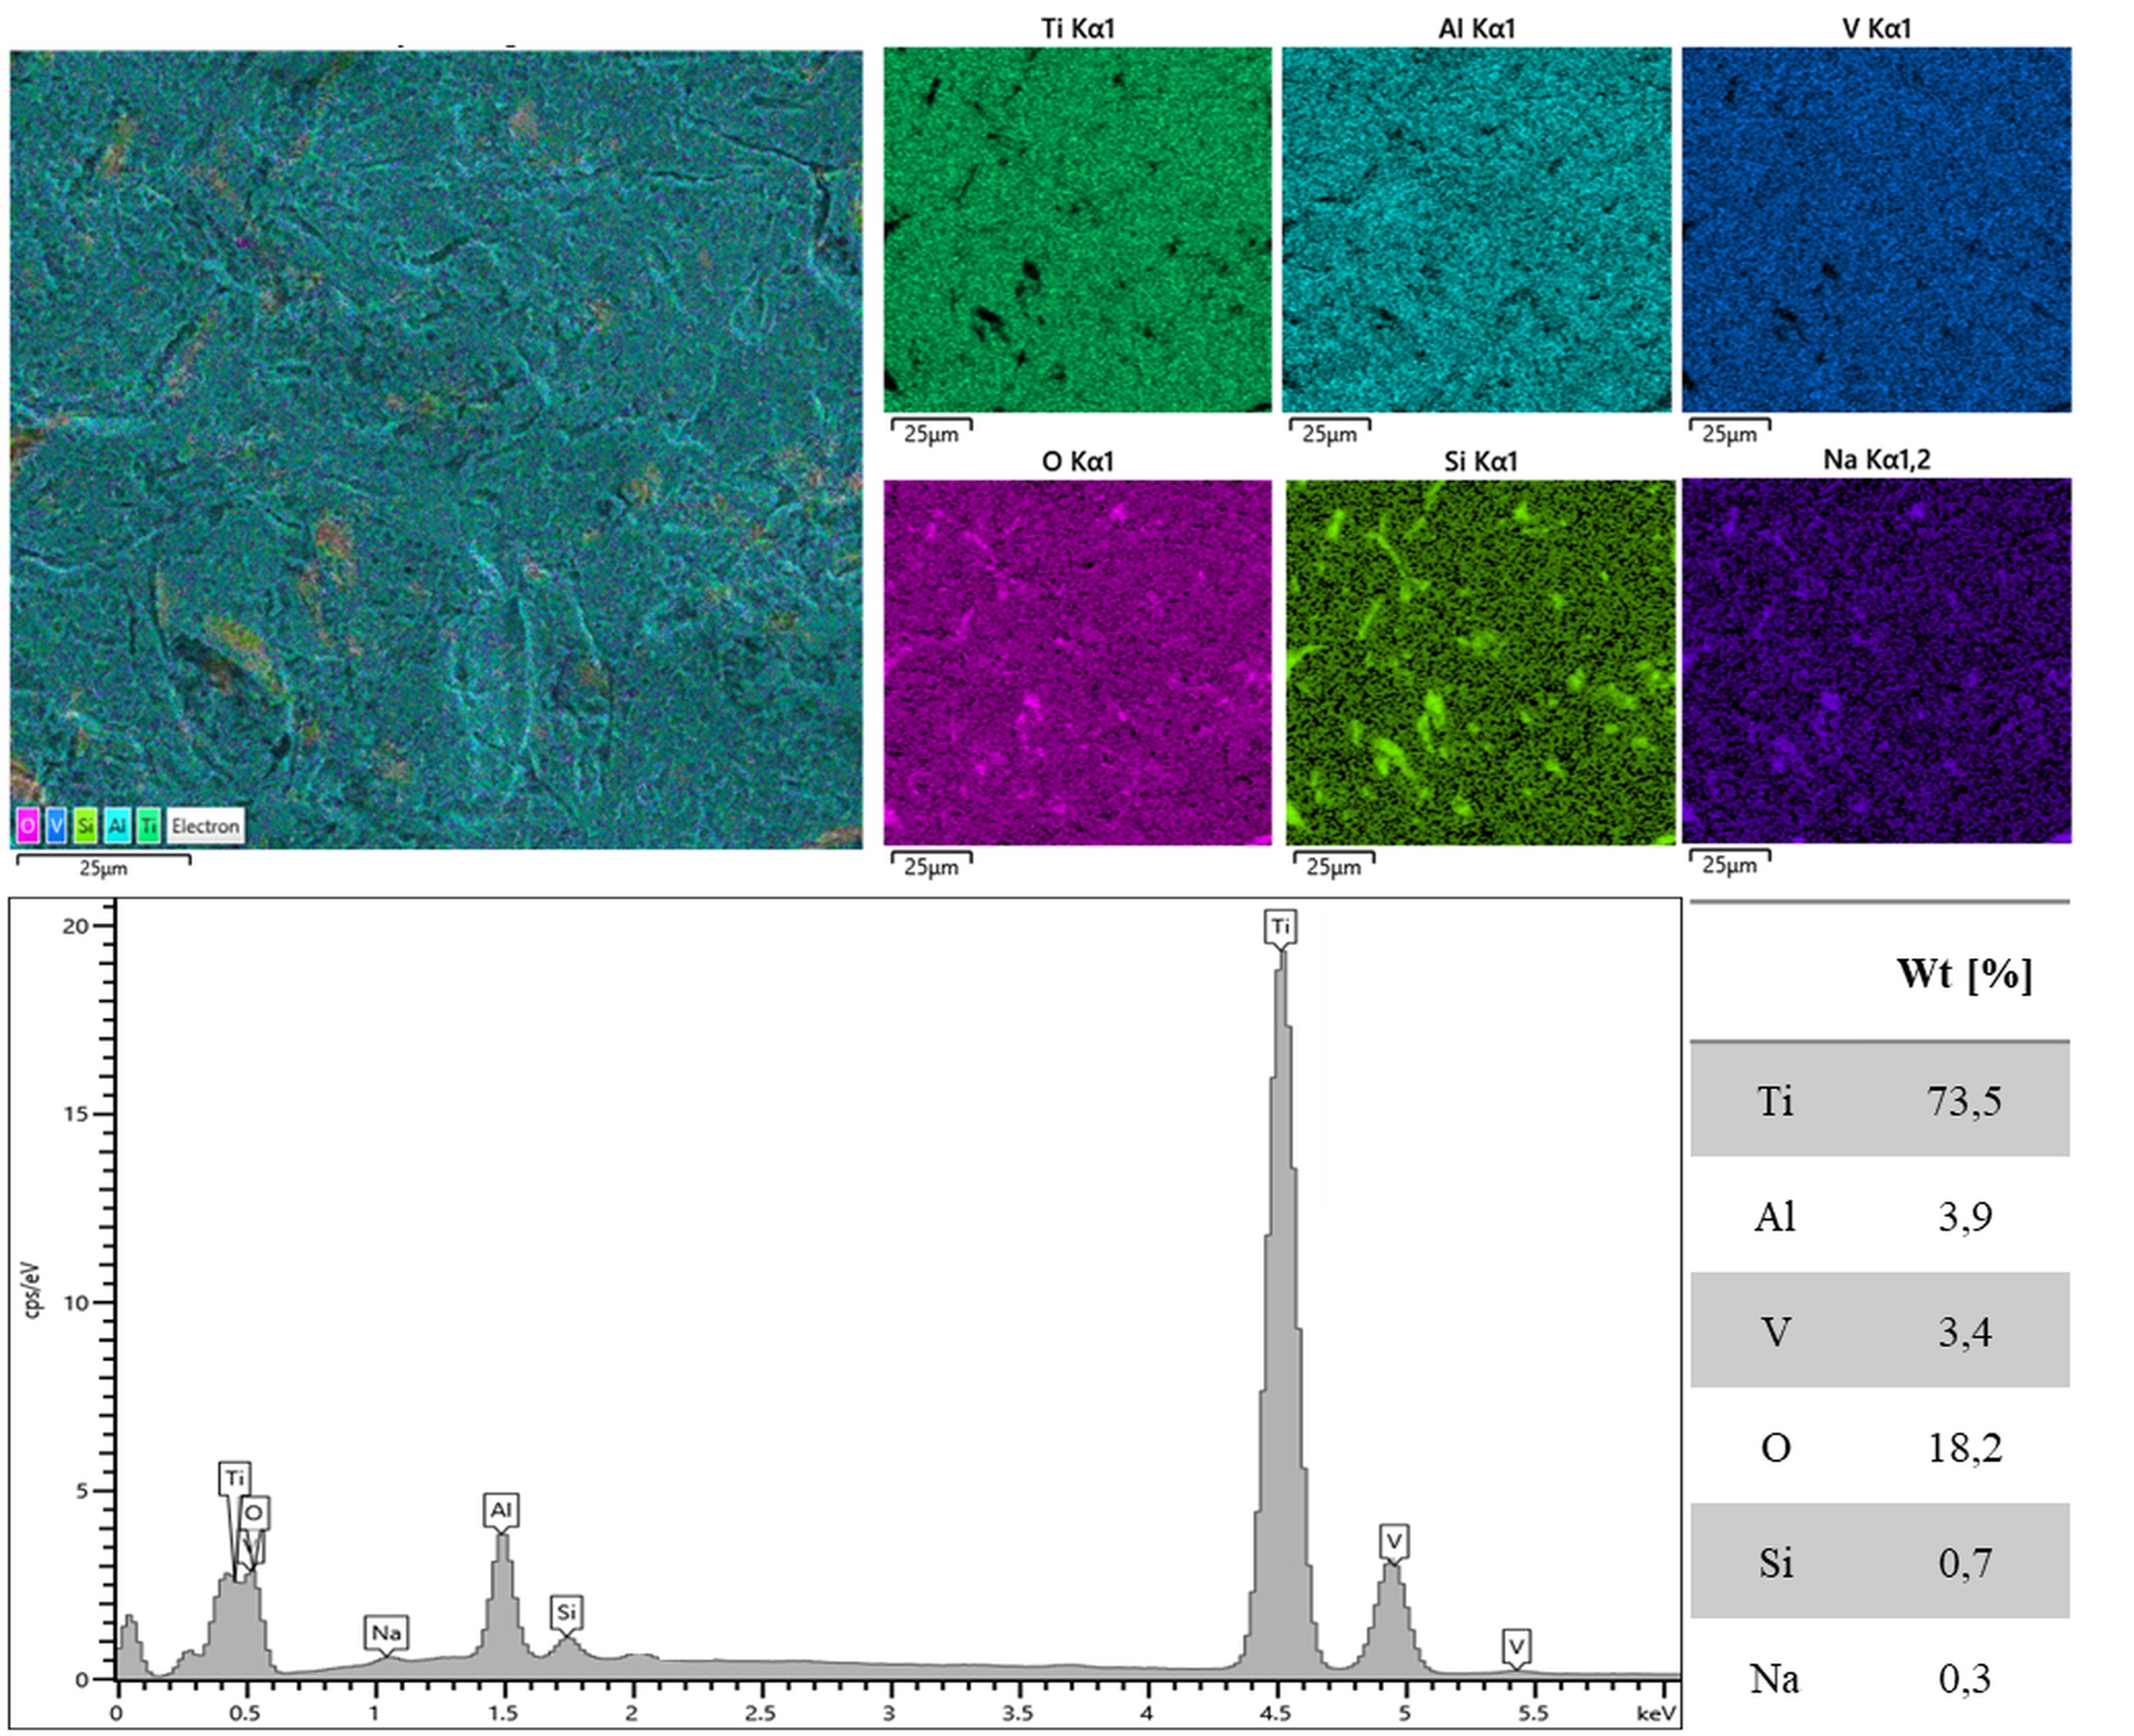
Fig. 14. Image of the SEM surface subjected to EDS analysis with an overlaid map of the element distribution: left - summary map, right - map of identified elements. EDS spectrum of the examined lower surface with the determined chemical composition
In order to check the chemical composition of the examined films the XPS analysis was performed. The XPS measurements were assisted with ion etching for detailed in-depth description of examined layers. In order to reduce possible preferential oxygen etching as well as other ion beam-induced distortions grazing incidence of ion beam was employed.
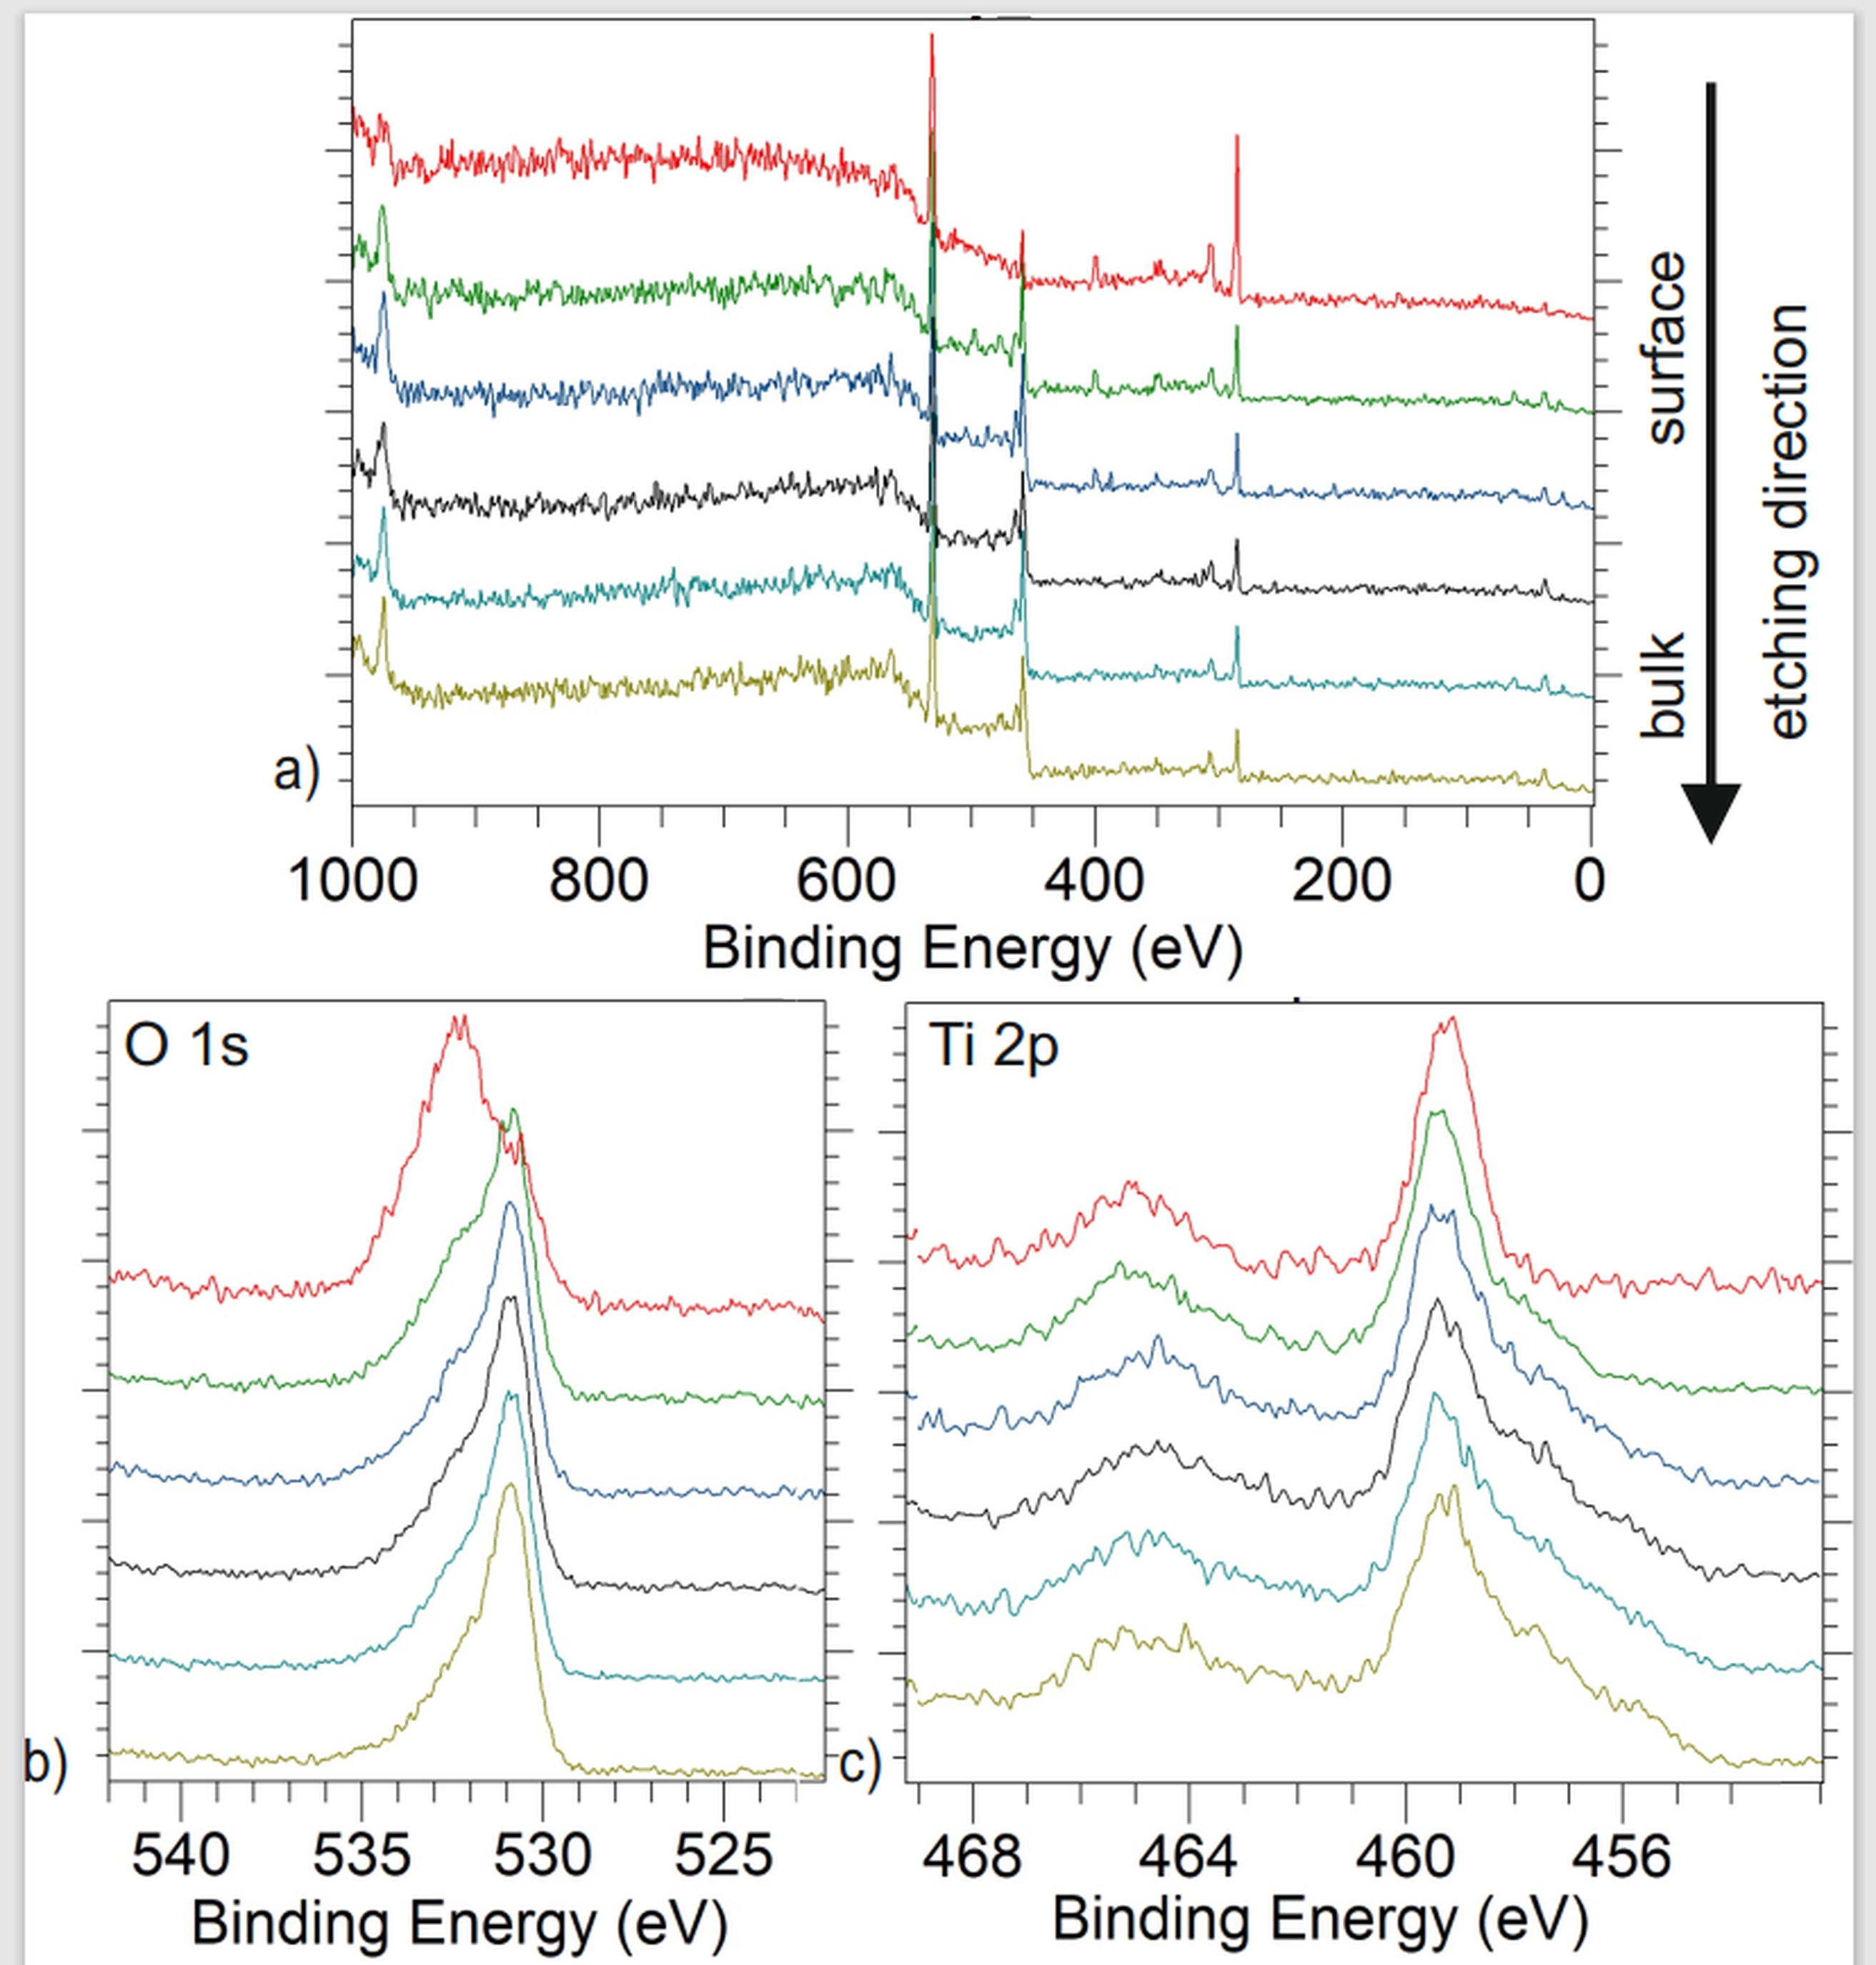
Figure 15 a) presents survey spectra of the surface scan as well as the consecutive scans upon ion depth profiling. Main and expected core lines are clearly visible, i.e. O 1s at ~530 eV, Ti 2p at ~460 eV, C 1s at ~284 eV. The trace N and Ca lines (at ~400 eV and 350 eV respectively) can be observed. However, together with carbon signal one can treat them as residual contamination since together with in-depth profile the mentioned signals are disappearing.
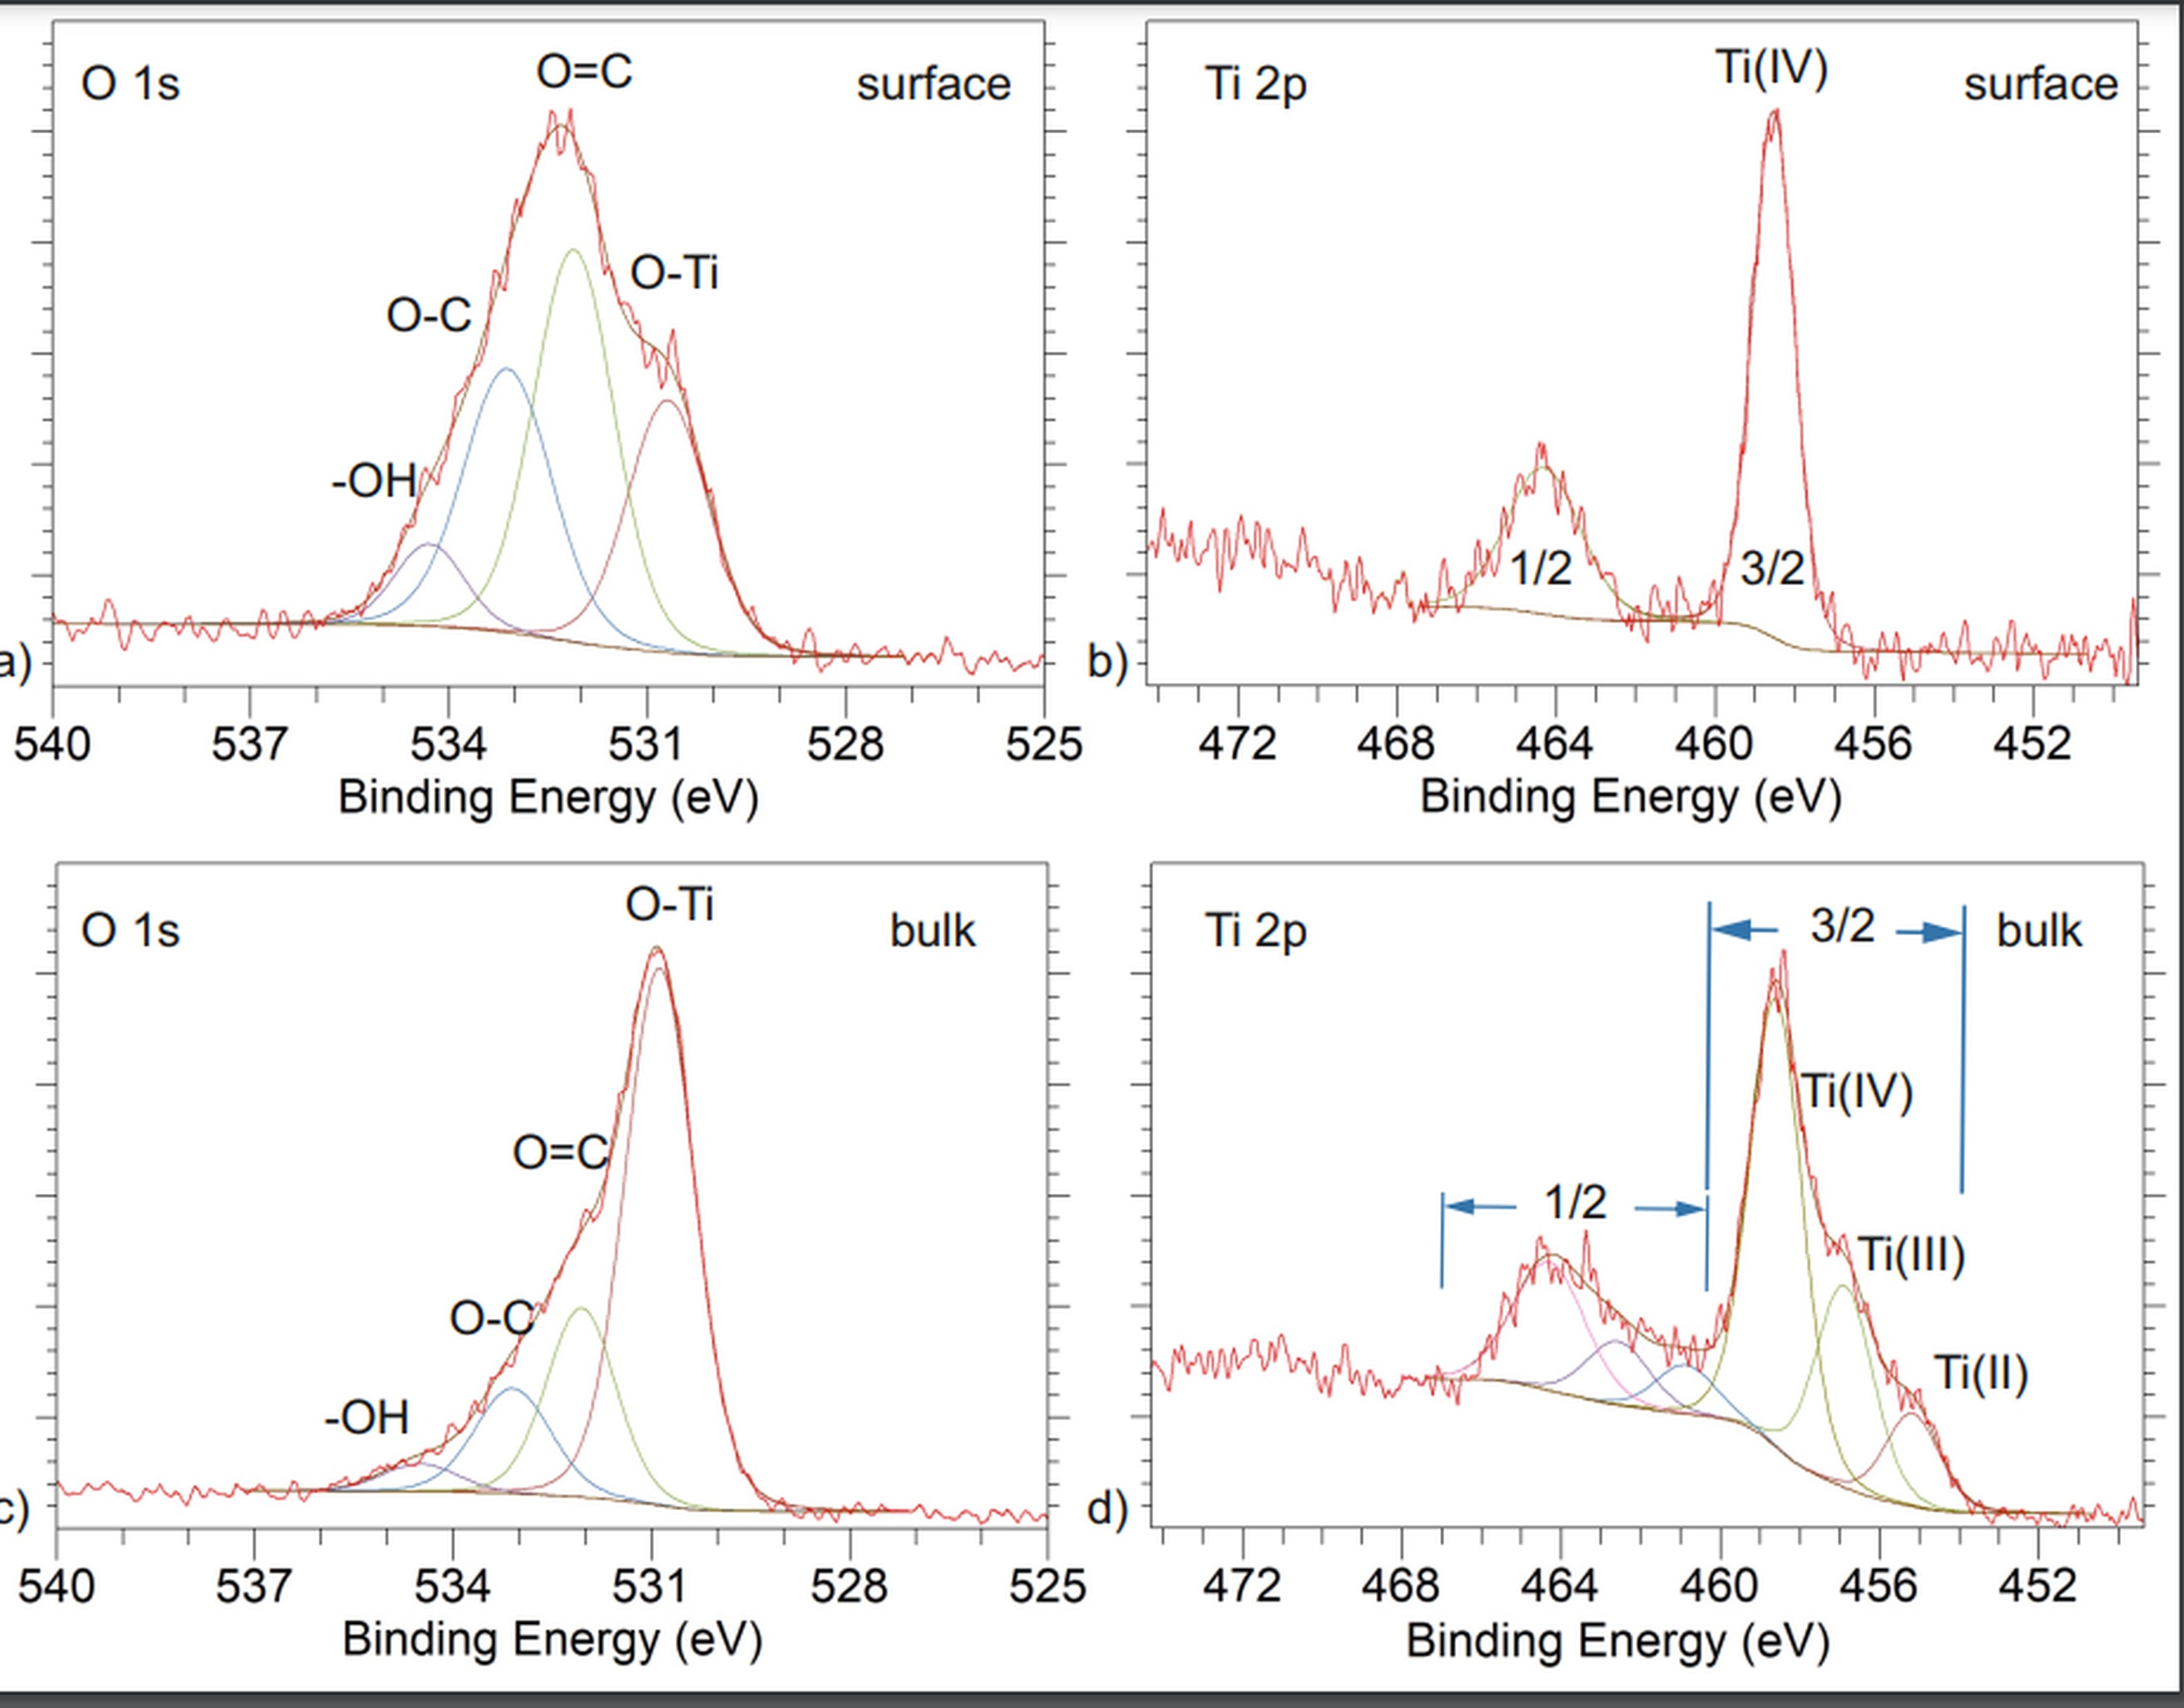
Figure 15 b) and c) presents the magnification of the regions of interest, i.e. o 1s and Ti 2p respectively. In O 1s spectrum, one can observe the significant decrease of the high binding energy branch and shift of the peak’s center towards lower binding energies along etching procedure. In case of Ti 2p core level the single distinct component at ~458.5 eV (with its spin orbit splitting counterpart at ~465 eV) can be clearly observed for surface scan. The energy position points clearly the Ti(IV) oxide with near-stoichiometric composition [19]. For in-depth signals, however, one can notice additional contributions appearing below ~459 eV indicating sub – stoichiometric composition or other Ti oxidation states.
For precise description of the oxide composition these two regions (i.e. O 1s and Ti 2p) underwent detailed decomposition. Figure 16 a) and b) presents decomposition results for the spectra acquired for the initial (non-etched) surface for o 1s and Ti 2p regions respectively. Next, panels c) and d) in Figure 16 shows the decomposition results of the bulk – related core levels after last ion etching procedure. One can see that the O 1s region (surface one) can be decomposed with four components representing (from lowest binding energy) O-Ti configuration, O=C, O-C/O-C-O and -OH configurations (14). The bulk signal (Figure 16 c)) is represented with the same components, however with significant decrease of the carbonaceous and -OH related species. This is consistent with decrease of the carbon signal along etching procedure (see Figure 15 a)). The main component (O-Ti), even if relatively narrow (i.e. ~1.35 eV full width at half maximum) does not however allow on titanium oxide composition description. Therefore Ti 2p analysis was also done. For the surface related Ti 2p region (Figure 16 b)) presents distinct Ti 2p 3/2 signal with its spin-orbit splitting ½ counterpart. The ½ to 3/2 energy distance as well as the 3/2 energy position points near-to stoichiometric Ti (IV) oxide with no suboxides (the FWHM is below 1.18 eV). After the etching process, for the bulk region (Figure 16 d)) two additional components appears at ~456.8 eV and at ~455.2 eV. The energy positions indicates that the most probable configurations are Ti (III) and Ti (II) oxides respectively [19]. However, the dominating one (>80 % of the overall signal) is still Ti (IV) oxide with main component at ~458.7 eV [2, 3] which is important, no Ti0 state was detected.
Discussion
The presented research results are part of the authors' ongoing work on small animal orthopedics, mainly the design of implants for the treatment of fractures of dogs. This issue is a complex process due to various factors, such as the age of the dog, the location of the fracture, the nature of the fracture or the type of surgical technique. In addition to factors of biological nature, the success of fracture treatment is also affected by interactions in the implant-organism system, where there are both, interactions of chemical nature, such as the environment of body fluids, and interactions of mechanical nature, which are the result of the dog's activity. Poor implant manufacturing quality can cause corrosion damage, causing the implant to break, or, via degradation products, lead to osteolysis, as a result of which the implant may become loose.
In order to evaluate the physical and chemical properties of the implant, which have a major impact on the quality of the fixation system, a testing program was developed. It included surface observations, evaluation of the material structure, hardness tests and its profile, adhesion of the coating to the substrate, corrosion resistance, wettability, and studies of the chemical composition of the surface and passive layer. The tested implants were characterized by a blue coloration of the surface layer, which is the result of anodic oxidation (Figure 2). Observations of the surface topography of the implants showed the presence of evenly distributed indentations, which are the residue of vibratory treatment (Figure 3). The roughness of the surface was varied (Table 1, 2), with the lower surface, adjacent to the bone, showing greater roughness. The surface of the implants was characterized by hydrophilicity, the value of the wetting angle was Θ = 57.5±2.4°. The roughness of the surface and its hydrophilic nature indicate good osteoconductive properties of the implant, ensuring proper interaction between the implant and bone tissue [15, 16, 20]. Adhesion tests showed good adhesion of the surface layer to the substrate. Based on the measurements, the coating broke at Lc2 = 1.27 ± 0.05 N, and complete breakage was observed at Lc3 = 3.46 ± 0.1 N. Macroscopic scratch evaluation showed discontinuous perforation of the coating. Hardness results showed different values depending on the distance from the implant surface (Figure 8). Higher hardness was observed in the surface layer to a depth of about 4000 nm, compared to the core of the material. This effect may be due to the strengthening of the material caused by the application of vibratory treatment preceding the anodic oxidation process. Microstructure observations proved that the implant is made of a biphasic α+β titanium alloy (Figure 6). Qualitative analysis of the chemical composition of the implant showed that the implant is made of Ti6Al4V alloy (Figure 13, 14). Trace amounts of silicon and sodium were observed in the surface layer on the bone side, which may be a residue from vibration treatment. Examination of the passive layer produced by anodic oxidation showed that it consists mainly of titanium oxides (Figure 15, 16). The absence of vanadium and aluminum in the passive layer is favorable due to their toxic effects. The polarization curves obtained in electrochemical tests by potentiodynamic method are characterized by the absence of hysteresis loops. This indicates the corrosion resistance of the implant (Figure 10). The absence of corrosion damage characteristic for pitting corrosion was confirmed by microscopic observations of the samples' surfaces after corrosion tests. The resistance of the implants to pitting corrosion is the result of vibratory treatment, strengthening the near-surface layer, and the formation of a passive layer, consisting mainly of TiO2 oxide, as a result of anodic oxidation [17].
Summary
The scope of the study proposed in the paper enabled a comprehensive analysis of the physical and chemical properties of the plate for treating dog pelvic fractures. The results indicate that the implant is of good quality, characterized by corrosion resistance obtained through the applied surface treatment. The hydrophilic nature of the surface and its topography, indicate the osteoconductive properties of the surface layer. The results obtained can provide a basis for the development of specific criteria for evaluating the quality of veterinary products used in the skeletal system, which will ensure the required biocompatibility of implants, minimizing the risk of postoperative complications in animals. As a result, this will contribute to increasing the effectiveness of therapy, reducing the number of complications and improving the quality of dogs’ life.